Sour Lake, Texas

Submit your own pictures of this city and show them to the world
- OSM Map
- General Map
- Google Map
- MSN Map
Population change since 2000: +9.2%
 |
| Males: 878 | |
| Females: 943 |
| Median resident age: | 30.6 years |
| Texas median age: | 35.6 years |
Zip codes: 77659.
| Sour Lake: | $64,841 |
| TX: | $72,284 |
Estimated per capita income in 2022: $28,335 (it was $15,497 in 2000)
Sour Lake city income, earnings, and wages data
Estimated median house or condo value in 2022: $147,999 (it was $46,400 in 2000)
| Sour Lake: | $147,999 |
| TX: | $275,400 |
Mean prices in 2022: all housing units: $192,611; detached houses: $206,682; mobile homes: $135,108
Median gross rent in 2022: $1,187.
(16.1% for White Non-Hispanic residents, 3.4% for Hispanic or Latino residents)
Detailed information about poverty and poor residents in Sour Lake, TX
Compare current foreclosures near Sour Lake, TX:
| Photo | Address | Area | Beds / Baths | Price | Details |
|---|---|---|---|---|---|

|
#1
Holly Trails
Sour Lake, TX 77659
|
- sq. feet
|
2 baths 4 beds |
show details | |

|
#2
Pinewood Blvd
Sour Lake, TX 77659
|
2,704 sq. feet
|
2 baths 3 beds |
show details | |

|
#3
Pinemont Dr
Sour Lake, TX 77659
|
1,994 sq. feet
|
2 baths 4 beds |
show details | |

|
#4
Tomlinson St
Sour Lake, TX 77659
|
2,152 sq. feet
|
- baths - beds |
show details | |

|
#5
Farmer Rd
Sour Lake, TX 77659
|
- sq. feet
|
- baths - beds |
show details | |

|
#6
Gilbert St
Sour Lake, TX 77659
|
- sq. feet
|
- baths - beds |
show details | |

|
#7
Holly Trls Way
Sour Lake, TX 77659
|
- sq. feet
|
- baths - beds |
show details | |

|
#8
Piney Point Dr
Sour Lake, TX 77659
|
- sq. feet
|
- baths - beds |
show details | |

|
#9
S Fannin St
Sour Lake, TX 77659
|
- sq. feet
|
- baths - beds |
show details | |

|
#10
S Merchant St
Sour Lake, TX 77659
|
- sq. feet
|
- baths - beds |
show details |
| Photo | Address | Area | Beds / Baths | Price | Details |
|---|---|---|---|---|---|

|
#11
Leaning Oaks Dr
Beaumont, TX 77713
|
1,998 sq. feet
|
2 baths 3 beds |
$229,900
|
show details |

|
#12
Shiloh Dr
Beaumont, TX 77706
|
1,883 sq. feet
|
2 baths 3 beds |
show details | |

|
#13
Kolander Rd
Beaumont, TX 77713
|
1,440 sq. feet
|
2 baths 3 beds |
show details | |

|
#14
East Avenue B
Devers, TX 77538
|
- sq. feet
|
3 baths 5 beds |
show details | |

|
#15
Largent Rd
Batson, TX 77519
|
2,137 sq. feet
|
2 baths 3 beds |
show details | |

|
#16
Milton Dr
Beaumont, TX 77706
|
1,424 sq. feet
|
2 baths 3 beds |
show details | |

|
#17
Digmon Rd
Kountze, TX 77625
|
- sq. feet
|
2 baths 4 beds |
show details | |

|
#18
Hilda
Lumberton, TX 77657
|
2,580 sq. feet
|
2 baths - beds |
show details | |

|
#19
Greenridge Ln
Beaumont, TX 77707
|
1,144 sq. feet
|
- baths - beds |
show details | |

|
#20
Broadmoor Dr
Beaumont, TX 77707
|
1,344 sq. feet
|
- baths - beds |
show details |
| Photo | Address | Area | Beds / Baths | Price | Details |
|---|---|---|---|---|---|

|
#21
Cobblestone Ter
Lumberton, TX 77657
|
2,244 sq. feet
|
- baths - beds |
show details | |

|
#22
Crow Rd Apt 7
Beaumont, TX 77706
|
- sq. feet
|
- baths - beds |
show details | |

|
#23
Norwood Dr
Lumberton, TX 77657
|
2,486 sq. feet
|
- baths - beds |
show details | |

|
#24
Stanford St
Beaumont, TX 77708
|
1,048 sq. feet
|
- baths - beds |
show details | |

|
#25
Saint Andrews Dr
Beaumont, TX 77707
|
2,313 sq. feet
|
- baths - beds |
show details | |

|
#26
Prutzman St
Beaumont, TX 77706
|
855 sq. feet
|
- baths - beds |
show details | |

|
#27
Peck Rd
Lumberton, TX 77657
|
1,448 sq. feet
|
- baths - beds |
show details | |

|
#28
Cedar Dr
Lumberton, TX 77657
|
- sq. feet
|
- baths - beds |
show details | |

|
#29
Crow Rd Apt 215
Beaumont, TX 77706
|
- sq. feet
|
- baths - beds |
show details | |

|
#30
Avenue Of The Oaks
Beaumont, TX 77707
|
3,716 sq. feet
|
- baths - beds |
show details |
| Photo | Address | Area | Beds / Baths | Price | Details |
|---|---|---|---|---|---|

|
#31
Coolidge St
Beaumont, TX 77706
|
2,202 sq. feet
|
- baths - beds |
show details | |

|
#32
Dellwood Ln
Beaumont, TX 77706
|
2,609 sq. feet
|
- baths - beds |
show details | |

|
#33
W Walton Rd
Lumberton, TX 77657
|
- sq. feet
|
- baths - beds |
show details | |

|
#34
Paula Rd, Trlr 2
Kountze, TX 77625
|
- sq. feet
|
- baths - beds |
show details | |

|
#35
Pansy Dr
Beaumont, TX 77706
|
1,835 sq. feet
|
- baths - beds |
show details | |

|
#36
Torrey Pines Cir
Beaumont, TX 77707
|
2,013 sq. feet
|
- baths - beds |
show details | |

|
#37
Prutzman St
Beaumont, TX 77706
|
918 sq. feet
|
- baths - beds |
show details | |

|
#38
W Bend
Beaumont, TX 77706
|
4,343 sq. feet
|
- baths - beds |
show details | |

|
#39
Oakmont Dr
Beaumont, TX 77706
|
4,410 sq. feet
|
- baths - beds |
show details | |

|
#40
Turnberry Cir
Beaumont, TX 77707
|
2,674 sq. feet
|
- baths - beds |
show details |
| Photo | Address | Area | Beds / Baths | Price | Details |
|---|---|---|---|---|---|

|
#41
Junker Rd
Beaumont, TX 77707
|
1,730 sq. feet
|
- baths - beds |
show details | |

|
#42
Brace St
Beaumont, TX 77708
|
2,604 sq. feet
|
- baths - beds |
show details | |

|
#43
Bryan Ln
Lumberton, TX 77657
|
1,216 sq. feet
|
- baths - beds |
show details | |

|
#44
Westgate Dr
Beaumont, TX 77706
|
1,999 sq. feet
|
- baths - beds |
show details | |

|
#45
Wellington Oaks St
Beaumont, TX 77706
|
- sq. feet
|
- baths - beds |
show details | |

|
#46
Plant Rd
Beaumont, TX 77708
|
4,068 sq. feet
|
- baths - beds |
show details | |

|
#47
Glen Oaks Cir
Beaumont, TX 77708
|
1,213 sq. feet
|
- baths - beds |
show details | |

|
#48
Beaumont Dr
Beaumont, TX 77708
|
1,456 sq. feet
|
- baths - beds |
show details | |

|
#49
Cooks Lake Rd
Lumberton, TX 77657
|
- sq. feet
|
- baths - beds |
show details | |

|
Check over 1 million property listings on Foreclosure.com!
|
browse all offers | |||


- 1,81284.7%White alone
- 1537.2%Hispanic
- 703.3%Asian alone
- 371.7%Two or more races
- 170.8%Other race alone
- 90.4%Black alone

Races in Sour Lake detailed stats: ancestries, foreign born residents, place of birth
According to our research of Texas and other state lists, there were 11 registered sex offenders living in Sour Lake, Texas as of April 24, 2024.
The ratio of all residents to sex offenders in Sour Lake is 162 to 1.
Type |
2009 |
2010 |
2011 |
2012 |
2013 |
2014 |
2015 |
2016 |
2017 |
2018 |
2019 |
2020 |
2021 |
2022 |
|---|---|---|---|---|---|---|---|---|---|---|---|---|---|---|
| Murders (per 100,000) | 0 (0.0) | 0 (0.0) | 0 (0.0) | 0 (0.0) | 0 (0.0) | 0 (0.0) | 0 (0.0) | 0 (0.0) | 0 (0.0) | 0 (0.0) | 0 (0.0) | 0 (0.0) | 0 (0.0) | 0 (0.0) |
| Rapes (per 100,000) | 0 (0.0) | 0 (0.0) | 0 (0.0) | 0 (0.0) | 0 (0.0) | 0 (0.0) | 0 (0.0) | 0 (0.0) | 0 (0.0) | 0 (0.0) | 2 (106.0) | 0 (0.0) | 1 (51.0) | 0 (0.0) |
| Robberies (per 100,000) | 0 (0.0) | 0 (0.0) | 0 (0.0) | 0 (0.0) | 1 (56.1) | 0 (0.0) | 0 (0.0) | 0 (0.0) | 0 (0.0) | 0 (0.0) | 0 (0.0) | 0 (0.0) | 0 (0.0) | 0 (0.0) |
| Assaults (per 100,000) | 2 (114.7) | 3 (165.5) | 4 (216.1) | 3 (161.3) | 4 (224.5) | 4 (224.0) | 1 (56.3) | 1 (56.7) | 4 (218.0) | 0 (0.0) | 4 (212.0) | 10 (516.3) | 1 (51.0) | 0 (0.0) |
| Burglaries (per 100,000) | 13 (745.4) | 6 (330.9) | 10 (540.2) | 8 (430.1) | 7 (392.8) | 8 (447.9) | 1 (56.3) | 8 (453.3) | 5 (272.5) | 2 (107.5) | 6 (318.0) | 6 (309.8) | 4 (203.9) | 2 (110.7) |
| Thefts (per 100,000) | 32 (1,835) | 45 (2,482) | 28 (1,513) | 15 (806.5) | 39 (2,189) | 24 (1,344) | 13 (732.4) | 20 (1,133) | 19 (1,035) | 17 (914.0) | 13 (688.9) | 10 (516.3) | 13 (662.6) | 20 (1,107) |
| Auto thefts (per 100,000) | 3 (172.0) | 4 (220.6) | 2 (108.0) | 2 (107.5) | 2 (112.2) | 2 (112.0) | 2 (112.7) | 7 (396.6) | 3 (163.5) | 4 (215.1) | 5 (265.0) | 4 (206.5) | 2 (101.9) | 2 (110.7) |
| Arson (per 100,000) | 0 (0.0) | 0 (0.0) | 0 (0.0) | 1 (53.8) | 0 (0.0) | 0 (0.0) | 0 (0.0) | 0 (0.0) | 0 (0.0) | 0 (0.0) | 0 (0.0) | 0 (0.0) | 2 (101.9) | 0 (0.0) |
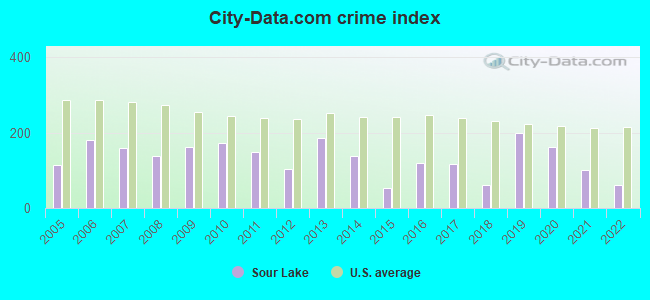
| City-Data.com crime index | 162.3 | 173.2 | 150.2 | 103.2 | 185.7 | 138.9 | 53.5 | 120.1 | 117.2 | 61.3 | 198.2 | 162.1 | 99.9 | 60.9 |
The City-Data.com crime index weighs serious crimes and violent crimes more heavily. Higher means more crime, U.S. average is 246.1. It adjusts for the number of visitors and daily workers commuting into cities.
Crime rate in Sour Lake detailed stats: murders, rapes, robberies, assaults, burglaries, thefts, arson
Full-time law enforcement employees in 2021, including police officers: 10 (8 officers - 6 male; 2 female).
| Officers per 1,000 residents here: | 4.08 |
| Texas average: | 2.07 |
 Recent articles from our blog. Our writers, many of them Ph.D. graduates or candidates, create easy-to-read articles on a wide variety of topics.


Latest news from Sour Lake, TX collected exclusively by city-data.com from local newspapers, TV, and radio stations
Ancestries: German (25.2%), Irish (9.0%), American (8.1%), English (6.8%), Scottish (4.8%), French (3.5%).
Current Local Time: CST time zone
Elevation: 44 feet
Land area: 1.73 square miles.
Population density: 1,053 people per square mile (low).
82 residents are foreign born (2.2% Latin America, 1.1% Asia, 0.5% Europe).
| This city: | 3.8% |
| Texas: | 17.1% |
Median real estate property taxes paid for housing units with mortgages in 2022: $3,530 (1.7%)
Median real estate property taxes paid for housing units with no mortgage in 2022: $982 (1.0%)
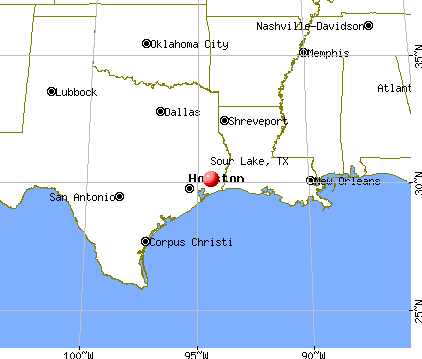
Nearest city with pop. 50,000+: Beaumont, TX  (17.3 miles , pop. 113,866).
Nearest city with pop. 200,000+: Southeast Montgomery, TX (58.1 miles , pop. 208,076).
Nearest city with pop. 1,000,000+: Houston, TX (63.9 miles , pop. 1,953,631).
Nearest cities:
), ), ), ), ), Latitude: 30.14 N, Longitude: 94.41 W
Area code: 409


Single-family new house construction building permits:
- 2022: 25 buildings, average cost: $259,000
- 2021: 10 buildings, average cost: $175,000
- 2020: 11 buildings, average cost: $196,400
- 2019: 11 buildings, average cost: $168,200
- 2018: 22 buildings, average cost: $200,000
- 2017: 23 buildings, average cost: $153,300
- 2016: 14 buildings, average cost: $175,000
- 2015: 4 buildings, average cost: $96,300
- 2014: 3 buildings, average cost: $221,500
- 2013: 2 buildings, average cost: $192,600


| Here: | 4.3% |
| Texas: | 3.5% |
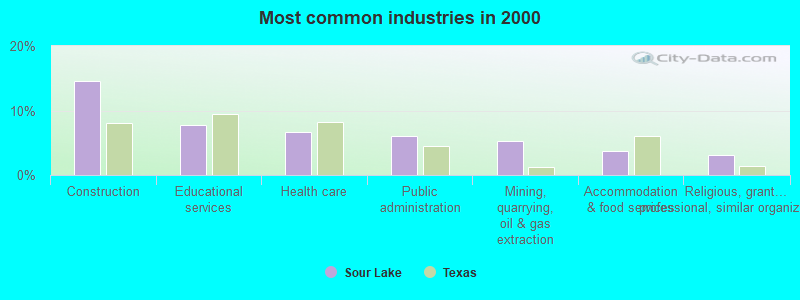
- Construction (14.6%)
- Educational services (7.8%)
- Health care (6.6%)
- Public administration (6.0%)
- Mining, quarrying, oil & gas extraction (5.2%)
- Accommodation & food services (3.8%)
- Religious, grantmaking, civic, professional, similar organizations (3.2%)
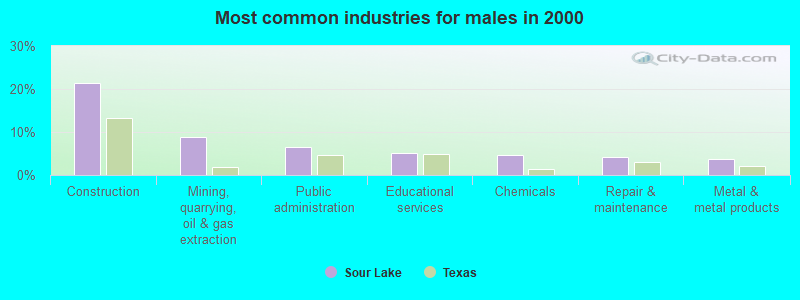
- Construction (21.4%)
- Mining, quarrying, oil & gas extraction (8.7%)
- Public administration (6.6%)
- Educational services (5.0%)
- Chemicals (4.8%)
- Repair & maintenance (4.2%)
- Metal & metal products (3.7%)
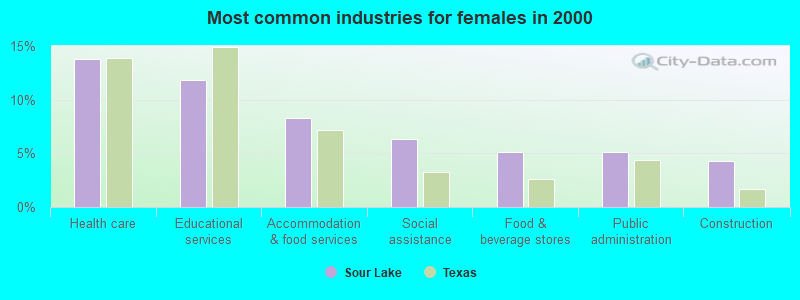
- Health care (13.8%)
- Educational services (11.8%)
- Accommodation & food services (8.3%)
- Social assistance (6.3%)
- Food & beverage stores (5.1%)
- Public administration (5.1%)
- Construction (4.3%)

- Driver/sales workers and truck drivers (5.2%)
- Secretaries and administrative assistants (4.6%)
- Electrical equipment mechanics and other installation, maintenance, and repair workers, including supervisors (4.3%)
- Other sales and related occupations, including supervisors (4.3%)
- Preschool, kindergarten, elementary, and middle school teachers (4.0%)
- Other production occupations, including supervisors (4.0%)
- Other management occupations, except farmers and farm managers (3.6%)

- Driver/sales workers and truck drivers (8.7%)
- Electrical equipment mechanics and other installation, maintenance, and repair workers, including supervisors (7.1%)
- Other production occupations, including supervisors (6.1%)
- Other management occupations, except farmers and farm managers (5.6%)
- Supervisors, construction and extraction workers (5.0%)
- Pipelayers, plumbers, pipefitters, and steamfitters (4.5%)
- Law enforcement workers, including supervisors (4.2%)

- Secretaries and administrative assistants (10.6%)
- Preschool, kindergarten, elementary, and middle school teachers (8.7%)
- Other office and administrative support workers, including supervisors (7.9%)
- Other sales and related occupations, including supervisors (7.5%)
- Health technologists and technicians (5.5%)
- Cashiers (5.1%)
- Registered nurses (5.1%)
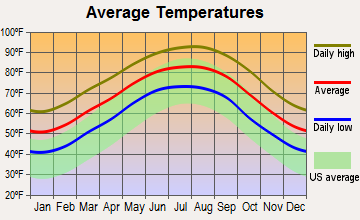
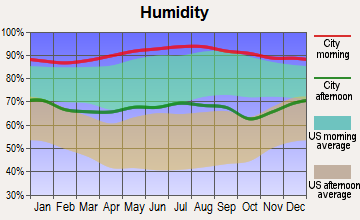
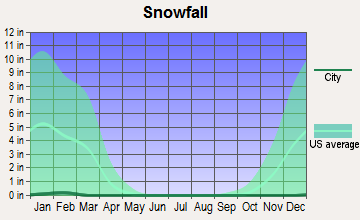
Average climate in Sour Lake, Texas
Based on data reported by over 4,000 weather stations


|
|

(lower is better)

Air Quality Index (AQI) level in 2022 was 74.3. This is about average.
| City: | 74.3 |
| U.S.: | 72.6 |

Nitrogen Dioxide (NO2) [ppb] level in 2022 was 4.15. This is better than average. Closest monitor was 13.9 miles away from the city center.
| City: | 4.15 |
| U.S.: | 5.11 |

Sulfur Dioxide (SO2) [ppb] level in 2022 was 0.665. This is significantly better than average. Closest monitor was 13.9 miles away from the city center.
| City: | 0.665 |
| U.S.: | 1.515 |

Ozone [ppb] level in 2022 was 25.8. This is better than average. Closest monitor was 17.8 miles away from the city center.
| City: | 25.8 |
| U.S.: | 33.3 |

Particulate Matter (PM2.5) [µg/m3] level in 2022 was 8.14. This is about average. Closest monitor was 19.6 miles away from the city center.
| City: | 8.14 |
| U.S.: | 8.11 |
Tornado activity:
Sour Lake-area historical tornado activity is slightly above Texas state average. It is 73% greater than the overall U.S. average.
On 11/21/1992, a category F4 (max. wind speeds 207-260 mph) tornado 29.7 miles away from the Sour Lake city center injured 16 people and caused between $50,000,000 and $500,000,000 in damages.
On 1/1/1999, a category F3 (max. wind speeds 158-206 mph) tornado 6.0 miles away from the city center injured 5 people and caused $500,000 in damages.
Earthquake activity:
Sour Lake-area historical earthquake activity is significantly above Texas state average. It is 36% smaller than the overall U.S. average.On 5/17/2012 at 08:12:00, a magnitude 4.8 (4.8 MW, Depth: 3.1 mi, Class: Light, Intensity: IV - V) earthquake occurred 123.8 miles away from Sour Lake center
On 9/2/2013 at 23:51:15, a magnitude 4.3 (4.3 MW, Depth: 2.9 mi) earthquake occurred 122.6 miles away from the city center
On 10/20/2011 at 12:24:41, a magnitude 4.8 (4.8 MW, Depth: 3.1 mi) earthquake occurred 237.9 miles away from Sour Lake center
On 9/2/2013 at 21:52:38, a magnitude 4.2 (4.2 MW, Depth: 3.0 mi) earthquake occurred 126.7 miles away from the city center
On 1/25/2013 at 07:01:19, a magnitude 4.1 (4.1 MB, Depth: 3.1 mi) earthquake occurred 118.2 miles away from the city center
On 5/10/2012 at 15:15:38, a magnitude 3.9 (3.9 MW, Depth: 4.3 mi, Class: Light, Intensity: II - III) earthquake occurred 126.4 miles away from the city center
Magnitude types: body-wave magnitude (MB), moment magnitude (MW)
Natural disasters:
The number of natural disasters in Hardin County (22) is greater than the US average (15).Major Disasters (Presidential) Declared: 12
Emergencies Declared: 8
Causes of natural disasters: Floods: 9, Storms: 9, Hurricanes: 7, Tornadoes: 5, Fires: 3, Winds: 2, Tropical Storm: 1, Other: 2 (Note: some incidents may be assigned to more than one category).
Hospitals and medical centers in Sour Lake:
Other hospitals and medical centers near Sour Lake:
- LOOP ROAD LIVING CENTER (Hospital, about 13 miles away; BEAUMONT, TX)
- CHERYL LIVING CENTER (Hospital, about 13 miles away; BEAUMONT, TX)
- BEAUMONT QUALITY HOME HEALTH CARE (Home Health Center, about 13 miles away; BEAUMONT, TX)
- HARBOR HOSPICE OF BEAUMONT (Hospital, about 14 miles away; BEAUMONT, TX)
- SAN DIEGO GROUP HOME (Hospital, about 14 miles away; BEAUMONT, TX)
- LANDIS GROUP HOME (Hospital, about 14 miles away; BEAUMONT, TX)
- GREEN ACRES CONV CTR PARKDALE (Nursing Home, about 14 miles away; BEAUMONT, TX)
Heliports located in Sour Lake:
Colleges/universities with over 2000 students nearest to Sour Lake:
- Lamar Institute of Technology (about 21 miles; Beaumont, TX; Full-time enrollment: 2,023)
- Lamar University (about 21 miles; Beaumont, TX; FT enrollment: 13,658)
- Lee College (about 45 miles; Baytown, TX; FT enrollment: 4,278)
- San Jacinto Community College (about 54 miles; Pasadena, TX; FT enrollment: 13,517)
- University of Houston-Clear Lake (about 57 miles; Houston, TX; FT enrollment: 5,833)
- Universal Technical Institute of Texas Inc. (about 61 miles; Houston, TX; FT enrollment: 3,236)
- The University of Texas Medical Branch (about 62 miles; Galveston, TX; FT enrollment: 2,314)
Public high school in Sour Lake:
- HARDIN-JEFFERSON H S (Students: 582, Location: 3155 HWY 326 S, Grades: 9-12)
Public elementary/middle school in Sour Lake:
- SOUR LAKE EL (Students: 641, Location: 1055 HWY 326 S, Grades: PK-5)
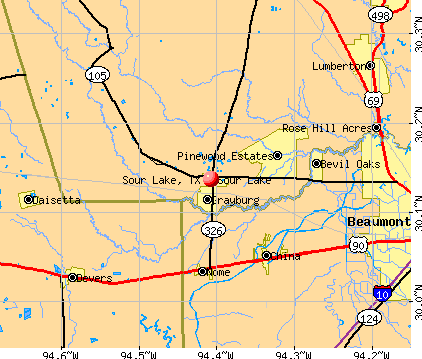
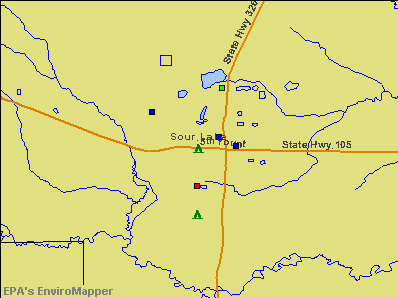
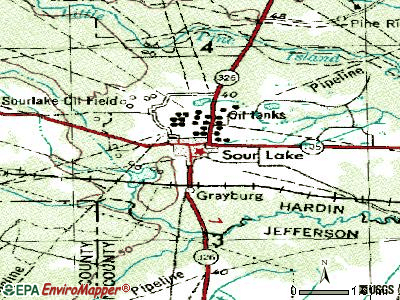
Points of interest:
Notable locations in Sour Lake: Sour Lake Volunteer Fire Department / Hardin County Emergency Services District 5 (A), Sour Lake Police Department (B). Display/hide their locations on the map
Cemetery: Rosedale Cemetery (1). Display/hide its location on the map
| This city: | 2.5 people |
| Texas: | 2.8 people |
| This city: | 68.7% |
| Whole state: | 69.9% |
| This city: | 4.0% |
| Whole state: | 6.0% |
Likely homosexual households (counted as self-reported same-sex unmarried-partner households)
- Lesbian couples: 0.1% of all households
- Gay men: 0.4% of all households
Banks with branches in Sour Lake (2011 data):
- Compass Bank: Sour Lake Branch at 620 Highway 105 West, branch established on 1992/07/20. Info updated 2011/02/24: Bank assets: $63,107.0 mil, Deposits: $46,232.4 mil, headquarters in Birmingham, AL, negative income in the last year, Commercial Lending Specialization, 720 total offices, Holding Company: Banco Bilbao Vizcaya Argentaria, S.A.
- Citizens Bank: Sour Lake Branch at 125 Highway 326 S, branch established on 1992/10/30. Info updated 2006/11/03: Bank assets: $338.0 mil, Deposits: $305.1 mil, headquarters in Kilgore, TX, positive income, Commercial Lending Specialization, 10 total offices, Holding Company: East Texas Financial Corporation
For population 15 years and over in Sour Lake:

- Never married: 23.8%
- Now married: 48.1%
- Separated: 2.3%
- Widowed: 6.4%
- Divorced: 19.4%
For population 25 years and over in Sour Lake:
- High school or higher: 89.2%
- Bachelor's degree or higher: 19.2%
- Graduate or professional degree: 3.8%
- Unemployed: 5.1%
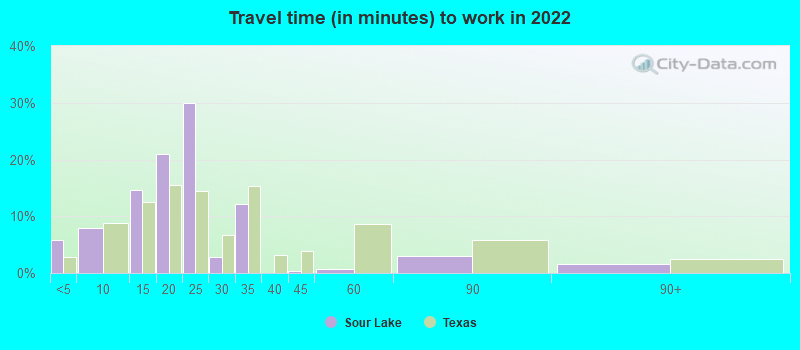
- Mean travel time to work (commute): 23.9 minutes


| Here: | 10.7 |
| Texas average: | 14.0 |
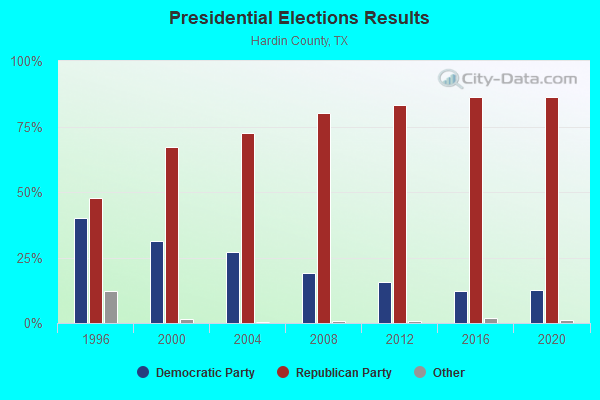
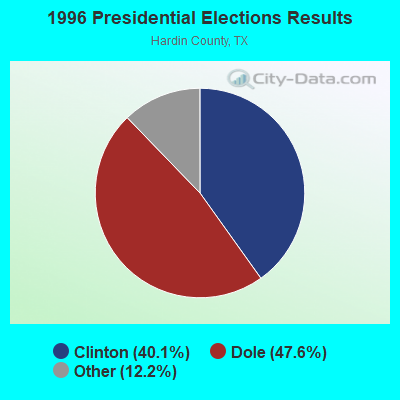

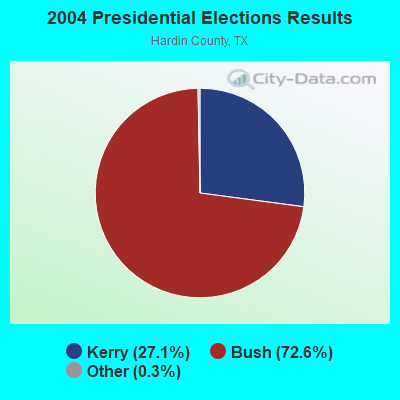
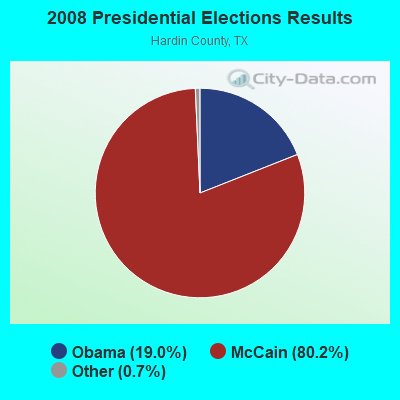
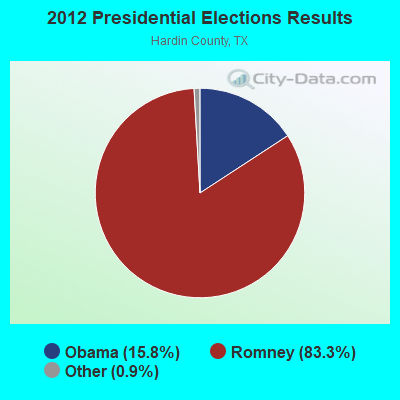

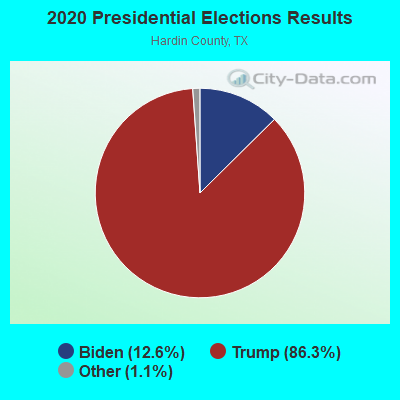
Graphs represent county-level data. Detailed 2008 Election Results
Religion statistics for Sour Lake, TX (based on Hardin County data)
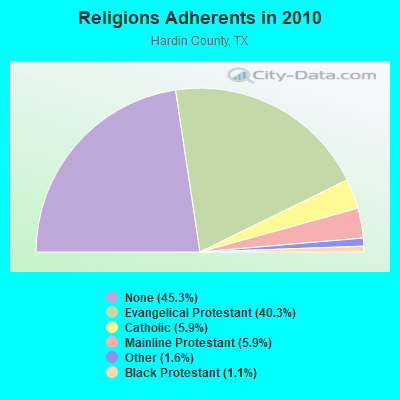
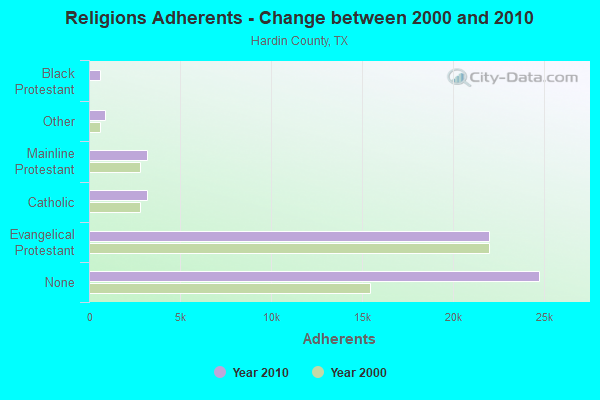
| Religion | Adherents | Congregations |
|---|---|---|
| Evangelical Protestant | 21,993 | 78 |
| Catholic | 3,214 | 4 |
| Mainline Protestant | 3,211 | 8 |
| Other | 852 | 4 |
| Black Protestant | 612 | 5 |
| None | 24,753 | - |
Food Environment Statistics:
| This county: | 2.13 / 10,000 pop. |
| State: | 1.47 / 10,000 pop. |
| Hardin County: | 0.58 / 10,000 pop. |
| Texas: | 1.11 / 10,000 pop. |
| This county: | 5.63 / 10,000 pop. |
| Texas: | 3.95 / 10,000 pop. |
| This county: | 3.30 / 10,000 pop. |
| State: | 6.13 / 10,000 pop. |
| This county: | 10.6% |
| Texas: | 8.9% |
| This county: | 27.9% |
| State: | 26.6% |
| This county: | 13.8% |
| Texas: | 15.7% |
Health and Nutrition:
| This city: | 51.3% |
| State: | 48.6% |
| This city: | 48.3% |
| State: | 47.4% |
| Sour Lake: | 28.9 |
| State: | 28.5 |
| Sour Lake: | 21.3% |
| Texas: | 20.6% |
| Sour Lake: | 11.7% |
| State: | 10.3% |
| This city: | 6.9 |
| Texas: | 6.8 |
| Here: | 34.6% |
| Texas: | 33.1% |
| This city: | 57.5% |
| State: | 56.2% |
| Here: | 77.6% |
| Texas: | 80.7% |
More about Health and Nutrition of Sour Lake, TX Residents
| Local government employment and payroll (March 2022) | |||||
| Function | Full-time employees | Monthly full-time payroll | Average yearly full-time wage | Part-time employees | Monthly part-time payroll |
|---|---|---|---|---|---|
| Police Protection - Officers | 7 | $32,338 | $55,437 | 1 | $3,294 |
| Streets and Highways | 3 | $10,928 | $43,712 | 1 | $2,308 |
| Financial Administration | 2 | $7,813 | $46,878 | 0 | $0 |
| Police - Other | 1 | $5,357 | $64,284 | 0 | $0 |
| Local Libraries | 1 | $1,949 | $23,388 | 2 | $1,667 |
| Other Government Administration | 1 | $5,968 | $71,616 | 0 | $0 |
| Judicial and Legal | 0 | $0 | 1 | $1,537 | |
| Totals for Government | 15 | $64,353 | $51,482 | 5 | $8,806 |
Sour Lake government finances - Expenditure in 2017 (per resident):
- Construction - Sewerage: $401,000 ($220.21)
General - Other: $13,000 ($7.14)
Water Utilities: $6,000 ($3.29)
- Current Operations - Water Utilities: $499,000 ($274.03)
Police Protection: $498,000 ($273.48)
Sewerage: $296,000 ($162.55)
General - Other: $242,000 ($132.89)
Central Staff Services: $237,000 ($130.15)
Solid Waste Management: $185,000 ($101.59)
Libraries: $93,000 ($51.07)
Financial Administration: $22,000 ($12.08)
Parks and Recreation: $16,000 ($8.79)
Judicial and Legal Services: $11,000 ($6.04)
- Other Capital Outlay - Central Staff Services: $101,000 ($55.46)
Police Protection: $27,000 ($14.83)
Water Utilities: $27,000 ($14.83)
- Total Salaries and Wages: $621,000 ($341.02)
- Water Utilities - Interest on Debt: $14,000 ($7.69)
Sour Lake government finances - Revenue in 2017 (per resident):
- Charges - Sewerage: $220,000 ($120.81)
Solid Waste Management: $197,000 ($108.18)
Other: $11,000 ($6.04)
- Miscellaneous - General Revenue - Other: $169,000 ($92.81)
Fines and Forfeits: $73,000 ($40.09)
Interest Earnings: $11,000 ($6.04)
Donations From Private Sources: $11,000 ($6.04)
- Revenue - Water Utilities: $371,000 ($203.73)
- Tax - General Sales and Gross Receipts: $826,000 ($453.60)
Property: $378,000 ($207.58)
Other: $82,000 ($45.03)
Sour Lake government finances - Debt in 2017 (per resident):
- Long Term Debt - Beginning Outstanding - Unspecified Public Purpose: $345,000 ($189.46)
Outstanding Unspecified Public Purpose: $260,000 ($142.78)
Retired Unspecified Public Purpose: $85,000 ($46.68)
Sour Lake government finances - Cash and Securities in 2017 (per resident):
- Other Funds - Cash and Securities: $3,666,000 ($2013.18)
Businesses in Sour Lake, TX
- Chevrolet: 1
Strongest AM radio stations in Sour Lake:
- KTRH (740 AM; 50 kW; HOUSTON, TX; Owner: AMFM TEXAS LICENSES LIMITED PARTNERSHIP)
- KGOL (1180 AM; 50 kW; HUMBLE, TX; Owner: ENTRAVISION HOLDINGS, LLC)
- KLVI (560 AM; 5 kW; BEAUMONT, TX; Owner: CAPSTAR TX LIMITED PARTNERSHIP)
- KQHN (1510 AM; daytime; 5 kW; NEDERLAND, TX; Owner: CUMULUS LICENSING CORP.)
- KILE (1560 AM; 50 kW; BELLAIRE, TX; Owner: THE RAFTT CORPORATION)
- KSEV (700 AM; 15 kW; TOMBALL, TX; Owner: LIBERMAN BROADCASTING OF HOUSTON LICENSE CORP.)
- KZZB (990 AM; 1 kW; BEAUMONT, TX; Owner: MARTIN BROADCASTING, INC.)
- KDEI (1250 AM; 5 kW; PORT ARTHUR, TX; Owner: RADIO MARIA, INC.)
- KLAT (1010 AM; 10 kW; HOUSTON, TX; Owner: TICHENOR LICENSE CORPORATION ("TLC"))
- KJOJ (880 AM; 10 kW; CONROE, TX; Owner: LIBERMAN BROADCASTING OF HOUSTON LICENSE CORP.)
- KRCM (1380 AM; 1 kW; BEAUMONT, TX; Owner: VOICE BROADCASTING, INC.)
- KKHT (1070 AM; 10 kW; HOUSTON, TX; Owner: SOUTH TEXAS BROADCASTING, INC.)
- KIKR (1450 AM; 1 kW; BEAUMONT, TX; Owner: CUMULUS LICENSING CORP.)
Strongest FM radio stations in Sour Lake:
- KQBU-FM (93.3 FM; PORT ARTHUR, TX; Owner: TICHENOR LICENSE CORPORATION ("TLC"))
- KQQK (107.9 FM; BEAUMONT, TX; Owner: LIBERMAN BROADCASTING OF HOUSTON LICENSE CORP.)
- KTJM (98.5 FM; PORT ARTHUR, TX; Owner: LIBERMAN BROADCASTING OF HOUSTON LICENSE CORP.)
- KSHN (99.9 FM; LIBERTY, TX; Owner: TRINITY RIVER VALLEY BROADCASTING CO)
- KOBT (100.7 FM; WINNIE, TX; Owner: TICHENOR LICENSE CORPORATION ("TLC"))
- KRWP (97.5 FM; BEAUMONT, TX; Owner: CUMULUS LICENSING CORP.)
- KIOC (106.1 FM; ORANGE, TX; Owner: CAPSTAR TX LIMITED PARTNERSHIP)
- KTCX (102.5 FM; BEAUMONT, TX; Owner: CUMULUS LICENSING CORP.)
- KYKR (95.1 FM; BEAUMONT, TX; Owner: CAPSTAR TX LIMITED PARTNERSHIP)
- KQXY-FM (94.1 FM; BEAUMONT, TX; Owner: CUMULUS LICENSING CORP.)
- KVST (103.7 FM; WILLIS, TX; Owner: NEW WAVO COMMUNICATION GROUP, INC.)
- KTHT (97.1 FM; CLEVELAND, TX; Owner: CXR HOLDINGS, INC.)
- KAYD-FM (101.7 FM; SILSBEE, TX; Owner: HILCO COMMUNICATIONS, INC.)
- KHPT (106.9 FM; CONROE, TX; Owner: CXR HOLDINGS, INC.)
- KKMY (104.5 FM; ORANGE, TX; Owner: CAPSTAR TX LIMITED PARTNERSHIP)
- KVLU (91.3 FM; BEAUMONT, TX; Owner: LAMAR UNIVERSITY)
- K277AG (103.3 FM; BEAUMONT, TX; Owner: CAPSTAR TX LIMITED PARTNERSHIP)
TV broadcast stations around Sour Lake:
- K09VO (Channel 9; BEAUMONT, TX; Owner: BEAUMONT BROADCASTING CORPORATION)
- KBMT (Channel 12; BEAUMONT, TX; Owner: CHANNEL 12 OF BEAUMONT, INC.)
- KBTV-TV (Channel 4; PORT ARTHUR, TX; Owner: NEXSTAR BROADCASTING OF BEAUMONT/PORT ARTHUR, L.L.C.)
- KFDM-TV (Channel 6; BEAUMONT, TX; Owner: FREEDOM BROADCASTING OF TEXAS, INC.)
- KITU (Channel 34; BEAUMONT, TX; Owner: COMMUNITY EDUCATIONAL TELEVISION INC)
- KEBQ-LP (Channel 22; BEAUMONT-ORANGE, TX; Owner: WELLSPRINGS BEAUMONT TELEVISION, INC.)
- KJDF-LP (Channel 46; BEAUMONT, TX; Owner: ARACELIS ORTIZ, EXECUTRIX OF THE ESTATE OF CARLOS ORTIZ)
- KVHP (Channel 29; LAKE CHARLES, LA; Owner: NATIONAL COMMUNICATIONS, INC.)
- KUIL-LP (Channel 64; BEAUMONT, TX; Owner: BLUE BONNET COMMUNICATIONS, INC.)
Sour Lake fatal accident list:
Aug 1, 2019 11:40 AM, Sr-105, Lat: 30.139619, Lon: -94.394469, Vehicles: 2, Persons: 3, Fatalities: 1, Drunk persons involved: 1
Nov 19, 2011 08:50 PM, Old Beaumont Rd, Lat: 30.131736, Lon: -94.400461, Vehicles: 1, Persons: 1, Fatalities: 1, Drunk persons involved: 1
Jul 21, 2006 04:30 PM, Moye, Lat: 30.142380, Lon: -94.410240, Vehicles: 1, Persons: 3, Fatalities: 1
- National Bridge Inventory (NBI) Statistics
- 10Number of bridges
- 230ft / 70.0mTotal length
- $29,000Total costs
- 37,895Total average daily traffic
- 2,759Total average daily truck traffic
- 57,200Total future (year 2031) average daily traffic

- New bridges - historical statistics
- 11930-1939
- 41950-1959
- 31980-1989
- 22000-2009
FCC Registered Cell Phone Towers:
2 (See the full list of FCC Registered Cell Phone Towers in Sour Lake)FCC Registered Antenna Towers:
139 (See the full list of FCC Registered Antenna Towers)FCC Registered Broadcast Land Mobile Towers:
12 (See the full list of FCC Registered Broadcast Land Mobile Towers in Sour Lake, TX)FCC Registered Microwave Towers:
22 (See the full list of FCC Registered Microwave Towers in this town)FCC Registered Amateur Radio Licenses:
41 (See the full list of FCC Registered Amateur Radio Licenses in Sour Lake)FAA Registered Aircraft:
4- Aircraft: CESSNA 182P (Category: Land, Seats: 4, Weight: Up to 12,499 Pounds, Speed: 120 mph), Engine: CONT MOTOR O-470 SERIES (230 HP) (Reciprocating)
N-Number: 1596M, N1596M, N-1596M, Serial Number: 18264386, Year manufactured: 1975, Airworthiness Date: 11/24/1975, Certificate Issue Date: 09/14/2020
Registrant (Individual): Geoffrey W Kret, 463 W Pineshadows Dr, Sour Lake, TX 77659 - Aircraft: BEECH 77 (Category: Land, Seats: 2, Weight: Up to 12,499 Pounds), Engine: LYCOMING 0-235 SERIES (115 HP) (Reciprocating)
N-Number: 3809Y, N3809Y, N-3809Y, Serial Number: WA-212, Year manufactured: 1980, Airworthiness Date: 12/05/1980, Certificate Issue Date: 03/31/2014
Registrant (Co-Owned): Kent R Shaffer, 600 Morris Rd W, Sour Lake, TX 77659, Other Owners: Rhonda J Shaffer - Aircraft: CESSNA 150M (Category: Land, Seats: 2, Weight: Up to 12,499 Pounds, Speed: 81 mph), Engine: CONT MOTOR 0-200 SERIES (100 HP) (4 Cycle)
N-Number: 63543, N63543, N-63543, Serial Number: 15077382, Year manufactured: 1975, Airworthiness Date: 10/07/1975, Certificate Issue Date: 12/15/2011
Registrant (Individual): Jeffrey L Turner, 1302 Countrywood Cir, Sour Lake, TX 77659 - Aircraft: FARTHING HAROLD NOSTALGAIR N3 PUP-M (Category: Land, Weight: Up to 12,499 Pounds), Engine: BOMBARDIER ROTAX (ALL) (Reciprocating)
N-Number: 85HF, N85HF, N-85HF, Serial Number: HB2, Year manufactured: 1986, Airworthiness Date: 06/16/1998
Registrant (Individual): Reported Sale, 16198 G W Jones Sr Rd, Sour Lake, TX 77659
| Home Mortgage Disclosure Act Aggregated Statistics For Year 2009 (Based on 1 partial tract) | ||
| C) Refinancings | ||
|---|---|---|
| Number | Average Value | |
| LOANS ORIGINATED | 1 | $96,390 |
| APPLICATIONS APPROVED, NOT ACCEPTED | 0 | $0 |
| APPLICATIONS DENIED | 0 | $0 |
| APPLICATIONS WITHDRAWN | 0 | $0 |
| FILES CLOSED FOR INCOMPLETENESS | 0 | $0 |
Detailed HMDA statistics for the following Tracts: 0302.00


2002 - 2018 National Fire Incident Reporting System (NFIRS) incidents
- Fire incident types reported to NFIRS in Sour Lake, TX
- 20055.6%Outside Fires
- 10128.1%Structure Fires
- 4512.5%Mobile Property/Vehicle Fires
- 143.9%Other
 According to the data from the years 2002 - 2018 the average number of fires per year is 21. The highest number of reported fires - 47 took place in 2011, and the least - 1 in 2017. The data has a growing trend.
 When looking into fire subcategories, the most reports belonged to: Outside Fires (55.6%), and Structure Fires (28.1%).

Sour Lake compared to Texas state average:
- Median house value below state average.
- Unemployed percentage significantly below state average.
- Black race population percentage significantly below state average.
- Hispanic race population percentage significantly below state average.
- Median age above state average.
- Foreign-born population percentage significantly below state average.
- House age above state average.
- Number of college students below state average.

|
Total of 3 patent applications in 2008-2024.