St. Helens, Oregon Submit your own pictures of this city and show them to the world
OSM Map
General Map
Google Map
MSN Map
OSM Map
General Map
Google Map
MSN Map
OSM Map
General Map
Google Map
MSN Map
OSM Map
General Map
Google Map
MSN Map
Please wait while loading the map...
Population in 2022: 14,369 (100% urban, 0% rural). Population change since 2000: +43.4%Males: 7,452 Females: 6,917
March 2022 cost of living index in St. Helens: 101.6 (near average, U.S. average is 100) Percentage of residents living in poverty in 2022: 10.1%for White Non-Hispanic residents , 0.8% for Hispanic or Latino residents , 19.9% for other race residents , 3.7% for two or more races residents )
Profiles of local businesses
Business Search - 14 Million verified businesses
Data:
Median household income ($)
Median household income (% change since 2000)
Household income diversity
Ratio of average income to average house value (%)
Ratio of average income to average rent
Median household income ($) - White
Median household income ($) - Black or African American
Median household income ($) - Asian
Median household income ($) - Hispanic or Latino
Median household income ($) - American Indian and Alaska Native
Median household income ($) - Multirace
Median household income ($) - Other Race
Median household income for houses/condos with a mortgage ($)
Median household income for apartments without a mortgage ($)
Races - White alone (%)
Races - White alone (% change since 2000)
Races - Black alone (%)
Races - Black alone (% change since 2000)
Races - American Indian alone (%)
Races - American Indian alone (% change since 2000)
Races - Asian alone (%)
Races - Asian alone (% change since 2000)
Races - Hispanic (%)
Races - Hispanic (% change since 2000)
Races - Native Hawaiian and Other Pacific Islander alone (%)
Races - Native Hawaiian and Other Pacific Islander alone (% change since 2000)
Races - Two or more races (%)
Races - Two or more races (% change since 2000)
Races - Other race alone (%)
Races - Other race alone (% change since 2000)
Racial diversity
Unemployment (%)
Unemployment (% change since 2000)
Unemployment (%) - White
Unemployment (%) - Black or African American
Unemployment (%) - Asian
Unemployment (%) - Hispanic or Latino
Unemployment (%) - American Indian and Alaska Native
Unemployment (%) - Multirace
Unemployment (%) - Other Race
Population density (people per square mile)
Population - Males (%)
Population - Females (%)
Population - Males (%) - White
Population - Males (%) - Black or African American
Population - Males (%) - Asian
Population - Males (%) - Hispanic or Latino
Population - Males (%) - American Indian and Alaska Native
Population - Males (%) - Multirace
Population - Males (%) - Other Race
Population - Females (%) - White
Population - Females (%) - Black or African American
Population - Females (%) - Asian
Population - Females (%) - Hispanic or Latino
Population - Females (%) - American Indian and Alaska Native
Population - Females (%) - Multirace
Population - Females (%) - Other Race
Coronavirus confirmed cases (Apr 25, 2024)
Deaths caused by coronavirus (Apr 25, 2024)
Coronavirus confirmed cases (per 100k population) (Apr 25, 2024)
Deaths caused by coronavirus (per 100k population) (Apr 25, 2024)
Daily increase in number of cases (Apr 25, 2024)
Weekly increase in number of cases (Apr 25, 2024)
Cases doubled (in days) (Apr 25, 2024)
Hospitalized patients (Apr 18, 2022)
Negative test results (Apr 18, 2022)
Total test results (Apr 18, 2022)
COVID Vaccine doses distributed (per 100k population) (Sep 19, 2023)
COVID Vaccine doses administered (per 100k population) (Sep 19, 2023)
COVID Vaccine doses distributed (Sep 19, 2023)
COVID Vaccine doses administered (Sep 19, 2023)
Likely homosexual households (%)
Likely homosexual households (% change since 2000)
Likely homosexual households - Lesbian couples (%)
Likely homosexual households - Lesbian couples (% change since 2000)
Likely homosexual households - Gay men (%)
Likely homosexual households - Gay men (% change since 2000)
Cost of living index
Median gross rent ($)
Median contract rent ($)
Median monthly housing costs ($)
Median house or condo value ($)
Median house or condo value ($ change since 2000)
Mean house or condo value by units in structure - 1, detached ($)
Mean house or condo value by units in structure - 1, attached ($)
Mean house or condo value by units in structure - 2 ($)
Mean house or condo value by units in structure by units in structure - 3 or 4 ($)
Mean house or condo value by units in structure - 5 or more ($)
Mean house or condo value by units in structure - Boat, RV, van, etc. ($)
Mean house or condo value by units in structure - Mobile home ($)
Median house or condo value ($) - White
Median house or condo value ($) - Black or African American
Median house or condo value ($) - Asian
Median house or condo value ($) - Hispanic or Latino
Median house or condo value ($) - American Indian and Alaska Native
Median house or condo value ($) - Multirace
Median house or condo value ($) - Other Race
Median resident age
Resident age diversity
Median resident age - Males
Median resident age - Females
Median resident age - White
Median resident age - Black or African American
Median resident age - Asian
Median resident age - Hispanic or Latino
Median resident age - American Indian and Alaska Native
Median resident age - Multirace
Median resident age - Other Race
Median resident age - Males - White
Median resident age - Males - Black or African American
Median resident age - Males - Asian
Median resident age - Males - Hispanic or Latino
Median resident age - Males - American Indian and Alaska Native
Median resident age - Males - Multirace
Median resident age - Males - Other Race
Median resident age - Females - White
Median resident age - Females - Black or African American
Median resident age - Females - Asian
Median resident age - Females - Hispanic or Latino
Median resident age - Females - American Indian and Alaska Native
Median resident age - Females - Multirace
Median resident age - Females - Other Race
Commute - mean travel time to work (minutes)
Travel time to work - Less than 5 minutes (%)
Travel time to work - Less than 5 minutes (% change since 2000)
Travel time to work - 5 to 9 minutes (%)
Travel time to work - 5 to 9 minutes (% change since 2000)
Travel time to work - 10 to 19 minutes (%)
Travel time to work - 10 to 19 minutes (% change since 2000)
Travel time to work - 20 to 29 minutes (%)
Travel time to work - 20 to 29 minutes (% change since 2000)
Travel time to work - 30 to 39 minutes (%)
Travel time to work - 30 to 39 minutes (% change since 2000)
Travel time to work - 40 to 59 minutes (%)
Travel time to work - 40 to 59 minutes (% change since 2000)
Travel time to work - 60 to 89 minutes (%)
Travel time to work - 60 to 89 minutes (% change since 2000)
Travel time to work - 90 or more minutes (%)
Travel time to work - 90 or more minutes (% change since 2000)
Marital status - Never married (%)
Marital status - Now married (%)
Marital status - Separated (%)
Marital status - Widowed (%)
Marital status - Divorced (%)
Median family income ($)
Median family income (% change since 2000)
Median non-family income ($)
Median non-family income (% change since 2000)
Median per capita income ($)
Median per capita income (% change since 2000)
Median family income ($) - White
Median family income ($) - Black or African American
Median family income ($) - Asian
Median family income ($) - Hispanic or Latino
Median family income ($) - American Indian and Alaska Native
Median family income ($) - Multirace
Median family income ($) - Other Race
Median year house/condo built
Median year apartment built
Year house built - Built 2005 or later (%)
Year house built - Built 2000 to 2004 (%)
Year house built - Built 1990 to 1999 (%)
Year house built - Built 1980 to 1989 (%)
Year house built - Built 1970 to 1979 (%)
Year house built - Built 1960 to 1969 (%)
Year house built - Built 1950 to 1959 (%)
Year house built - Built 1940 to 1949 (%)
Year house built - Built 1939 or earlier (%)
Average household size
Household density (households per square mile)
Average household size - White
Average household size - Black or African American
Average household size - Asian
Average household size - Hispanic or Latino
Average household size - American Indian and Alaska Native
Average household size - Multirace
Average household size - Other Race
Occupied housing units (%)
Vacant housing units (%)
Owner occupied housing units (%)
Renter occupied housing units (%)
Vacancy status - For rent (%)
Vacancy status - For sale only (%)
Vacancy status - Rented or sold, not occupied (%)
Vacancy status - For seasonal, recreational, or occasional use (%)
Vacancy status - For migrant workers (%)
Vacancy status - Other vacant (%)
Residents with income below the poverty level (%)
Residents with income below 50% of the poverty level (%)
Children below poverty level (%)
Poor families by family type - Married-couple family (%)
Poor families by family type - Male, no wife present (%)
Poor families by family type - Female, no husband present (%)
Poverty status for native-born residents (%)
Poverty status for foreign-born residents (%)
Poverty among high school graduates not in families (%)
Poverty among people who did not graduate high school not in families (%)
Residents with income below the poverty level (%) - White
Residents with income below the poverty level (%) - Black or African American
Residents with income below the poverty level (%) - Asian
Residents with income below the poverty level (%) - Hispanic or Latino
Residents with income below the poverty level (%) - American Indian and Alaska Native
Residents with income below the poverty level (%) - Multirace
Residents with income below the poverty level (%) - Other Race
Air pollution - Air Quality Index (AQI)
Air pollution - CO
Air pollution - NO2
Air pollution - SO2
Air pollution - Ozone
Air pollution - PM10
Air pollution - PM25
Air pollution - Pb
Crime - Murders per 100,000 population
Crime - Rapes per 100,000 population
Crime - Robberies per 100,000 population
Crime - Assaults per 100,000 population
Crime - Burglaries per 100,000 population
Crime - Thefts per 100,000 population
Crime - Auto thefts per 100,000 population
Crime - Arson per 100,000 population
Crime - City-data.com crime index
Crime - Violent crime index
Crime - Property crime index
Crime - Murders per 100,000 population (5 year average)
Crime - Rapes per 100,000 population (5 year average)
Crime - Robberies per 100,000 population (5 year average)
Crime - Assaults per 100,000 population (5 year average)
Crime - Burglaries per 100,000 population (5 year average)
Crime - Thefts per 100,000 population (5 year average)
Crime - Auto thefts per 100,000 population (5 year average)
Crime - Arson per 100,000 population (5 year average)
Crime - City-data.com crime index (5 year average)
Crime - Violent crime index (5 year average)
Crime - Property crime index (5 year average)
1996 Presidential Elections Results (%) - Democratic Party (Clinton)
1996 Presidential Elections Results (%) - Republican Party (Dole)
1996 Presidential Elections Results (%) - Other
2000 Presidential Elections Results (%) - Democratic Party (Gore)
2000 Presidential Elections Results (%) - Republican Party (Bush)
2000 Presidential Elections Results (%) - Other
2004 Presidential Elections Results (%) - Democratic Party (Kerry)
2004 Presidential Elections Results (%) - Republican Party (Bush)
2004 Presidential Elections Results (%) - Other
2008 Presidential Elections Results (%) - Democratic Party (Obama)
2008 Presidential Elections Results (%) - Republican Party (McCain)
2008 Presidential Elections Results (%) - Other
2012 Presidential Elections Results (%) - Democratic Party (Obama)
2012 Presidential Elections Results (%) - Republican Party (Romney)
2012 Presidential Elections Results (%) - Other
2016 Presidential Elections Results (%) - Democratic Party (Clinton)
2016 Presidential Elections Results (%) - Republican Party (Trump)
2016 Presidential Elections Results (%) - Other
2020 Presidential Elections Results (%) - Democratic Party (Biden)
2020 Presidential Elections Results (%) - Republican Party (Trump)
2020 Presidential Elections Results (%) - Other
Ancestries Reported - Arab (%)
Ancestries Reported - Czech (%)
Ancestries Reported - Danish (%)
Ancestries Reported - Dutch (%)
Ancestries Reported - English (%)
Ancestries Reported - French (%)
Ancestries Reported - French Canadian (%)
Ancestries Reported - German (%)
Ancestries Reported - Greek (%)
Ancestries Reported - Hungarian (%)
Ancestries Reported - Irish (%)
Ancestries Reported - Italian (%)
Ancestries Reported - Lithuanian (%)
Ancestries Reported - Norwegian (%)
Ancestries Reported - Polish (%)
Ancestries Reported - Portuguese (%)
Ancestries Reported - Russian (%)
Ancestries Reported - Scotch-Irish (%)
Ancestries Reported - Scottish (%)
Ancestries Reported - Slovak (%)
Ancestries Reported - Subsaharan African (%)
Ancestries Reported - Swedish (%)
Ancestries Reported - Swiss (%)
Ancestries Reported - Ukrainian (%)
Ancestries Reported - United States (%)
Ancestries Reported - Welsh (%)
Ancestries Reported - West Indian (%)
Ancestries Reported - Other (%)
Educational Attainment - No schooling completed (%)
Educational Attainment - Less than high school (%)
Educational Attainment - High school or equivalent (%)
Educational Attainment - Less than 1 year of college (%)
Educational Attainment - 1 or more years of college (%)
Educational Attainment - Associate degree (%)
Educational Attainment - Bachelor's degree (%)
Educational Attainment - Master's degree (%)
Educational Attainment - Professional school degree (%)
Educational Attainment - Doctorate degree (%)
School Enrollment - Nursery, preschool (%)
School Enrollment - Kindergarten (%)
School Enrollment - Grade 1 to 4 (%)
School Enrollment - Grade 5 to 8 (%)
School Enrollment - Grade 9 to 12 (%)
School Enrollment - College undergrad (%)
School Enrollment - Graduate or professional (%)
School Enrollment - Not enrolled in school (%)
School enrollment - Public schools (%)
School enrollment - Private schools (%)
School enrollment - Not enrolled (%)
Median number of rooms in houses and condos
Median number of rooms in apartments
Housing units lacking complete plumbing facilities (%)
Housing units lacking complete kitchen facilities (%)
Density of houses
Urban houses (%)
Rural houses (%)
Households with people 60 years and over (%)
Households with people 65 years and over (%)
Households with people 75 years and over (%)
Households with one or more nonrelatives (%)
Households with no nonrelatives (%)
Population in households (%)
Family households (%)
Nonfamily households (%)
Population in families (%)
Family households with own children (%)
Median number of bedrooms in owner occupied houses
Mean number of bedrooms in owner occupied houses
Median number of bedrooms in renter occupied houses
Mean number of bedrooms in renter occupied houses
Median number of vehichles in owner occupied houses
Mean number of vehichles in owner occupied houses
Median number of vehichles in renter occupied houses
Mean number of vehichles in renter occupied houses
Mortgage status - with mortgage (%)
Mortgage status - with second mortgage (%)
Mortgage status - with home equity loan (%)
Mortgage status - with both second mortgage and home equity loan (%)
Mortgage status - without a mortgage (%)
Average family size
Average family size - White
Average family size - Black or African American
Average family size - Asian
Average family size - Hispanic or Latino
Average family size - American Indian and Alaska Native
Average family size - Multirace
Average family size - Other Race
Geographical mobility - Same house 1 year ago (%)
Geographical mobility - Moved within same county (%)
Geographical mobility - Moved from different county within same state (%)
Geographical mobility - Moved from different state (%)
Geographical mobility - Moved from abroad (%)
Place of birth - Born in state of residence (%)
Place of birth - Born in other state (%)
Place of birth - Native, outside of US (%)
Place of birth - Foreign born (%)
Housing units in structures - 1, detached (%)
Housing units in structures - 1, attached (%)
Housing units in structures - 2 (%)
Housing units in structures - 3 or 4 (%)
Housing units in structures - 5 to 9 (%)
Housing units in structures - 10 to 19 (%)
Housing units in structures - 20 to 49 (%)
Housing units in structures - 50 or more (%)
Housing units in structures - Mobile home (%)
Housing units in structures - Boat, RV, van, etc. (%)
House/condo owner moved in on average (years ago)
Renter moved in on average (years ago)
Year householder moved into unit - Moved in 1999 to March 2000 (%)
Year householder moved into unit - Moved in 1995 to 1998 (%)
Year householder moved into unit - Moved in 1990 to 1994 (%)
Year householder moved into unit - Moved in 1980 to 1989 (%)
Year householder moved into unit - Moved in 1970 to 1979 (%)
Year householder moved into unit - Moved in 1969 or earlier (%)
Means of transportation to work - Drove car alone (%)
Means of transportation to work - Carpooled (%)
Means of transportation to work - Public transportation (%)
Means of transportation to work - Bus or trolley bus (%)
Means of transportation to work - Streetcar or trolley car (%)
Means of transportation to work - Subway or elevated (%)
Means of transportation to work - Railroad (%)
Means of transportation to work - Ferryboat (%)
Means of transportation to work - Taxicab (%)
Means of transportation to work - Motorcycle (%)
Means of transportation to work - Bicycle (%)
Means of transportation to work - Walked (%)
Means of transportation to work - Other means (%)
Working at home (%)
Industry diversity
Most Common Industries - Agriculture, forestry, fishing and hunting, and mining (%)
Most Common Industries - Agriculture, forestry, fishing and hunting (%)
Most Common Industries - Mining, quarrying, and oil and gas extraction (%)
Most Common Industries - Construction (%)
Most Common Industries - Manufacturing (%)
Most Common Industries - Wholesale trade (%)
Most Common Industries - Retail trade (%)
Most Common Industries - Transportation and warehousing, and utilities (%)
Most Common Industries - Transportation and warehousing (%)
Most Common Industries - Utilities (%)
Most Common Industries - Information (%)
Most Common Industries - Finance and insurance, and real estate and rental and leasing (%)
Most Common Industries - Finance and insurance (%)
Most Common Industries - Real estate and rental and leasing (%)
Most Common Industries - Professional, scientific, and management, and administrative and waste management services (%)
Most Common Industries - Professional, scientific, and technical services (%)
Most Common Industries - Management of companies and enterprises (%)
Most Common Industries - Administrative and support and waste management services (%)
Most Common Industries - Educational services, and health care and social assistance (%)
Most Common Industries - Educational services (%)
Most Common Industries - Health care and social assistance (%)
Most Common Industries - Arts, entertainment, and recreation, and accommodation and food services (%)
Most Common Industries - Arts, entertainment, and recreation (%)
Most Common Industries - Accommodation and food services (%)
Most Common Industries - Other services, except public administration (%)
Most Common Industries - Public administration (%)
Occupation diversity
Most Common Occupations - Management, business, science, and arts occupations (%)
Most Common Occupations - Management, business, and financial occupations (%)
Most Common Occupations - Management occupations (%)
Most Common Occupations - Business and financial operations occupations (%)
Most Common Occupations - Computer, engineering, and science occupations (%)
Most Common Occupations - Computer and mathematical occupations (%)
Most Common Occupations - Architecture and engineering occupations (%)
Most Common Occupations - Life, physical, and social science occupations (%)
Most Common Occupations - Education, legal, community service, arts, and media occupations (%)
Most Common Occupations - Community and social service occupations (%)
Most Common Occupations - Legal occupations (%)
Most Common Occupations - Education, training, and library occupations (%)
Most Common Occupations - Arts, design, entertainment, sports, and media occupations (%)
Most Common Occupations - Healthcare practitioners and technical occupations (%)
Most Common Occupations - Health diagnosing and treating practitioners and other technical occupations (%)
Most Common Occupations - Health technologists and technicians (%)
Most Common Occupations - Service occupations (%)
Most Common Occupations - Healthcare support occupations (%)
Most Common Occupations - Protective service occupations (%)
Most Common Occupations - Fire fighting and prevention, and other protective service workers including supervisors (%)
Most Common Occupations - Law enforcement workers including supervisors (%)
Most Common Occupations - Food preparation and serving related occupations (%)
Most Common Occupations - Building and grounds cleaning and maintenance occupations (%)
Most Common Occupations - Personal care and service occupations (%)
Most Common Occupations - Sales and office occupations (%)
Most Common Occupations - Sales and related occupations (%)
Most Common Occupations - Office and administrative support occupations (%)
Most Common Occupations - Natural resources, construction, and maintenance occupations (%)
Most Common Occupations - Farming, fishing, and forestry occupations (%)
Most Common Occupations - Construction and extraction occupations (%)
Most Common Occupations - Installation, maintenance, and repair occupations (%)
Most Common Occupations - Production, transportation, and material moving occupations (%)
Most Common Occupations - Production occupations (%)
Most Common Occupations - Transportation occupations (%)
Most Common Occupations - Material moving occupations (%)
People in Group quarters - Institutionalized population (%)
People in Group quarters - Correctional institutions (%)
People in Group quarters - Federal prisons and detention centers (%)
People in Group quarters - Halfway houses (%)
People in Group quarters - Local jails and other confinement facilities (including police lockups) (%)
People in Group quarters - Military disciplinary barracks (%)
People in Group quarters - State prisons (%)
People in Group quarters - Other types of correctional institutions (%)
People in Group quarters - Nursing homes (%)
People in Group quarters - Hospitals/wards, hospices, and schools for the handicapped (%)
People in Group quarters - Hospitals/wards and hospices for chronically ill (%)
People in Group quarters - Hospices or homes for chronically ill (%)
People in Group quarters - Military hospitals or wards for chronically ill (%)
People in Group quarters - Other hospitals or wards for chronically ill (%)
People in Group quarters - Hospitals or wards for drug/alcohol abuse (%)
People in Group quarters - Mental (Psychiatric) hospitals or wards (%)
People in Group quarters - Schools, hospitals, or wards for the mentally retarded (%)
People in Group quarters - Schools, hospitals, or wards for the physically handicapped (%)
People in Group quarters - Institutions for the deaf (%)
People in Group quarters - Institutions for the blind (%)
People in Group quarters - Orthopedic wards and institutions for the physically handicapped (%)
People in Group quarters - Wards in general hospitals for patients who have no usual home elsewhere (%)
People in Group quarters - Wards in military hospitals for patients who have no usual home elsewhere (%)
People in Group quarters - Juvenile institutions (%)
People in Group quarters - Long-term care (%)
People in Group quarters - Homes for abused, dependent, and neglected children (%)
People in Group quarters - Residential treatment centers for emotionally disturbed children (%)
People in Group quarters - Training schools for juvenile delinquents (%)
People in Group quarters - Short-term care, detention or diagnostic centers for delinquent children (%)
People in Group quarters - Type of juvenile institution unknown (%)
People in Group quarters - Noninstitutionalized population (%)
People in Group quarters - College dormitories (includes college quarters off campus) (%)
People in Group quarters - Military quarters (%)
People in Group quarters - On base (%)
People in Group quarters - Barracks, unaccompanied personnel housing (UPH), (Enlisted/Officer), ;and similar group living quarters for military personnel (%)
People in Group quarters - Transient quarters for temporary residents (%)
People in Group quarters - Military ships (%)
People in Group quarters - Group homes (%)
People in Group quarters - Homes or halfway houses for drug/alcohol abuse (%)
People in Group quarters - Homes for the mentally ill (%)
People in Group quarters - Homes for the mentally retarded (%)
People in Group quarters - Homes for the physically handicapped (%)
People in Group quarters - Other group homes (%)
People in Group quarters - Religious group quarters (%)
People in Group quarters - Dormitories (%)
People in Group quarters - Agriculture workers' dormitories on farms (%)
People in Group quarters - Job Corps and vocational training facilities (%)
People in Group quarters - Other workers' dormitories (%)
People in Group quarters - Crews of maritime vessels (%)
People in Group quarters - Other nonhousehold living situations (%)
People in Group quarters - Other noninstitutional group quarters (%)
Residents speaking English at home (%)
Residents speaking English at home - Born in the United States (%)
Residents speaking English at home - Native, born elsewhere (%)
Residents speaking English at home - Foreign born (%)
Residents speaking Spanish at home (%)
Residents speaking Spanish at home - Born in the United States (%)
Residents speaking Spanish at home - Native, born elsewhere (%)
Residents speaking Spanish at home - Foreign born (%)
Residents speaking other language at home (%)
Residents speaking other language at home - Born in the United States (%)
Residents speaking other language at home - Native, born elsewhere (%)
Residents speaking other language at home - Foreign born (%)
Class of Workers - Employee of private company (%)
Class of Workers - Self-employed in own incorporated business (%)
Class of Workers - Private not-for-profit wage and salary workers (%)
Class of Workers - Local government workers (%)
Class of Workers - State government workers (%)
Class of Workers - Federal government workers (%)
Class of Workers - Self-employed workers in own not incorporated business and Unpaid family workers (%)
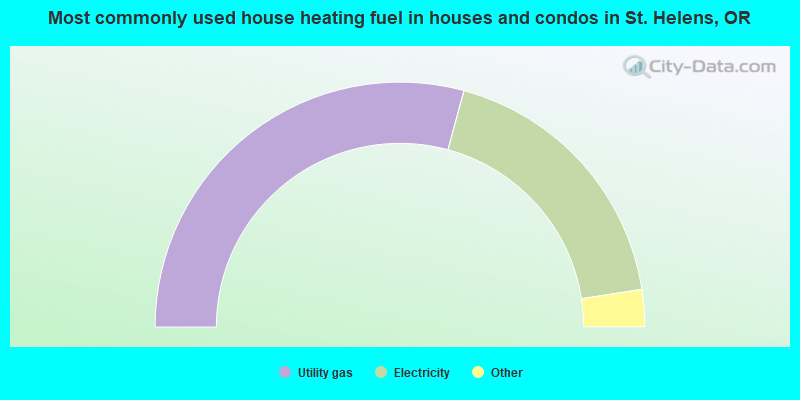
House heating fuel used in houses and condos - Utility gas (%)
House heating fuel used in houses and condos - Bottled, tank, or LP gas (%)
House heating fuel used in houses and condos - Electricity (%)
House heating fuel used in houses and condos - Fuel oil, kerosene, etc. (%)
House heating fuel used in houses and condos - Coal or coke (%)
House heating fuel used in houses and condos - Wood (%)
House heating fuel used in houses and condos - Solar energy (%)
House heating fuel used in houses and condos - Other fuel (%)
House heating fuel used in houses and condos - No fuel used (%)
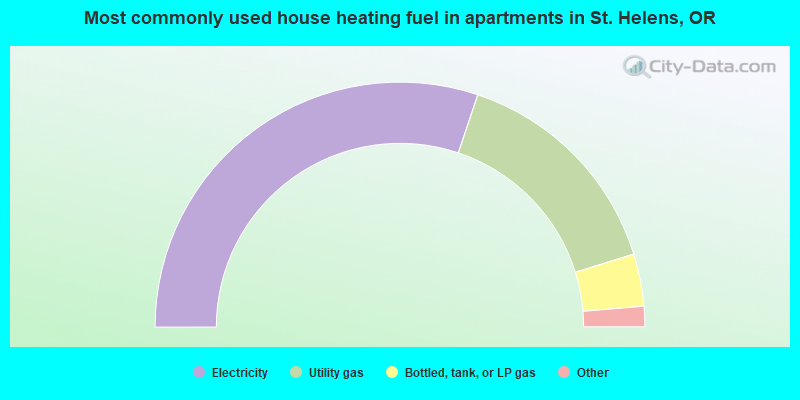
House heating fuel used in apartments - Utility gas (%)
House heating fuel used in apartments - Bottled, tank, or LP gas (%)
House heating fuel used in apartments - Electricity (%)
House heating fuel used in apartments - Fuel oil, kerosene, etc. (%)
House heating fuel used in apartments - Coal or coke (%)
House heating fuel used in apartments - Wood (%)
House heating fuel used in apartments - Solar energy (%)
House heating fuel used in apartments - Other fuel (%)
House heating fuel used in apartments - No fuel used (%)
Armed forces status - In Armed Forces (%)
Armed forces status - Civilian (%)
Armed forces status - Civilian - Veteran (%)
Armed forces status - Civilian - Nonveteran (%)
Fatal accidents locations in years 2005-2021
Fatal accidents locations in 2005
Fatal accidents locations in 2006
Fatal accidents locations in 2007
Fatal accidents locations in 2008
Fatal accidents locations in 2009
Fatal accidents locations in 2010
Fatal accidents locations in 2011
Fatal accidents locations in 2012
Fatal accidents locations in 2013
Fatal accidents locations in 2014
Fatal accidents locations in 2015
Fatal accidents locations in 2016
Fatal accidents locations in 2017
Fatal accidents locations in 2018
Fatal accidents locations in 2019
Fatal accidents locations in 2020
Fatal accidents locations in 2021
Alcohol use - People drinking some alcohol every month (%)
Alcohol use - People not drinking at all (%)
Alcohol use - Average days/month drinking alcohol
Alcohol use - Average drinks/week
Alcohol use - Average days/year people drink much
Audiometry - Average condition of hearing (%)
Audiometry - People that can hear a whisper from across a quiet room (%)
Audiometry - People that can hear normal voice from across a quiet room (%)
Audiometry - Ears ringing, roaring, buzzing (%)
Audiometry - Had a job exposure to loud noise (%)
Audiometry - Had off-work exposure to loud noise (%)
Blood Pressure & Cholesterol - Has high blood pressure (%)
Blood Pressure & Cholesterol - Checking blood pressure at home (%)
Blood Pressure & Cholesterol - Frequently checking blood cholesterol (%)
Blood Pressure & Cholesterol - Has high cholesterol level (%)
Consumer Behavior - Money monthly spent on food at supermarket/grocery store
Consumer Behavior - Money monthly spent on food at other stores
Consumer Behavior - Money monthly spent on eating out
Consumer Behavior - Money monthly spent on carryout/delivered foods
Consumer Behavior - Income spent on food at supermarket/grocery store (%)
Consumer Behavior - Income spent on food at other stores (%)
Consumer Behavior - Income spent on eating out (%)
Consumer Behavior - Income spent on carryout/delivered foods (%)
Current Health Status - General health condition (%)
Current Health Status - Blood donors (%)
Current Health Status - Has blood ever tested for HIV virus (%)
Current Health Status - Left-handed people (%)
Dermatology - People using sunscreen (%)
Diabetes - Diabetics (%)
Diabetes - Had a blood test for high blood sugar (%)
Diabetes - People taking insulin (%)
Diet Behavior & Nutrition - Diet health (%)
Diet Behavior & Nutrition - Milk product consumption (# of products/month)
Diet Behavior & Nutrition - Meals not home prepared (#/week)
Diet Behavior & Nutrition - Meals from fast food or pizza place (#/week)
Diet Behavior & Nutrition - Ready-to-eat foods (#/month)
Diet Behavior & Nutrition - Frozen meals/pizza (#/month)
Drug Use - People that ever used marijuana or hashish (%)
Drug Use - Ever used hard drugs (%)
Drug Use - Ever used any form of cocaine (%)
Drug Use - Ever used heroin (%)
Drug Use - Ever used methamphetamine (%)
Health Insurance - People covered by health insurance (%)
Kidney Conditions-Urology - Avg. # of times urinating at night
Medical Conditions - People with asthma (%)
Medical Conditions - People with anemia (%)
Medical Conditions - People with psoriasis (%)
Medical Conditions - People with overweight (%)
Medical Conditions - Elderly people having difficulties in thinking or remembering (%)
Medical Conditions - People who ever received blood transfusion (%)
Medical Conditions - People having trouble seeing even with glass/contacts (%)
Medical Conditions - People with arthritis (%)
Medical Conditions - People with gout (%)
Medical Conditions - People with congestive heart failure (%)
Medical Conditions - People with coronary heart disease (%)
Medical Conditions - People with angina pectoris (%)
Medical Conditions - People who ever had heart attack (%)
Medical Conditions - People who ever had stroke (%)
Medical Conditions - People with emphysema (%)
Medical Conditions - People with thyroid problem (%)
Medical Conditions - People with chronic bronchitis (%)
Medical Conditions - People with any liver condition (%)
Medical Conditions - People who ever had cancer or malignancy (%)
Mental Health - People who have little interest in doing things (%)
Mental Health - People feeling down, depressed, or hopeless (%)
Mental Health - People who have trouble sleeping or sleeping too much (%)
Mental Health - People feeling tired or having little energy (%)
Mental Health - People with poor appetite or overeating (%)
Mental Health - People feeling bad about themself (%)
Mental Health - People who have trouble concentrating on things (%)
Mental Health - People moving or speaking slowly or too fast (%)
Mental Health - People having thoughts they would be better off dead (%)
Oral Health - Average years since last visit a dentist
Oral Health - People embarrassed because of mouth (%)
Oral Health - People with gum disease (%)
Oral Health - General health of teeth and gums (%)
Oral Health - Average days a week using dental floss/device
Oral Health - Average days a week using mouthwash for dental problem
Oral Health - Average number of teeth
Pesticide Use - Households using pesticides to control insects (%)
Pesticide Use - Households using pesticides to kill weeds (%)
Physical Activity - People doing vigorous-intensity work activities (%)
Physical Activity - People doing moderate-intensity work activities (%)
Physical Activity - People walking or bicycling (%)
Physical Activity - People doing vigorous-intensity recreational activities (%)
Physical Activity - People doing moderate-intensity recreational activities (%)
Physical Activity - Average hours a day doing sedentary activities
Physical Activity - Average hours a day watching TV or videos
Physical Activity - Average hours a day using computer
Physical Functioning - People having limitations keeping them from working (%)
Physical Functioning - People limited in amount of work they can do (%)
Physical Functioning - People that need special equipment to walk (%)
Physical Functioning - People experiencing confusion/memory problems (%)
Physical Functioning - People requiring special healthcare equipment (%)
Prescription Medications - Average number of prescription medicines taking
Preventive Aspirin Use - Adults 40+ taking low-dose aspirin (%)
Reproductive Health - Vaginal deliveries (%)
Reproductive Health - Cesarean deliveries (%)
Reproductive Health - Deliveries resulted in a live birth (%)
Reproductive Health - Pregnancies resulted in a delivery (%)
Reproductive Health - Women breastfeeding newborns (%)
Reproductive Health - Women that had a hysterectomy (%)
Reproductive Health - Women that had both ovaries removed (%)
Reproductive Health - Women that have ever taken birth control pills (%)
Reproductive Health - Women taking birth control pills (%)
Reproductive Health - Women that have ever used Depo-Provera or injectables (%)
Reproductive Health - Women that have ever used female hormones (%)
Sexual Behavior - People 18+ that ever had sex (vaginal, anal, or oral) (%)
Sexual Behavior - Males 18+ that ever had vaginal sex with a woman (%)
Sexual Behavior - Males 18+ that ever performed oral sex on a woman (%)
Sexual Behavior - Males 18+ that ever had anal sex with a woman (%)
Sexual Behavior - Males 18+ that ever had any sex with a man (%)
Sexual Behavior - Females 18+ that ever had vaginal sex with a man (%)
Sexual Behavior - Females 18+ that ever performed oral sex on a man (%)
Sexual Behavior - Females 18+ that ever had anal sex with a man (%)
Sexual Behavior - Females 18+ that ever had any kind of sex with a woman (%)
Sexual Behavior - Average age people first had sex
Sexual Behavior - Average number of female sex partners in lifetime (males 18+)
Sexual Behavior - Average number of female vaginal sex partners in lifetime (males 18+)
Sexual Behavior - Average age people first performed oral sex on a woman (18+)
Sexual Behavior - Average number of woman performed oral sex on in lifetime (18+)
Sexual Behavior - Average number of male sex partners in lifetime (males 18+)
Sexual Behavior - Average number of male anal sex partners in lifetime (males 18+)
Sexual Behavior - Average age people first performed oral sex on a man (18+)
Sexual Behavior - Average number of male oral sex partners in lifetime (18+)
Sexual Behavior - People using protection when performing oral sex (%)
Sexual Behavior - Average number of times people have vaginal or anal sex a year
Sexual Behavior - People having sex without condom (%)
Sexual Behavior - Average number of male sex partners in lifetime (females 18+)
Sexual Behavior - Average number of male vaginal sex partners in lifetime (females 18+)
Sexual Behavior - Average number of female sex partners in lifetime (females 18+)
Sexual Behavior - Circumcised males 18+ (%)
Sleep Disorders - Average hours sleeping at night
Sleep Disorders - People that has trouble sleeping (%)
Smoking-Cigarette Use - People smoking cigarettes (%)
Taste & Smell - People 40+ having problems with smell (%)
Taste & Smell - People 40+ having problems with taste (%)
Taste & Smell - People 40+ that ever had wisdom teeth removed (%)
Taste & Smell - People 40+ that ever had tonsils teeth removed (%)
Taste & Smell - People 40+ that ever had a loss of consciousness because of a head injury (%)
Taste & Smell - People 40+ that ever had a broken nose or other serious injury to face or skull (%)
Taste & Smell - People 40+ that ever had two or more sinus infections (%)
Weight - Average height (inches)
Weight - Average weight (pounds)
Weight - Average BMI
Weight - People that are obese (%)
Weight - People that ever were obese (%)
Weight - People trying to lose weight (%)
Officers per 1,000 residents here:
1.41Oregon average:
1.48
Latest news from St. Helens, OR collected exclusively by city-data.com from local newspapers, TV, and radio stations
Ancestries: European (13.8%), German (9.9%), American (9.4%), English (8.9%), Irish (7.5%), Swiss (4.9%).
Current Local Time:
Land area: 4.35 square miles.
Population density: 3,307 people per square mile (average).
604 residents are foreign born (2.6% Latin America , 0.7% Europe , 0.6% North America ).
This city:
4.3%Oregon:
9.8%
Median real estate property taxes paid for housing units with mortgages in 2022: $2,544 (0.7%)Median real estate property taxes paid for housing units with no mortgage in 2022: $2,437 (0.8%)
Nearest city with pop. 50,000+: Vancouver, WA
Nearest city with pop. 200,000+: Portland, OR
Nearest city with pop. 1,000,000+: Los Angeles, CA
Nearest cities:
Pine Grove, WA (2.9 miles)
Latitude: 45.86 N, Longitude: 122.82 W
Daytime population change due to commuting: -2,254 (-16.0%)Workers who live and work in this city: 2,586 (37.5%)
Area code commonly used in this area: 360
Single-family new house construction building permits:
2022: 12 buildings , average cost: $283,2002021: 122 buildings , average cost: $269,0002020: 82 buildings , average cost: $263,1002019: 22 buildings , average cost: $211,8002018: 11 buildings , average cost: $215,3002017: 24 buildings , average cost: $216,7002016: 23 buildings , average cost: $216,7002015: 27 buildings , average cost: $211,2002014: 32 buildings , average cost: $216,3002013: 36 buildings , average cost: $218,9002012: 9 buildings , average cost: $144,9002011: 14 buildings , average cost: $201,2002010: 13 buildings , average cost: $182,5002009: 10 buildings , average cost: $175,5002008: 27 buildings , average cost: $172,3002007: 70 buildings , average cost: $160,2002006: 73 buildings , average cost: $176,8002005: 161 buildings , average cost: $173,9002004: 149 buildings , average cost: $150,4002003: 64 buildings , average cost: $199,2002002: 127 buildings , average cost: $130,8002001: 117 buildings , average cost: $109,3002000: 123 buildings , average cost: $124,0001999: 131 buildings , average cost: $126,1001998: 92 buildings , average cost: $118,9001997: 114 buildings , average cost: $113,400Unemployment in December 2023:
Population change in the 1990s: +2,343 (+30.5%).
Most common occupations in St. Helens, OR (%)
Both Males Females
Other production occupations, including supervisors (6.5%)
Material recording, scheduling, dispatching, and distributing workers (5.8%)
Electrical equipment mechanics and other installation, maintenance, and repair workers, including supervisors (4.3%)
Other management occupations, except farmers and farm managers (3.9%)
Building and grounds cleaning and maintenance occupations (3.8%)
Laborers and material movers, hand (3.5%)
Other sales and related occupations, including supervisors (3.0%)
Other production occupations, including supervisors (10.3%)
Electrical equipment mechanics and other installation, maintenance, and repair workers, including supervisors (7.3%)
Laborers and material movers, hand (5.2%)
Material recording, scheduling, dispatching, and distributing workers (5.0%)
Driver/sales workers and truck drivers (4.7%)
Metal workers and plastic workers (4.6%)
Building and grounds cleaning and maintenance occupations (3.9%)
Material recording, scheduling, dispatching, and distributing workers (6.8%)
Other office and administrative support workers, including supervisors (5.8%)
Bookkeeping, accounting, and auditing clerks (5.2%)
Other management occupations, except farmers and farm managers (5.0%)
Other sales and related occupations, including supervisors (4.3%)
Preschool, kindergarten, elementary, and middle school teachers (4.1%)
Information and record clerks, except customer service representatives (4.1%)
Earthquake activity:
St. Helens-area historical earthquake activity is significantly above Oregon state average. It is 1479% greater than the overall U.S. average. On 4/13/1949 at 19:55:42, a magnitude 7.0 (7.0 UK, Class: Major, Intensity: VIII - XII) earthquake occurred 97.4 miles away from the city center, causing $80,000,000 total damage On 2/28/2001 at 18:54:32, a magnitude 6.8 (6.5 MB, 6.6 MS, 6.8 MW, Class: Strong, Intensity: VII - IX) earthquake occurred 85.9 miles away from the city center, causing $2,000,000,000 total damage and $305,000,000 insured lossesOn 2/28/2001 at 18:54:32, a magnitude 6.8 (6.8 MD, Depth: 32.2 mi) earthquake occurred 89.3 miles away from St. Helens center On 4/29/1965 at 15:28:43, a magnitude 6.6 (6.6 UK) earthquake occurred 103.4 miles away from the city center, causing $28,000,000 total damage On 1/31/1922 at 13:17:28, a magnitude 7.6 (7.6 UK) earthquake occurred 382.5 miles away from the city center On 8/17/1991 at 22:17:14, a magnitude 7.1 (6.2 MB, 7.1 MS, 7.1 MW, 6.8 ML, Depth: 8.4 mi) earthquake occurred 316.1 miles away from St. Helens center Magnitude types: body-wave magnitude (MB), duration magnitude (MD), local magnitude (ML), surface-wave magnitude (MS), moment magnitude (MW) Natural disasters: The number of natural disasters in Columbia County (15) is near the US average (15).Major Disasters (Presidential) Declared: 12Emergencies Declared: 1Floods: 9, Landslides: 6, Mudslides: 6, Winter Storms: 6, Storms: 5, Winds: 3, Snows: 2, Fire: 1, Heavy Rain: 1, Hurricane: 1, Other: 1 (Note: some incidents may be assigned to more than one category). Hospitals and medical centers near St. Helens: PNRS ST HELENS DIALYSIS (Dialysis Facility, about 1 miles away; SAINT HELENS, OR)
ST HELENS HOSPITAL AND HEALTH CENTER (Hospital, about 1 miles away; SAINT HELENS, OR)
MEADOW PARK HEALTH AND SPECIALTY (Nursing Home, about 1 miles away; SAINT HELENS, OR)
RIDGEFIELD CARE FACILITY (Nursing Home, about 6 miles away; RIDGEFIELD, WA)
MOOREHAVEN CARE CENTER (Nursing Home, about 7 miles away; LA CENTER, WA)
COLUMBIA CARE CENTER (Nursing Home, about 8 miles away; SCAPPOOSE, OR)
LEGACY SALMON CREEK MEDICAL CENTER (about 13 miles away; VANCOUVER, WA)
Amtrak station near St. Helens: 18 miles: VANCOUVER (FOOT OF W. 11TH ST.) Services: ticket office, fully wheelchair accessible, enclosed waiting area, public restrooms, public payphones, vending machines, free short-term parking, free long-term parking, call for taxi service.
Colleges/universities with over 2000 students nearest to St. Helens:
Clark College (about 18 miles; Vancouver, WA ; Full-time enrollment: 9,330)
University of Portland (about 21 miles; Portland, OR ; FT enrollment: 4,030)
Lower Columbia College (about 21 miles; Longview, WA ; FT enrollment: 2,595)
Concordia University-Portland (about 22 miles; Portland, OR ; FT enrollment: 3,996)
Portland State University (about 25 miles; Portland, OR ; FT enrollment: 21,450)
Pacific University (about 28 miles; Forest Grove, OR ; FT enrollment: 2,967)
Lewis & Clark College (about 30 miles; Portland, OR ; FT enrollment: 2,864)
Public high schools in St. Helens:
Public elementary/middle schools in St. Helens:
See full list of schools located in St. Helens Library in St. Helens: ST. HELENS PUBLIC LIBRARY Operating income: $709,389; Location: 375 S 18TH ST, STE A; 38,063 books ; 6,668 audio materials ; 5,212 video materials ; 27 state licensed databases ; 1 other licensed databases ; 174 print serial subscriptions ; 2 electronic serial subscriptions )
User-submitted facts and corrections:
St Helens has a old town and a new one. The City Hall, located in Old Town, was the one in the movie "Halloweentown".
St Helens has a old town and a new one. The City Hall, located in Old Town, was the one in the movie \"Halloweentown\".
Notable locations in St. Helens: (A) , Saint Helen's City Marina Boat Launch (B) , Sand Island Marine City Park Dock North (C) , Saint Helens Station (D) , Columbia County Rider Rite Aid Park and Ride (E) , Columbia View City Park Courthouse Docks (F) , Sand Island Marine City Park Dock South (G) , Columbia County Rider Columbia Commons Park and Ride (H) , Columbia County Public Health Department (I) , Columbia River Fire and Rescue Saint Helens Station (J) , Department of Motor Vehicles Saint Helens (K) , Saint Helens City Hall (L) , Columbia County Courthouse (M) , Saint Helens Municipal Court (N) , Historical Society of Columbia County (O) , Columbia Community Mental Health Pathways Residential Treatment Facility (P) , Saint Helens Public Library (Q) . Display/hide their locations on the map
Churches in St. Helens include: (A) , First Lutheran Church (B) , Sunset Park Community Church (C) . Display/hide their locations on the map
Streams, rivers, and creeks: (A) , McNulty Creek (B) , Milton Creek (C) , Scappoose Creek (D) . Display/hide their locations on the map
Parks in St. Helens include: (1) , Dalton City Park (2) , Highway 30 Greenway (3) , Walnut Tree City Park (4) , Civic Pride Park (5) , Heinie Heumann Park (6) , Knighton Square (7) , Sand Island Marine Park (8) , McCormick Park (9) . Display/hide their locations on the map
Birthplace of: Robert O. Cornthwaite - Film actor.
Columbia County has a predicted average indoor radon screening level between 2 and 4 pCi/L (pico curies per liter) - Moderate Potential Average household size: This city:
2.6 peopleOregon:
2.5 people
Percentage of family households: This city:
66.9%Whole state:
63.4%
Percentage of households with unmarried partners: This city:
9.2%Whole state:
8.0%
Likely homosexual households (counted as self-reported same-sex unmarried-partner households)
Lesbian couples: 0.4% of all households Gay men: 0.1% of all households
People in group quarters in St. Helens in 2010:
190 people in local jails and other municipal confinement facilities
51 people in nursing facilities/skilled-nursing facilities
35 people in group homes intended for adults
33 people in residential treatment centers for adults
People in group quarters in St. Helens in 2000:
59 people in nursing homes
51 people in local jails and other confinement facilities (including police lockups)
29 people in other noninstitutional group quarters
15 people in homes for the mentally ill
10 people in homes for the mentally retarded
3 people in homes or halfway houses for drug/alcohol abuse
Banks with branches in St. Helens (2011 data):
Bank of the West: St. Helens Branch at 465 South Columbia River Highway, branch established on 1958/01/01. Info updated 2009/11/16: Bank assets: $62,408.3 mil, Deposits: $43,995.2 mil, headquarters in San Francisco, CA, positive income , 647 total offices , Holding Company: Bnp Paribas
JPMorgan Chase Bank, National Association: St. Helens Branch at 1934 Columbia Blvd, branch established on 1949/07/01. Info updated 2011/11/10: Bank assets: $1,811,678.0 mil, Deposits: $1,190,738.0 mil, headquarters in Columbus, OH, positive income , International Specialization, 5577 total offices , Holding Company: Jpmorgan Chase & Co.
For population 15 years and over in St. Helens:
Never married: 32.8%Now married: 42.3%Separated: 1.1%Widowed: 7.3%Divorced: 16.5% For population 25 years and over in St. Helens:
High school or higher: 90.8%Bachelor's degree or higher: 14.8%Graduate or professional degree: 4.8%Unemployed: 7.0%Mean travel time to work (commute): 27.1 minutes
Education Gini index (Inequality in education) Here:
9.4Oregon average:
11.6
Religion statistics for St. Helens, OR (based on Columbia County data)
Religion Adherents Congregations Evangelical Protestant 4,269 47 Other 2,835 11 Catholic 1,377 4 Mainline Protestant 1,342 9 None 39,528 -
Source: Clifford Grammich, Kirk Hadaway, Richard Houseal, Dale E.Jones, Alexei Krindatch, Richie Stanley and Richard H.Taylor. 2012. 2010 U.S.Religion Census: Religious Congregations & Membership Study. Association of Statisticians of American Religious Bodies. Jones, Dale E., et al. 2002. Congregations and Membership in the United States 2000. Nashville, TN: Glenmary Research Center. Graphs represent county-level data
Food Environment Statistics: Number of grocery stores : 9Here :
1.84 / 10,000 pop.Oregon :
2.03 / 10,000 pop.
Number of supercenters and club stores : 1Columbia County :
0.20 / 10,000 pop.Oregon :
0.33 / 10,000 pop.
Number of convenience stores (no gas) : 5Columbia County :
1.02 / 10,000 pop.Oregon :
2.01 / 10,000 pop.
Number of convenience stores (with gas) : 15This county :
3.07 / 10,000 pop.Oregon :
1.69 / 10,000 pop.
Number of full-service restaurants : 32Columbia County :
6.54 / 10,000 pop.State :
9.93 / 10,000 pop.
Adult obesity rate : Columbia County :
30.4%Oregon :
25.6%
Low-income preschool obesity rate : This county :
19.7%Oregon :
14.2%
Health and Nutrition: Healthy diet rate : This city:
49.8%Oregon:
49.6%
Average overall health of teeth and gums : People feeling badly about themselves : St. Helens:
21.2%Oregon:
21.2%
People not drinking alcohol at all : Average hours sleeping at night : General health condition : This city:
57.2%State:
56.5%
Average condition of hearing : This city:
79.5%Oregon:
78.7%
More about Health and Nutrition of St. Helens, OR Residents
St. Helens government finances - Expenditure in 2017 (per resident):
Construction - General - Other: $962,000 ($66.95)
Regular Highways: $912,000 ($63.47)Water Utilities: $723,000 ($50.32)Sewerage: $191,000 ($13.29)Parks and Recreation: $102,000 ($7.10)Current Operations - Sewerage: $3,650,000 ($254.02)
Police Protection: $2,536,000 ($176.49)Water Utilities: $2,344,000 ($163.13)General - Other: $1,083,000 ($75.37)Regular Highways: $782,000 ($54.42)Libraries: $627,000 ($43.64)Judicial and Legal Services: $400,000 ($27.84)Parks and Recreation: $324,000 ($22.55)Central Staff Services: $285,000 ($19.83)Protective Inspection and Regulation - Other: $245,000 ($17.05)General - Interest on Debt: $241,000 ($16.77)
Water Utilities - Interest on Debt: $116,000 ($8.07)
St. Helens government finances - Revenue in 2017 (per resident):
Charges - Sewerage: $3,630,000 ($252.63)
Miscellaneous - General Revenue - Other: $676,000 ($47.05)
Fines and Forfeits: $261,000 ($18.16)Interest Earnings: $76,000 ($5.29)Revenue - Water Utilities: $3,118,000 ($216.99)
State Intergovernmental - Highways: $785,000 ($54.63)
General Local Government Support: $217,000 ($15.10)Other: $147,000 ($10.23)Tax - Property: $1,679,000 ($116.85)
Public Utilities Sales: $1,631,000 ($113.51)Other License: $800,000 ($55.68)Other Selective Sales: $139,000 ($9.67)
St. Helens government finances - Debt in 2017 (per resident):
Long Term Debt - Beginning Outstanding - Unspecified Public Purpose: $16,923,000 ($1177.74)
Outstanding Unspecified Public Purpose: $16,700,000 ($1162.22)Retired Unspecified Public Purpose: $971,000 ($67.58)Issue, Unspecified Public Purpose: $748,000 ($52.06)
St. Helens government finances - Cash and Securities in 2017 (per resident):
Other Funds - Cash and Securities: $14,025,000 ($976.06)
Sinking Funds - Cash and Securities: $346,000 ($24.08)
Businesses in St. Helens, OR
Name Count Name Count
Blockbuster 1 Rite Aid 1 Cricket Wireless 1 Starbucks 1 GNC 1 Walgreens 1
Strongest AM radio stations in St. Helens:
KOHI (1600 AM; 1 kW; ST. HELENS, OR)
KPAM (860 AM; 50 kW; TROUTDALE, OR; Owner: PAMPLIN BROADCASTING-OREGON, INC.)
KKAD (1550 AM; 50 kW; VANCOUVER, WA; Owner: PAMPLIN BROADCASTING-WASHINGTON, INC)
KPOJ (620 AM; 50 kW; PORTLAND, OR; Owner: CITICASTERS LICENSES, L.P.)
KOTK (1080 AM; 50 kW; PORTLAND, OR; Owner: FISHER BROADCASTING - PORTLAND RADIO, L.L.C.)
KXL (750 AM; 50 kW; PORTLAND, OR; Owner: ROSE CITY RADIO CORPORATION)
KEX (1190 AM; 50 kW; PORTLAND, OR; Owner: CITICASTERS LICENSES, L.P.)
KKSN (1520 AM; 50 kW; OREGON CITY, OR; Owner: ENTERCOM PORTLAND LICENSE, LLC)
KFXX (910 AM; 10 kW; VANCOUVER, WA; Owner: ENTERCOM PORTLAND LICENSE, LLC (DE))
KKGT (1150 AM; 5 kW; PORTLAND, OR; Owner: WESTERN BROADCASTING COMPANY)
KUPL (970 AM; 5 kW; PORTLAND, OR; Owner: INFINITY RADIO OPERATIONS INC.)
KBAM (1270 AM; 5 kW; LONGVIEW, WA; Owner: ENTERCOM LONGVIEW LICENSE, LLC)
KKSL (1290 AM; 10 kW; LAKE OSWEGO, OR; Owner: ABC, INC.)
Strongest FM radio stations in St. Helens:
K273AI (102.5 FM; ARIEL, WA; Owner: CALVARY CHAPEL OF TWIN FALLS, INC.)
KRVO (105.9 FM; VANCOUVER, WA; Owner: CITICASTERS LICENSES, L.P.)
KINK (101.9 FM; PORTLAND, OR; Owner: INFINITY RADIO OPERATIONS INC.)
KKCW (103.3 FM; BEAVERTON, OR; Owner: CITICASTERS LICENSES, L.P.)
KOPB-FM (91.5 FM; PORTLAND, OR; Owner: OREGON PUBLIC BROADCASTING)
KPDQ-FM (93.7 FM; PORTLAND, OR; Owner: SALEM MEDIA OF OREGON, INC.)
KJVH (89.5 FM; LONGVIEW, WA; Owner: FAMILY STATIONS, INC.)
KKRZ (100.3 FM; PORTLAND, OR; Owner: CITICASTERS LICENSES, L.P.)
KMHD (89.1 FM; GRESHAM, OR; Owner: MT. HOOD COMMUNITY COLLEGE DISTRICT)
KVMX (107.5 FM; BANKS, OR; Owner: INFINITY RADIO OPERATIONS INC.)
KLTH (106.7 FM; LAKE OSWEGO, OR; Owner: INIFINITY RADIO OF PORTLAND INC.)
KUPL-FM (98.7 FM; PORTLAND, OR; Owner: INFINITY RADIO OF PORTLAND INC.)
KUFO-FM (101.1 FM; PORTLAND, OR; Owner: INFINITY RADIO OPERATIONS INC.)
KBVM (88.3 FM; PORTLAND, OR; Owner: CATHOLIC BROADCASTING NORTHWEST, INC)
KBPS-FM (89.9 FM; PORTLAND, OR; Owner: SCHOOL DISTRICT #1, MULTNOMAH COUNTY, OR)
K216DH (91.1 FM; CATHLAMET, WA; Owner: TILLICUM FOUNDATION)
KNRK (94.7 FM; CAMAS, WA; Owner: ENTERCOM PORTLAND LICENSE, LLC (DE))
KFIS (104.1 FM; SCAPPOOSE, OR; Owner: CARON BROADCASTING, INC.)
KBOO (90.7 FM; PORTLAND, OR; Owner: THE KBOO FOUNDATION)
KWJJ-FM (99.5 FM; PORTLAND, OR; Owner: FISHER BROADCASTING - PORTLAND RADIO, L.L.C.)
TV broadcast stations around St. Helens:
KATU (Channel 2; PORTLAND, OR; Owner: FISHER BROADCASTING - PORTLAND TV, L.L.C.)
KPDX (Channel 49; VANCOUVER, WA; Owner: MEREDITH CORPORATION)
KPTV (Channel 12; PORTLAND, OR; Owner: MEREDITH CORPORATION)
K57IF (Channel 57; SALEM, OR; Owner: LaGRANDE BROADCASTING, INC.)
KOIN (Channel 6; PORTLAND, OR; Owner: EMMIS TELEVISION LICENSE CORPORATION)
KNMT (Channel 24; PORTLAND, OR; Owner: NATIONAL MINORITY T.V., INC.)
KGW (Channel 8; PORTLAND, OR; Owner: KING BROADCASTING COMPANY)
KOPB-TV (Channel 10; PORTLAND, OR; Owner: OREGON PUBLIC BROADCASTING)
KPXG-LP (Channel 54; PORTLAND, OR; Owner: PAXSON COMMUNICATIONS LICENSE COMPANY, LLC)
K14HN (Channel 14; VANCOUVER/CAMAS, WA; Owner: MEREDITH CORPORATION)
KWBP-LP (Channel 4; PORTLAND, OR; Owner: TRIBUNE BROADCASTING HOLDINGS, INC.)
National Bridge Inventory (NBI) Statistics 9 Number of bridges79ft / 23.7m Total length $272,000 Total costs58,732 Total average daily traffic4,556 Total average daily truck traffic75,025 Total future (year 2025) average daily traffic
FCC Registered Cell Phone Towers: 1
(Yankton Site) 33961 Kappler Rd E (Lat: 45.858917 Lon: -122.869056), Type: Mast, Structure height: 51.8 m, Overall height: 53 m, Call Sign: KNKN411Assigned Frequencies: 880.020 MHz, 880.020 MHz, 880.020 MHz, 835.020 MHz, 835.020 MHz, 835.020 MHz, 891.510 MHz, 891.510 MHz, 891.510 MHz, 846.510 MHz, 846.510 MHz, 846.510 MHzGrant Date: 01/04/2021, Expiration Date: 10/01/2030, Certifier: Gregory M RomanoRegistrant: Verizon Wireless, 5055 North Point Pkwy, Np2ne Network Engineering, Alpharetta, GA 30022, Phone: (770) 797-1070, Email:
FCC Registered Antenna Towers: 4
Jerri L Janjua, 33961 Kappler Road E (Lat: 45.858917 Lon: -122.869056), Type: 53.0, Overall height: 51.8 m, Registrant: Verizon Wireless, LLC, Jerri.Janjua@verizonwireless.Com, , Alpha-retta, Phone: (770) 797-1073 Jerri L Janjua, 33961 Kappler Road E (Lat: 45.858917 Lon: -122.869056), Type: 53.0, Overall height: 51.8 m, Registrant: Verizon Wireless, LLC, Jerri.Janjua@verizonwireless.Com, , Alpha-retta, Phone: (770) 797-1073 Sally J Jones, 58611 Mcnulty Way (Lat: 45.846083 Lon: -122.830444), Type: 38.1, Overall height: 38.1 m, Registrant: Columbia 9-1-1 Communications District, St. H-elens, Phone: (503) 397-7255 Sally Jones, 58611 Mcnulty Way (Lat: 45.846083 Lon: -122.830444), Type: 38.1, Structure height: 41009 m, Overall height: 38.1 m, Registrant: Radio Licensing Services, Radiolicensing@cuaccess.Net, , 22161 Milwa-ukie, Phone: (503) 659-1240 FCC Registered Broadcast Land Mobile Towers: 1
Lat: 45.862417 Lon: -122.809306, Call Sign: WPYZ243, Assigned Frequencies: 452.037 MHz, Grant Date: 12/04/2014, Expiration Date: 12/30/2024, Certifier: Nathan Nash, Registrant: St. Helens School, 2375 Gable Road, St. Helens, OR 97051, Phone: (503) 397-3085, Fax: (503) 397-7280, Email:
FCC Registered Microwave Towers: 2
Dispatch, 56811 Mcnulty Way (Lat: 45.846083 Lon: -122.830528), Type: Ltower, Structure height: 38.1 m, Call Sign: WPXV985, Assigned Frequencies: 5960.02 MHz, 5960.02 MHz, 5960.02 MHz, 5960.02 MHz, 5960.02 MHz, 5960.02 MHz, 5960.02 MHz, 5960.02 MHz, 11205.0 MHz, Grant Date: 03/31/2023, Expiration Date: 06/19/2033, Certifier: Salley Jones, Registrant: Micronet Communications, Inc., 812 Lexington Dr, Plano, TX 75075, Phone: (972) 422-7200, Email:
PO02510E, 454 Milton Way (Lat: 45.855972 Lon: -122.822611), Type: Mtower, Structure height: 44.5 m, Overall height: 46.9 m, Call Sign: WRBU857, Assigned Frequencies: 6555.00 MHz, 6555.00 MHz, 6555.00 MHz, 6555.00 MHz, 6555.00 MHz, 6555.00 MHz, 6555.00 MHz, 6555.00 MHz, 6555.00 MHz, 6555.00 MHz... (+19 more), Grant Date: 06/26/2018, Expiration Date: 06/26/2028, Certifier: David Werblow, Registrant: T-Mobile Usa, Inc., 12920 Se 38th Street, Bellevue, WA 98006, Phone: (425) 383-8401, Fax: (425) 383-4040, Email:
FCC Registered Amateur Radio Licenses: 10 (
See the full list of FCC Registered Amateur Radio Licenses in St. Helens )
Home Mortgage Disclosure Act Aggregated Statistics For Year 2009(Based on 1 full and 1 partial tracts) A) FHA, FSA/RHS & VA B) Conventional C) Refinancings D) Home Improvement Loans E) Loans on Dwellings For 5+ Families F) Non-occupant Loans on G) Loans On Manufactured Number Average Value Number Average Value Number Average Value Number Average Value Number Average Value Number Average Value Number Average Value
LOANS ORIGINATED 41 $166,440 29 $150,377 205 $163,456 9 $26,559 1 $57,540 16 $110,228 6 $131,288 APPLICATIONS APPROVED, NOT ACCEPTED 6 $170,543 2 $73,500 24 $175,842 2 $6,670 0 $0 3 $81,800 0 $0 APPLICATIONS DENIED 15 $153,159 7 $136,596 106 $177,963 14 $70,985 0 $0 8 $151,955 4 $70,648 APPLICATIONS WITHDRAWN 8 $162,646 12 $132,534 60 $150,689 4 $53,585 0 $0 10 $145,778 4 $113,050 FILES CLOSED FOR INCOMPLETENESS 5 $152,840 7 $144,451 30 $177,198 0 $0 0 $0 2 $141,345 0 $0
Aggregated Statistics For Year 2008(Based on 1 full and 1 partial tracts) A) FHA, FSA/RHS & VA B) Conventional C) Refinancings D) Home Improvement Loans E) Loans on Dwellings For 5+ Families F) Non-occupant Loans on G) Loans On Manufactured Number Average Value Number Average Value Number Average Value Number Average Value Number Average Value Number Average Value Number Average Value
LOANS ORIGINATED 60 $171,622 55 $156,797 192 $158,447 11 $107,928 2 $969,825 34 $141,090 6 $162,395 APPLICATIONS APPROVED, NOT ACCEPTED 9 $181,714 13 $147,010 33 $175,721 5 $17,108 0 $0 2 $149,540 5 $49,704 APPLICATIONS DENIED 17 $174,603 26 $133,968 172 $168,869 26 $65,732 1 $234,330 18 $165,271 11 $88,579 APPLICATIONS WITHDRAWN 4 $142,418 23 $158,560 68 $169,961 3 $111,603 0 $0 11 $147,158 0 $0 FILES CLOSED FOR INCOMPLETENESS 2 $101,735 4 $155,255 13 $144,561 3 $44,180 0 $0 0 $0 0 $0
Aggregated Statistics For Year 2007(Based on 1 full and 1 partial tracts) A) FHA, FSA/RHS & VA B) Conventional C) Refinancings D) Home Improvement Loans E) Loans on Dwellings For 5+ Families F) Non-occupant Loans on G) Loans On Manufactured Number Average Value Number Average Value Number Average Value Number Average Value Number Average Value Number Average Value Number Average Value
LOANS ORIGINATED 26 $172,383 211 $140,610 237 $152,704 26 $84,193 4 $435,595 63 $124,454 9 $129,400 APPLICATIONS APPROVED, NOT ACCEPTED 4 $145,112 47 $124,987 60 $164,433 6 $89,813 0 $0 10 $147,374 7 $97,116 APPLICATIONS DENIED 1 $179,290 60 $127,403 194 $160,388 48 $111,894 3 $365,667 31 $150,816 16 $80,167 APPLICATIONS WITHDRAWN 3 $157,727 59 $155,942 79 $154,394 13 $94,035 2 $761,045 14 $122,430 1 $35,000 FILES CLOSED FOR INCOMPLETENESS 0 $0 5 $198,366 19 $181,385 1 $16,680 0 $0 4 $105,365 0 $0
Aggregated Statistics For Year 2006(Based on 1 full and 1 partial tracts) A) FHA, FSA/RHS & VA B) Conventional C) Refinancings D) Home Improvement Loans E) Loans on Dwellings For 5+ Families F) Non-occupant Loans on G) Loans On Manufactured Number Average Value Number Average Value Number Average Value Number Average Value Number Average Value Number Average Value Number Average Value
LOANS ORIGINATED 23 $177,785 336 $115,923 323 $133,038 34 $91,053 2 $872,375 90 $115,830 13 $104,613 APPLICATIONS APPROVED, NOT ACCEPTED 1 $128,000 60 $118,314 37 $123,083 6 $22,677 0 $0 14 $126,308 0 $0 APPLICATIONS DENIED 2 $128,420 70 $110,102 214 $141,763 40 $71,361 0 $0 19 $110,338 13 $95,551 APPLICATIONS WITHDRAWN 2 $129,120 47 $126,439 151 $137,352 8 $102,408 0 $0 12 $129,615 1 $133,420 FILES CLOSED FOR INCOMPLETENESS 0 $0 9 $121,344 37 $147,259 1 $140,000 0 $0 1 $140,000 0 $0
Aggregated Statistics For Year 2005(Based on 1 full and 1 partial tracts) A) FHA, FSA/RHS & VA B) Conventional C) Refinancings D) Home Improvement Loans F) Non-occupant Loans on G) Loans On Manufactured Number Average Value Number Average Value Number Average Value Number Average Value Number Average Value Number Average Value
LOANS ORIGINATED 38 $149,788 381 $103,544 307 $118,701 21 $65,508 97 $98,307 11 $77,421 APPLICATIONS APPROVED, NOT ACCEPTED 1 $179,290 67 $91,566 64 $113,690 7 $53,756 22 $96,077 2 $48,110 APPLICATIONS DENIED 5 $107,652 73 $99,394 207 $132,140 28 $43,802 15 $131,763 13 $73,298 APPLICATIONS WITHDRAWN 3 $147,640 31 $118,812 170 $137,277 15 $155,531 13 $127,092 7 $121,630 FILES CLOSED FOR INCOMPLETENESS 2 $139,500 6 $167,810 25 $132,299 0 $0 6 $116,308 0 $0
Aggregated Statistics For Year 2004(Based on 1 full and 1 partial tracts) A) FHA, FSA/RHS & VA B) Conventional C) Refinancings D) Home Improvement Loans E) Loans on Dwellings For 5+ Families F) Non-occupant Loans on G) Loans On Manufactured Number Average Value Number Average Value Number Average Value Number Average Value Number Average Value Number Average Value Number Average Value
LOANS ORIGINATED 49 $145,394 274 $93,218 270 $111,912 12 $34,763 2 $479,195 96 $95,831 11 $85,439 APPLICATIONS APPROVED, NOT ACCEPTED 3 $132,590 47 $87,312 49 $115,611 1 $16,680 1 $875,000 15 $98,933 9 $48,367 APPLICATIONS DENIED 11 $127,740 98 $76,971 178 $122,017 30 $43,699 0 $0 25 $124,018 41 $54,564 APPLICATIONS WITHDRAWN 3 $114,297 41 $98,506 176 $123,226 3 $29,187 0 $0 25 $93,852 3 $62,353 FILES CLOSED FOR INCOMPLETENESS 2 $99,500 4 $104,445 16 $145,890 0 $0 0 $0 3 $138,633 0 $0
Aggregated Statistics For Year 2003(Based on 1 full and 1 partial tracts) A) FHA, FSA/RHS & VA B) Conventional C) Refinancings D) Home Improvement Loans E) Loans on Dwellings For 5+ Families F) Non-occupant Loans on Number Average Value Number Average Value Number Average Value Number Average Value Number Average Value Number Average Value
LOANS ORIGINATED 44 $126,428 146 $99,028 477 $114,014 21 $33,587 2 $622,090 81 $92,402 APPLICATIONS APPROVED, NOT ACCEPTED 2 $129,800 30 $79,894 55 $121,650 4 $22,882 0 $0 13 $93,730 APPLICATIONS DENIED 7 $108,021 55 $63,624 208 $111,546 22 $23,686 0 $0 20 $104,122 APPLICATIONS WITHDRAWN 5 $98,576 10 $75,304 140 $113,822 1 $23,350 0 $0 10 $101,651 FILES CLOSED FOR INCOMPLETENESS 2 $103,500 5 $114,966 25 $111,496 0 $0 0 $0 4 $98,680
Aggregated Statistics For Year 2002(Based on 1 full and 1 partial tracts) A) FHA, FSA/RHS & VA B) Conventional C) Refinancings D) Home Improvement Loans F) Non-occupant Loans on Number Average Value Number Average Value Number Average Value Number Average Value Number Average Value
LOANS ORIGINATED 89 $128,067 140 $107,094 288 $108,470 10 $13,171 71 $105,015 APPLICATIONS APPROVED, NOT ACCEPTED 6 $102,298 20 $63,476 55 $105,876 2 $37,000 6 $101,890 APPLICATIONS DENIED 7 $123,264 54 $60,465 120 $95,482 13 $21,814 18 $63,440 APPLICATIONS WITHDRAWN 8 $141,291 16 $98,180 80 $112,274 2 $19,595 5 $90,262 FILES CLOSED FOR INCOMPLETENESS 0 $0 12 $92,102 14 $113,076 0 $0 2 $105,000
Aggregated Statistics For Year 2001(Based on 1 full and 1 partial tracts) A) FHA, FSA/RHS & VA B) Conventional C) Refinancings D) Home Improvement Loans F) Non-occupant Loans on Number Average Value Number Average Value Number Average Value Number Average Value Number Average Value
LOANS ORIGINATED 74 $120,118 85 $99,293 244 $111,865 20 $19,906 35 $94,020 APPLICATIONS APPROVED, NOT ACCEPTED 1 $130,920 9 $64,540 23 $123,266 3 $54,203 3 $57,693 APPLICATIONS DENIED 9 $121,284 70 $56,925 131 $101,944 20 $19,850 22 $44,104 APPLICATIONS WITHDRAWN 4 $112,345 15 $108,161 70 $112,162 5 $48,986 7 $133,993 FILES CLOSED FOR INCOMPLETENESS 2 $118,000 4 $46,140 17 $114,582 2 $17,500 3 $70,013
Aggregated Statistics For Year 2000(Based on 1 full and 1 partial tracts) A) FHA, FSA/RHS & VA B) Conventional C) Refinancings D) Home Improvement Loans E) Loans on Dwellings For 5+ Families F) Non-occupant Loans on Number Average Value Number Average Value Number Average Value Number Average Value Number Average Value Number Average Value
LOANS ORIGINATED 61 $125,392 103 $106,168 86 $83,878 38 $15,185 1 $804,710 34 $92,281 APPLICATIONS APPROVED, NOT ACCEPTED 1 $67,550 16 $95,385 19 $101,962 16 $28,898 0 $0 5 $132,546 APPLICATIONS DENIED 3 $111,997 44 $86,107 90 $77,999 31 $27,890 0 $0 7 $109,941 APPLICATIONS WITHDRAWN 6 $120,652 23 $91,153 36 $84,467 6 $51,495 0 $0 5 $81,222 FILES CLOSED FOR INCOMPLETENESS 1 $127,590 3 $106,887 17 $111,189 1 $71,000 0 $0 2 $100,015
Aggregated Statistics For Year 1999(Based on 2 partial tracts) A) FHA, FSA/RHS & VA B) Conventional C) Refinancings D) Home Improvement Loans E) Loans on Dwellings For 5+ Families F) Non-occupant Loans on Number Average Value Number Average Value Number Average Value Number Average Value Number Average Value Number Average Value
LOANS ORIGINATED 59 $120,989 123 $96,441 159 $93,611 28 $21,797 2 $456,980 34 $81,975 APPLICATIONS APPROVED, NOT ACCEPTED 0 $0 20 $112,346 32 $82,508 12 $11,807 0 $0 7 $76,934 APPLICATIONS DENIED 5 $118,998 34 $105,272 93 $88,838 21 $25,027 0 $0 13 $89,657 APPLICATIONS WITHDRAWN 4 $129,190 22 $88,852 50 $96,287 5 $38,118 0 $0 5 $131,858 FILES CLOSED FOR INCOMPLETENESS 1 $127,450 6 $130,032 23 $107,210 1 $13,900 0 $0 2 $194,015
Detailed HMDA statistics for the following Tracts:
9707.00
, 9708.00
Private Mortgage Insurance Companies Aggregated Statistics For Year 2009(Based on 1 full and 1 partial tracts) A) Conventional B) Refinancings C) Non-occupant Loans on Number Average Value Number Average Value Number Average Value
LOANS ORIGINATED 4 $191,352 8 $179,725 0 $0 APPLICATIONS APPROVED, NOT ACCEPTED 2 $113,410 3 $144,773 1 $112,580 APPLICATIONS DENIED 0 $0 1 $122,580 0 $0 APPLICATIONS WITHDRAWN 0 $0 1 $168,450 0 $0 FILES CLOSED FOR INCOMPLETENESS 0 $0 0 $0 0 $0
Aggregated Statistics For Year 2008(Based on 1 full and 1 partial tracts) A) Conventional B) Refinancings C) Non-occupant Loans on D) Loans On Manufactured Number Average Value Number Average Value Number Average Value Number Average Value
LOANS ORIGINATED 26 $185,875 17 $178,746 1 $119,250 1 $92,000 APPLICATIONS APPROVED, NOT ACCEPTED 17 $175,579 10 $222,216 1 $135,090 0 $0 APPLICATIONS DENIED 3 $164,277 4 $266,420 0 $0 0 $0 APPLICATIONS WITHDRAWN 3 $122,273 2 $172,815 0 $0 0 $0 FILES CLOSED FOR INCOMPLETENESS 1 $204,000 0 $0 0 $0 0 $0
Aggregated Statistics For Year 2007(Based on 1 full and 1 partial tracts) A) Conventional B) Refinancings C) Non-occupant Loans on Number Average Value Number Average Value Number Average Value
LOANS ORIGINATED 75 $181,899 22 $195,597 8 $144,424 APPLICATIONS APPROVED, NOT ACCEPTED 10 $174,219 3 $181,423 2 $138,425 APPLICATIONS DENIED 4 $164,750 0 $0 0 $0 APPLICATIONS WITHDRAWN 3 $264,667 2 $174,325 0 $0 FILES CLOSED FOR INCOMPLETENESS 0 $0 0 $0 0 $0
Aggregated Statistics For Year 2006(Based on 1 full and 1 partial tracts) A) Conventional B) Refinancings C) Non-occupant Loans on D) Loans On Manufactured Number Average Value Number Average Value Number Average Value Number Average Value
LOANS ORIGINATED 25 $174,665 15 $156,222 2 $123,000 1 $95,900 APPLICATIONS APPROVED, NOT ACCEPTED 2 $159,895 6 $157,943 0 $0 0 $0 APPLICATIONS DENIED 0 $0 0 $0 0 $0 0 $0 APPLICATIONS WITHDRAWN 0 $0 1 $217,650 0 $0 0 $0 FILES CLOSED FOR INCOMPLETENESS 0 $0 0 $0 0 $0 0 $0
Aggregated Statistics For Year 2005(Based on 1 full and 1 partial tracts) A) Conventional B) Refinancings C) Non-occupant Loans on D) Loans On Manufactured Number Average Value Number Average Value Number Average Value Number Average Value
LOANS ORIGINATED 19 $156,316 27 $143,428 1 $68,000 1 $102,000 APPLICATIONS APPROVED, NOT ACCEPTED 5 $115,208 4 $136,318 1 $115,000 0 $0 APPLICATIONS DENIED 0 $0 0 $0 0 $0 0 $0 APPLICATIONS WITHDRAWN 0 $0 1 $92,560 0 $0 0 $0 FILES CLOSED FOR INCOMPLETENESS 0 $0 0 $0 0 $0 0 $0
Aggregated Statistics For Year 2004(Based on 1 full and 1 partial tracts) A) Conventional B) Refinancings C) Non-occupant Loans on D) Loans On Manufactured Number Average Value Number Average Value Number Average Value Number Average Value
LOANS ORIGINATED 29 $133,304 15 $122,245 5 $106,916 1 $90,900 APPLICATIONS APPROVED, NOT ACCEPTED 3 $122,307 8 $123,331 0 $0 0 $0 APPLICATIONS DENIED 1 $118,000 1 $154,270 0 $0 0 $0 APPLICATIONS WITHDRAWN 2 $89,790 2 $98,790 2 $87,290 0 $0 FILES CLOSED FOR INCOMPLETENESS 0 $0 0 $0 0 $0 0 $0
Aggregated Statistics For Year 2003(Based on 1 full and 1 partial tracts) A) Conventional B) Refinancings C) Non-occupant Loans on Number Average Value Number Average Value Number Average Value
LOANS ORIGINATED 27 $131,207 65 $130,533 5 $90,806 APPLICATIONS APPROVED, NOT ACCEPTED 2 $139,700 14 $124,495 2 $104,655 APPLICATIONS DENIED 1 $68,000 2 $102,865 0 $0 APPLICATIONS WITHDRAWN 0 $0 1 $65,000 0 $0 FILES CLOSED FOR INCOMPLETENESS 0 $0 0 $0 0 $0
Aggregated Statistics For Year 2002(Based on 1 full and 1 partial tracts) A) Conventional B) Refinancings C) Non-occupant Loans on Number Average Value Number Average Value Number Average Value
LOANS ORIGINATED 35 $135,947 27 $130,647 4 $84,195 APPLICATIONS APPROVED, NOT ACCEPTED 3 $156,080 8 $142,992 1 $72,000 APPLICATIONS DENIED 1 $93,400 2 $111,775 1 $77,550 APPLICATIONS WITHDRAWN 0 $0 1 $112,580 0 $0 FILES CLOSED FOR INCOMPLETENESS 0 $0 0 $0 0 $0
Aggregated Statistics For Year 2001(Based on 1 full and 1 partial tracts) A) Conventional B) Refinancings C) Non-occupant Loans on Number Average Value Number Average Value Number Average Value
LOANS ORIGINATED 30 $137,217 33 $129,676 9 $110,379 APPLICATIONS APPROVED, NOT ACCEPTED 11 $143,888 6 $120,278 3 $133,667 APPLICATIONS DENIED 2 $159,000 5 $98,206 0 $0 APPLICATIONS WITHDRAWN 1 $97,000 1 $61,710 0 $0 FILES CLOSED FOR INCOMPLETENESS 0 $0 0 $0 0 $0
Aggregated Statistics For Year 2000(Based on 1 full and 1 partial tracts) A) Conventional B) Refinancings C) Non-occupant Loans on Number Average Value Number Average Value Number Average Value
LOANS ORIGINATED 33 $133,569 17 $120,360 1 $96,730 APPLICATIONS APPROVED, NOT ACCEPTED 2 $118,960 1 $129,000 0 $0 APPLICATIONS DENIED 1 $96,730 0 $0 1 $96,730 APPLICATIONS WITHDRAWN 2 $89,225 0 $0 1 $63,380 FILES CLOSED FOR INCOMPLETENESS 0 $0 0 $0 0 $0
Aggregated Statistics For Year 1999(Based on 2 partial tracts) A) Conventional B) Refinancings Number Average Value Number Average Value
LOANS ORIGINATED 43 $127,796 21 $111,697 APPLICATIONS APPROVED, NOT ACCEPTED 3 $94,803 3 $107,570 APPLICATIONS DENIED 3 $111,663 1 $139,960 APPLICATIONS WITHDRAWN 1 $116,550 0 $0 FILES CLOSED FOR INCOMPLETENESS 0 $0 0 $0
Detailed PMIC statistics for the following Tracts:
9707.00
, 9708.00 St. Helens compared to Oregon state average:
Unemployed percentage below state average. Black race population percentage significantly below state average. Foreign-born population percentage below state average. Length of stay since moving in significantly above state average. Percentage of population with a bachelor's degree or higher below state average.
Top Patent Applicants
Adrien R. Lavoie (10)
Michael R. Dennis (9)
Stephen R. Topaz (4)
David Dennis (3)
Curtis J. Deslatte (2)
Anthony John Van Houdt (1)
Brian Glenn Klure (1)
Christopher D. Poorman (1)
Timothy Mullenix (1)
Duwayne R. Anderson (1)
Total of 34 patent applications in 2008-2024.


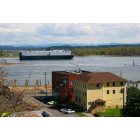

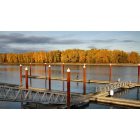

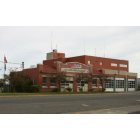


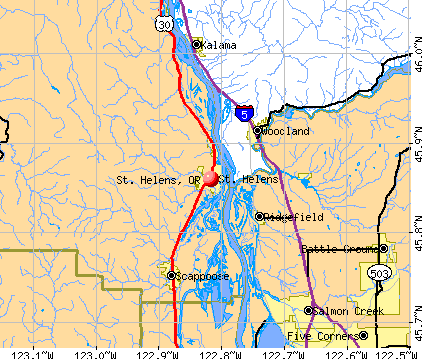


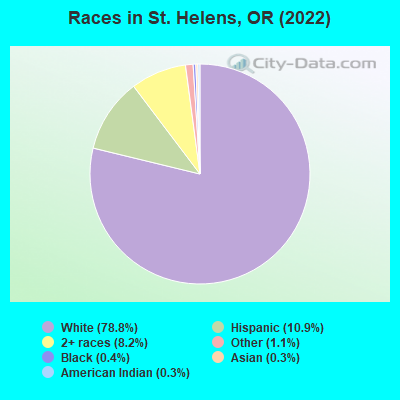
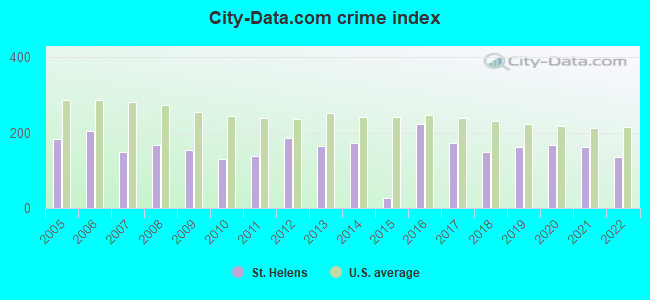
 Recent articles from our blog. Our writers, many of them Ph.D. graduates or candidates, create easy-to-read articles on a wide variety of topics.


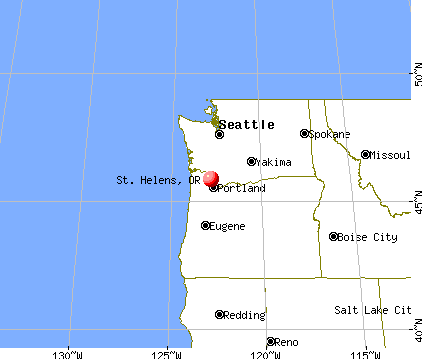
 (18.7 miles
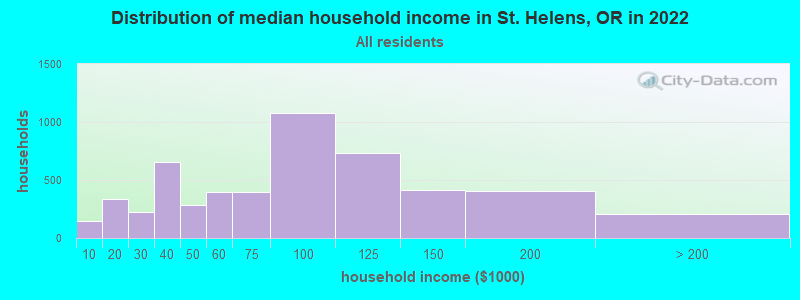
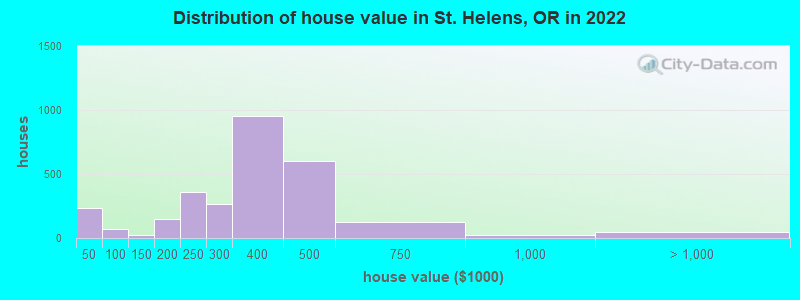
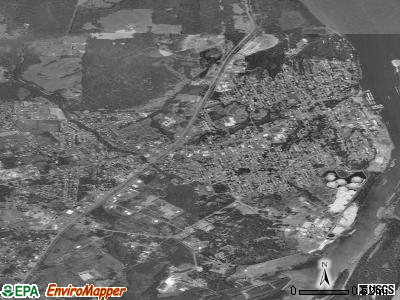
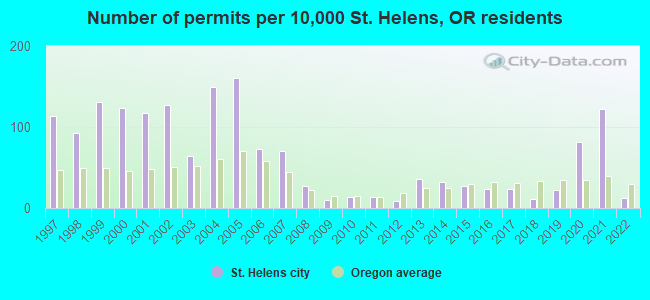
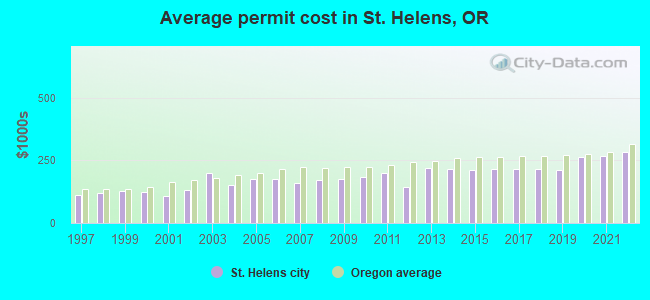
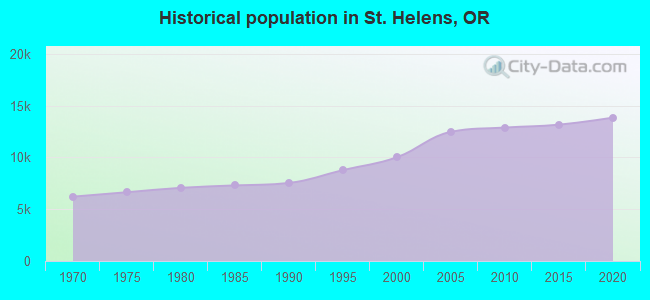
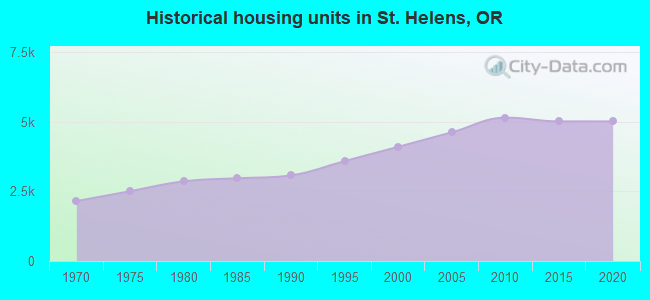
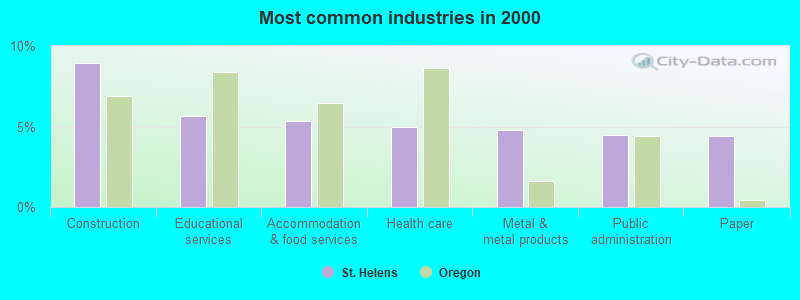
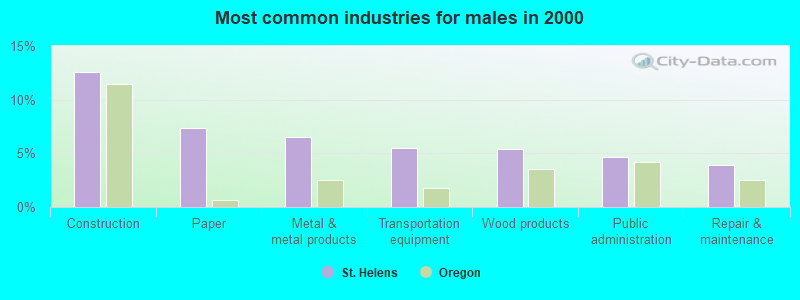
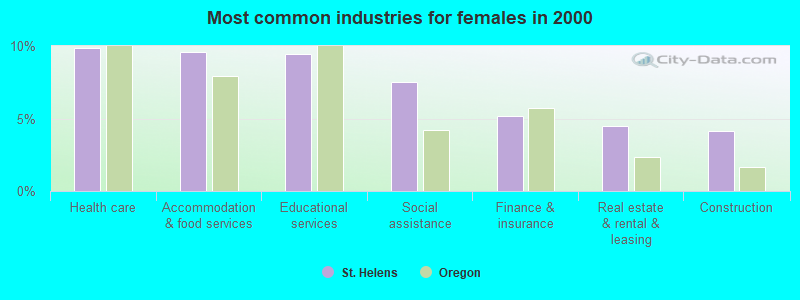
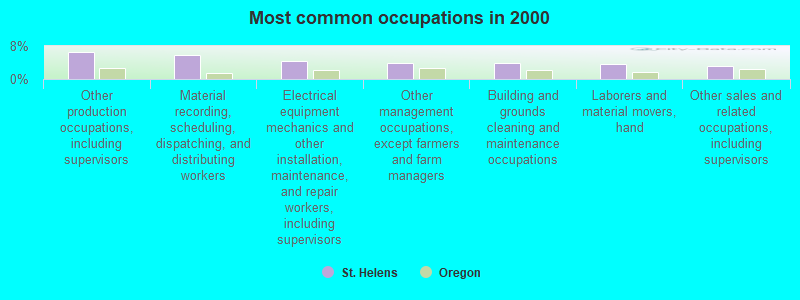
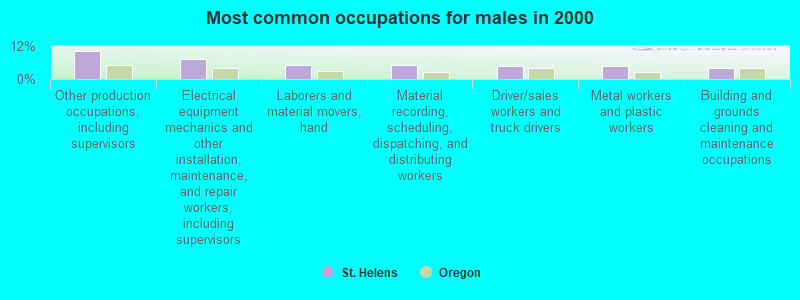
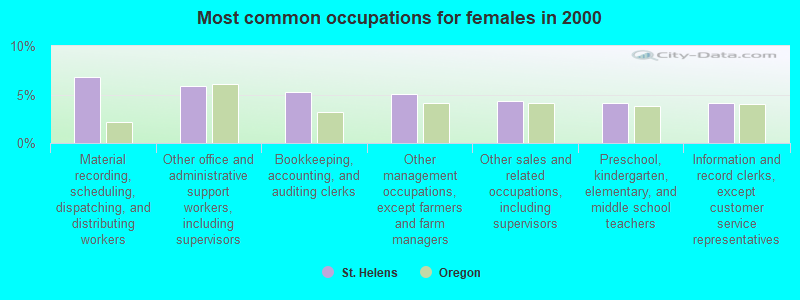
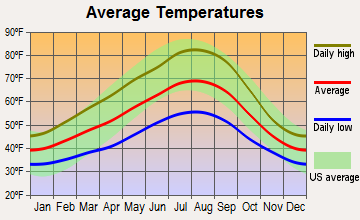
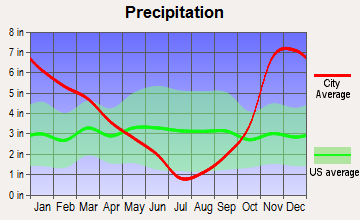
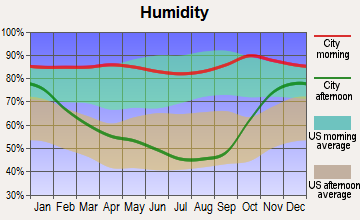
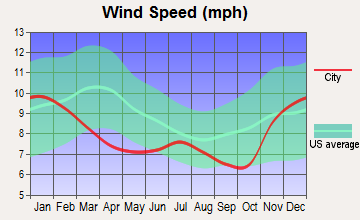
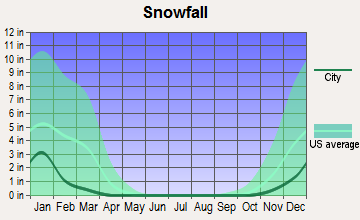
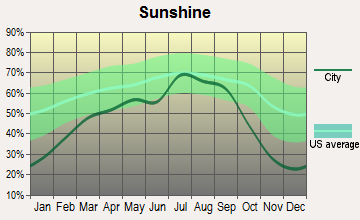
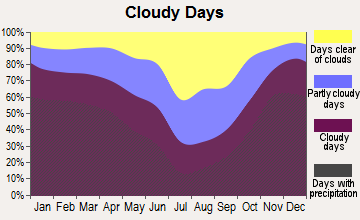
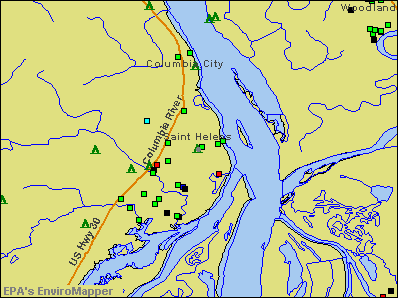

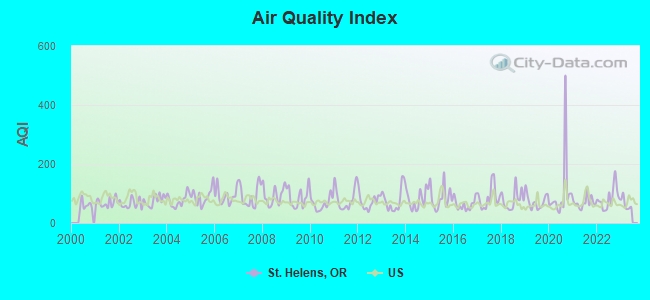
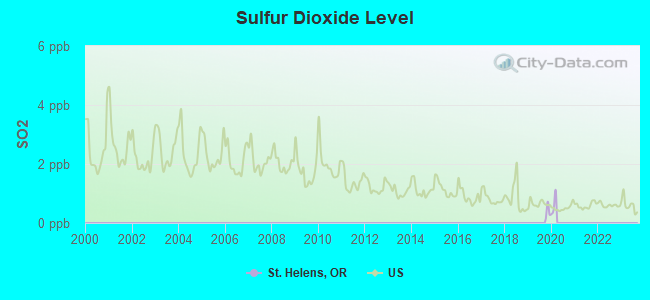
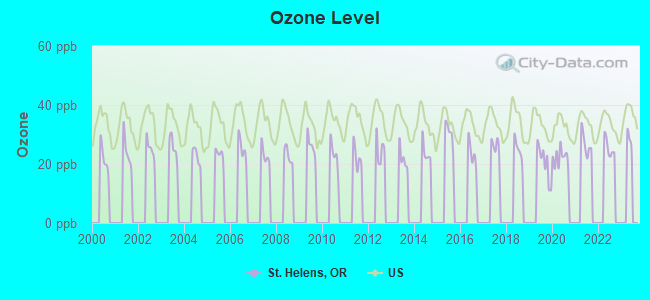
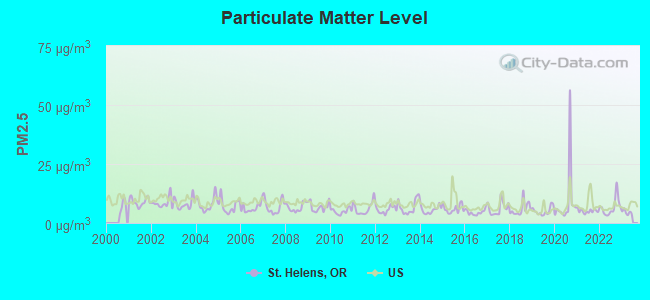
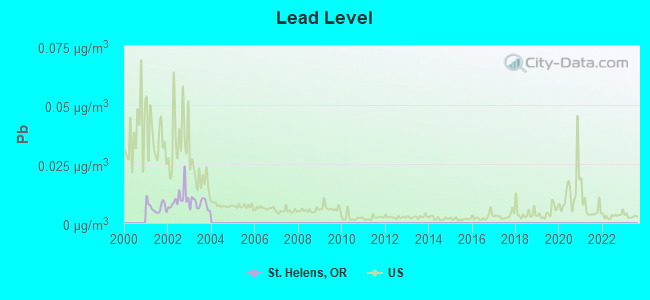
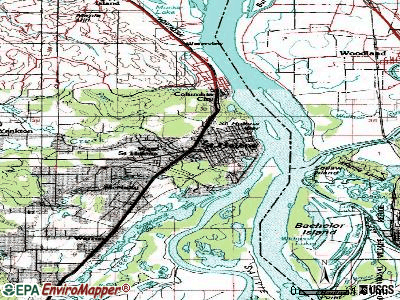
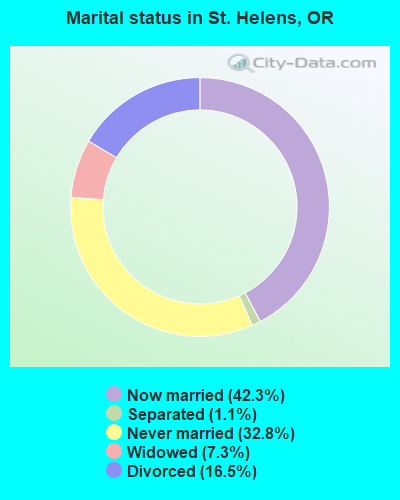
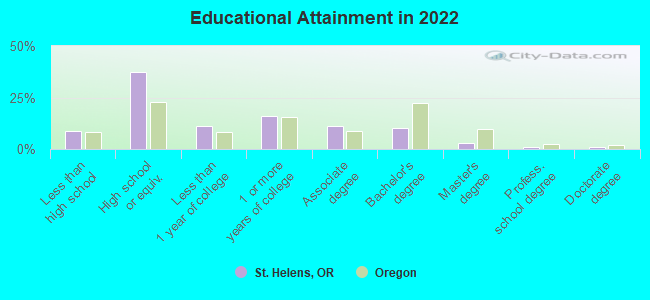
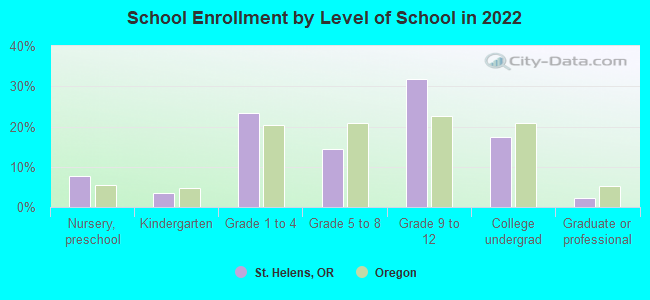
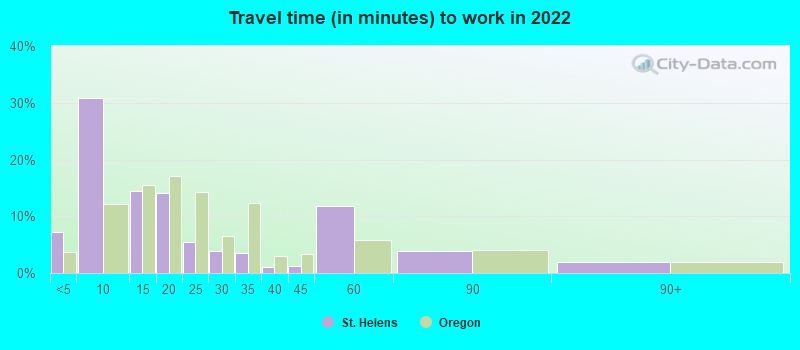
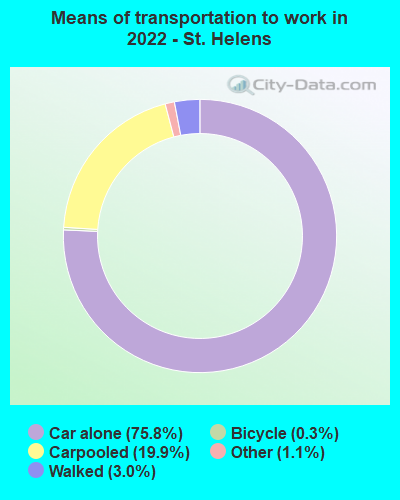
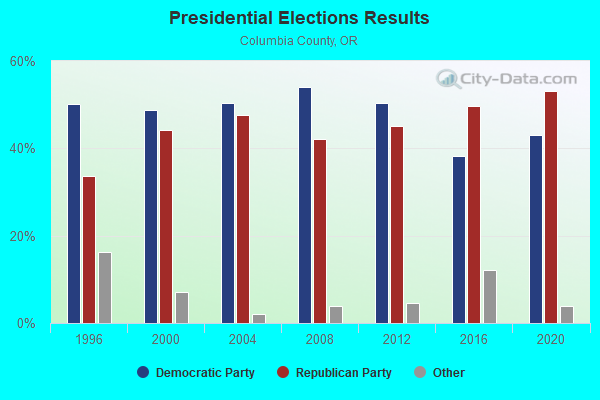
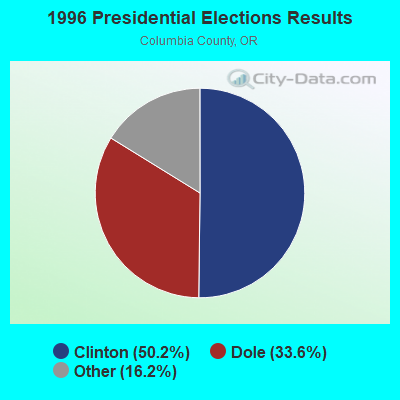
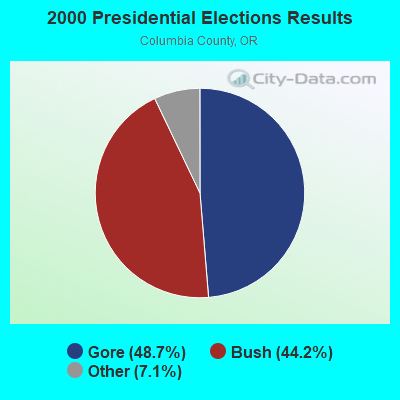
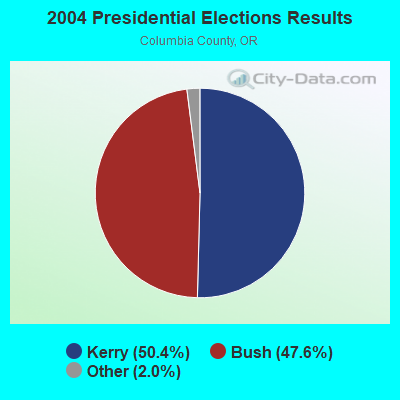
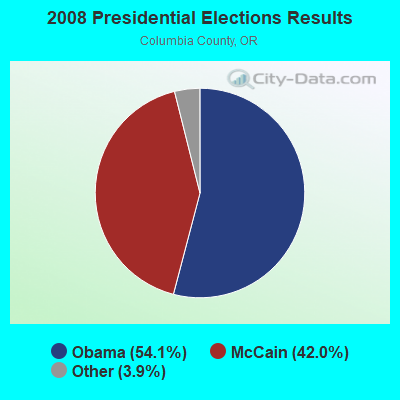
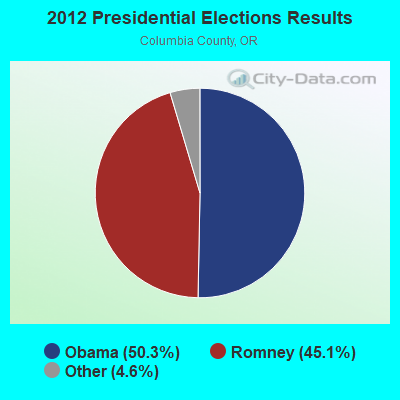
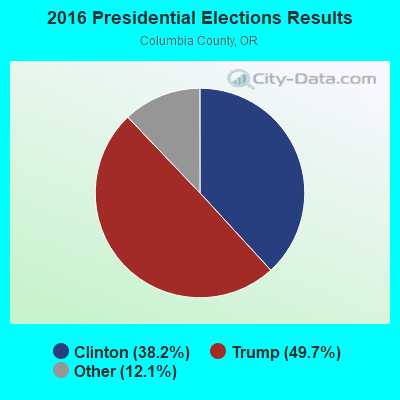
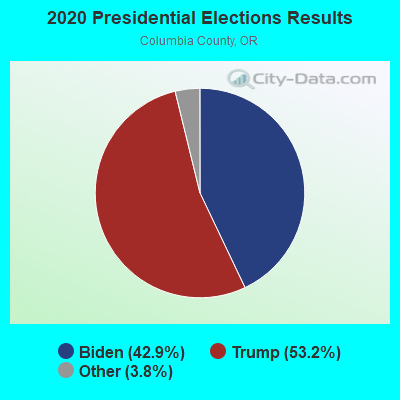
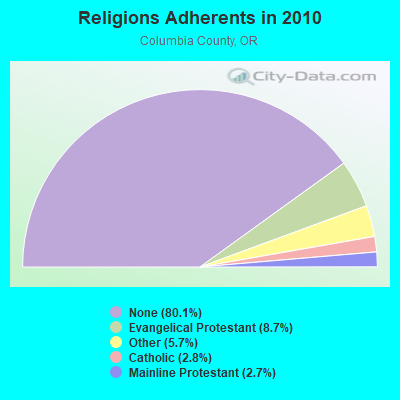
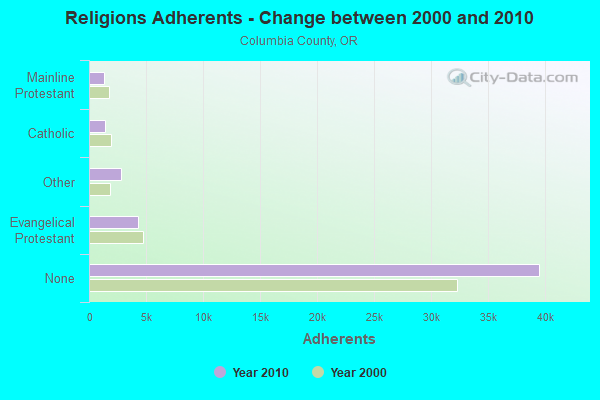
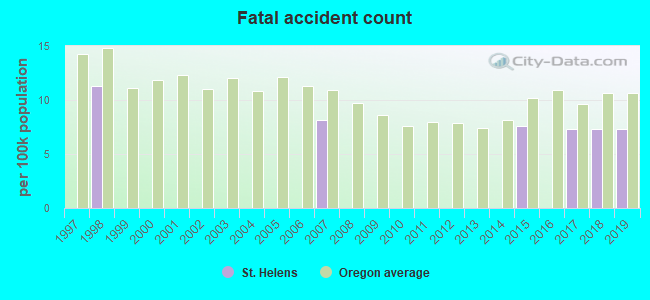
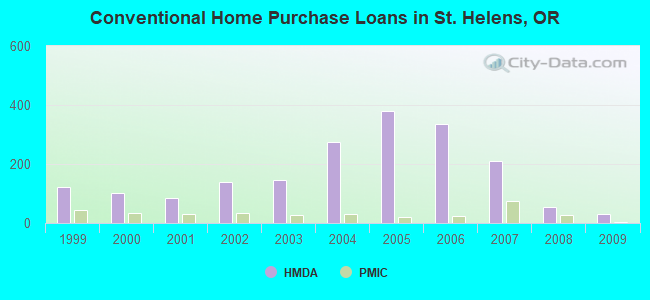
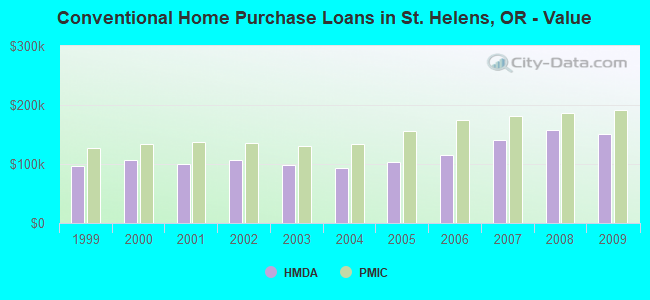
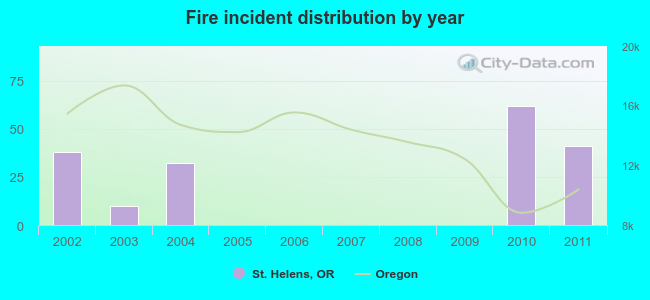 According to the data from the years 2002 - 2011 the average number of fire incidents per year is 18. The highest number of fires - 62 took place in 2010, and the least - 0 in 2005. The data has a rising trend.
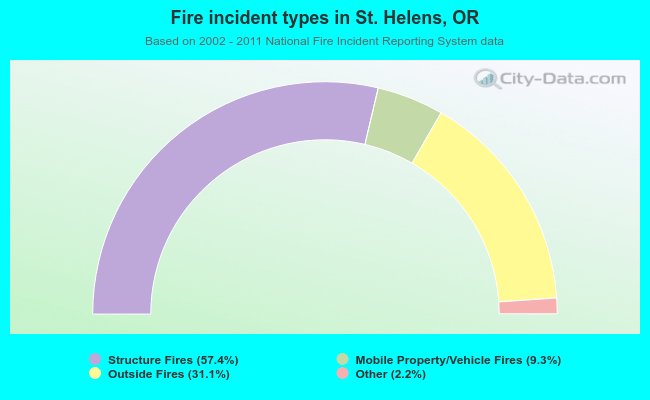 When looking into fire subcategories, the most incidents belonged to: Structure Fires (57.4%), and Outside Fires (31.1%).