Stockbridge, Georgia Submit your own pictures of this city and show them to the world
OSM Map
General Map
Google Map
MSN Map
OSM Map
General Map
Google Map
MSN Map
OSM Map
General Map
Google Map
MSN Map
OSM Map
General Map
Google Map
MSN Map
Please wait while loading the map...
Population in 2022: 29,064 (100% urban, 0% rural). Population change since 2000: +195.0%Males: 12,727 Females: 16,337
March 2022 cost of living index in Stockbridge: 101.1 (near average, U.S. average is 100) Percentage of residents living in poverty in 2022: 8.7%for White Non-Hispanic residents , 9.6% for Black residents , 3.6% for Hispanic or Latino residents , 59.8% for other race residents , 1.3% for two or more races residents )
Profiles of local businesses
Business Search - 14 Million verified businesses
Data:
Median household income ($)
Median household income (% change since 2000)
Household income diversity
Ratio of average income to average house value (%)
Ratio of average income to average rent
Median household income ($) - White
Median household income ($) - Black or African American
Median household income ($) - Asian
Median household income ($) - Hispanic or Latino
Median household income ($) - American Indian and Alaska Native
Median household income ($) - Multirace
Median household income ($) - Other Race
Median household income for houses/condos with a mortgage ($)
Median household income for apartments without a mortgage ($)
Races - White alone (%)
Races - White alone (% change since 2000)
Races - Black alone (%)
Races - Black alone (% change since 2000)
Races - American Indian alone (%)
Races - American Indian alone (% change since 2000)
Races - Asian alone (%)
Races - Asian alone (% change since 2000)
Races - Hispanic (%)
Races - Hispanic (% change since 2000)
Races - Native Hawaiian and Other Pacific Islander alone (%)
Races - Native Hawaiian and Other Pacific Islander alone (% change since 2000)
Races - Two or more races (%)
Races - Two or more races (% change since 2000)
Races - Other race alone (%)
Races - Other race alone (% change since 2000)
Racial diversity
Unemployment (%)
Unemployment (% change since 2000)
Unemployment (%) - White
Unemployment (%) - Black or African American
Unemployment (%) - Asian
Unemployment (%) - Hispanic or Latino
Unemployment (%) - American Indian and Alaska Native
Unemployment (%) - Multirace
Unemployment (%) - Other Race
Population density (people per square mile)
Population - Males (%)
Population - Females (%)
Population - Males (%) - White
Population - Males (%) - Black or African American
Population - Males (%) - Asian
Population - Males (%) - Hispanic or Latino
Population - Males (%) - American Indian and Alaska Native
Population - Males (%) - Multirace
Population - Males (%) - Other Race
Population - Females (%) - White
Population - Females (%) - Black or African American
Population - Females (%) - Asian
Population - Females (%) - Hispanic or Latino
Population - Females (%) - American Indian and Alaska Native
Population - Females (%) - Multirace
Population - Females (%) - Other Race
Coronavirus confirmed cases (Apr 25, 2024)
Deaths caused by coronavirus (Apr 25, 2024)
Coronavirus confirmed cases (per 100k population) (Apr 25, 2024)
Deaths caused by coronavirus (per 100k population) (Apr 25, 2024)
Daily increase in number of cases (Apr 25, 2024)
Weekly increase in number of cases (Apr 25, 2024)
Cases doubled (in days) (Apr 25, 2024)
Hospitalized patients (Apr 18, 2022)
Negative test results (Apr 18, 2022)
Total test results (Apr 18, 2022)
COVID Vaccine doses distributed (per 100k population) (Sep 19, 2023)
COVID Vaccine doses administered (per 100k population) (Sep 19, 2023)
COVID Vaccine doses distributed (Sep 19, 2023)
COVID Vaccine doses administered (Sep 19, 2023)
Likely homosexual households (%)
Likely homosexual households (% change since 2000)
Likely homosexual households - Lesbian couples (%)
Likely homosexual households - Lesbian couples (% change since 2000)
Likely homosexual households - Gay men (%)
Likely homosexual households - Gay men (% change since 2000)
Cost of living index
Median gross rent ($)
Median contract rent ($)
Median monthly housing costs ($)
Median house or condo value ($)
Median house or condo value ($ change since 2000)
Mean house or condo value by units in structure - 1, detached ($)
Mean house or condo value by units in structure - 1, attached ($)
Mean house or condo value by units in structure - 2 ($)
Mean house or condo value by units in structure by units in structure - 3 or 4 ($)
Mean house or condo value by units in structure - 5 or more ($)
Mean house or condo value by units in structure - Boat, RV, van, etc. ($)
Mean house or condo value by units in structure - Mobile home ($)
Median house or condo value ($) - White
Median house or condo value ($) - Black or African American
Median house or condo value ($) - Asian
Median house or condo value ($) - Hispanic or Latino
Median house or condo value ($) - American Indian and Alaska Native
Median house or condo value ($) - Multirace
Median house or condo value ($) - Other Race
Median resident age
Resident age diversity
Median resident age - Males
Median resident age - Females
Median resident age - White
Median resident age - Black or African American
Median resident age - Asian
Median resident age - Hispanic or Latino
Median resident age - American Indian and Alaska Native
Median resident age - Multirace
Median resident age - Other Race
Median resident age - Males - White
Median resident age - Males - Black or African American
Median resident age - Males - Asian
Median resident age - Males - Hispanic or Latino
Median resident age - Males - American Indian and Alaska Native
Median resident age - Males - Multirace
Median resident age - Males - Other Race
Median resident age - Females - White
Median resident age - Females - Black or African American
Median resident age - Females - Asian
Median resident age - Females - Hispanic or Latino
Median resident age - Females - American Indian and Alaska Native
Median resident age - Females - Multirace
Median resident age - Females - Other Race
Commute - mean travel time to work (minutes)
Travel time to work - Less than 5 minutes (%)
Travel time to work - Less than 5 minutes (% change since 2000)
Travel time to work - 5 to 9 minutes (%)
Travel time to work - 5 to 9 minutes (% change since 2000)
Travel time to work - 10 to 19 minutes (%)
Travel time to work - 10 to 19 minutes (% change since 2000)
Travel time to work - 20 to 29 minutes (%)
Travel time to work - 20 to 29 minutes (% change since 2000)
Travel time to work - 30 to 39 minutes (%)
Travel time to work - 30 to 39 minutes (% change since 2000)
Travel time to work - 40 to 59 minutes (%)
Travel time to work - 40 to 59 minutes (% change since 2000)
Travel time to work - 60 to 89 minutes (%)
Travel time to work - 60 to 89 minutes (% change since 2000)
Travel time to work - 90 or more minutes (%)
Travel time to work - 90 or more minutes (% change since 2000)
Marital status - Never married (%)
Marital status - Now married (%)
Marital status - Separated (%)
Marital status - Widowed (%)
Marital status - Divorced (%)
Median family income ($)
Median family income (% change since 2000)
Median non-family income ($)
Median non-family income (% change since 2000)
Median per capita income ($)
Median per capita income (% change since 2000)
Median family income ($) - White
Median family income ($) - Black or African American
Median family income ($) - Asian
Median family income ($) - Hispanic or Latino
Median family income ($) - American Indian and Alaska Native
Median family income ($) - Multirace
Median family income ($) - Other Race
Median year house/condo built
Median year apartment built
Year house built - Built 2005 or later (%)
Year house built - Built 2000 to 2004 (%)
Year house built - Built 1990 to 1999 (%)
Year house built - Built 1980 to 1989 (%)
Year house built - Built 1970 to 1979 (%)
Year house built - Built 1960 to 1969 (%)
Year house built - Built 1950 to 1959 (%)
Year house built - Built 1940 to 1949 (%)
Year house built - Built 1939 or earlier (%)
Average household size
Household density (households per square mile)
Average household size - White
Average household size - Black or African American
Average household size - Asian
Average household size - Hispanic or Latino
Average household size - American Indian and Alaska Native
Average household size - Multirace
Average household size - Other Race
Occupied housing units (%)
Vacant housing units (%)
Owner occupied housing units (%)
Renter occupied housing units (%)
Vacancy status - For rent (%)
Vacancy status - For sale only (%)
Vacancy status - Rented or sold, not occupied (%)
Vacancy status - For seasonal, recreational, or occasional use (%)
Vacancy status - For migrant workers (%)
Vacancy status - Other vacant (%)
Residents with income below the poverty level (%)
Residents with income below 50% of the poverty level (%)
Children below poverty level (%)
Poor families by family type - Married-couple family (%)
Poor families by family type - Male, no wife present (%)
Poor families by family type - Female, no husband present (%)
Poverty status for native-born residents (%)
Poverty status for foreign-born residents (%)
Poverty among high school graduates not in families (%)
Poverty among people who did not graduate high school not in families (%)
Residents with income below the poverty level (%) - White
Residents with income below the poverty level (%) - Black or African American
Residents with income below the poverty level (%) - Asian
Residents with income below the poverty level (%) - Hispanic or Latino
Residents with income below the poverty level (%) - American Indian and Alaska Native
Residents with income below the poverty level (%) - Multirace
Residents with income below the poverty level (%) - Other Race
Air pollution - Air Quality Index (AQI)
Air pollution - CO
Air pollution - NO2
Air pollution - SO2
Air pollution - Ozone
Air pollution - PM10
Air pollution - PM25
Air pollution - Pb
Crime - Murders per 100,000 population
Crime - Rapes per 100,000 population
Crime - Robberies per 100,000 population
Crime - Assaults per 100,000 population
Crime - Burglaries per 100,000 population
Crime - Thefts per 100,000 population
Crime - Auto thefts per 100,000 population
Crime - Arson per 100,000 population
Crime - City-data.com crime index
Crime - Violent crime index
Crime - Property crime index
Crime - Murders per 100,000 population (5 year average)
Crime - Rapes per 100,000 population (5 year average)
Crime - Robberies per 100,000 population (5 year average)
Crime - Assaults per 100,000 population (5 year average)
Crime - Burglaries per 100,000 population (5 year average)
Crime - Thefts per 100,000 population (5 year average)
Crime - Auto thefts per 100,000 population (5 year average)
Crime - Arson per 100,000 population (5 year average)
Crime - City-data.com crime index (5 year average)
Crime - Violent crime index (5 year average)
Crime - Property crime index (5 year average)
1996 Presidential Elections Results (%) - Democratic Party (Clinton)
1996 Presidential Elections Results (%) - Republican Party (Dole)
1996 Presidential Elections Results (%) - Other
2000 Presidential Elections Results (%) - Democratic Party (Gore)
2000 Presidential Elections Results (%) - Republican Party (Bush)
2000 Presidential Elections Results (%) - Other
2004 Presidential Elections Results (%) - Democratic Party (Kerry)
2004 Presidential Elections Results (%) - Republican Party (Bush)
2004 Presidential Elections Results (%) - Other
2008 Presidential Elections Results (%) - Democratic Party (Obama)
2008 Presidential Elections Results (%) - Republican Party (McCain)
2008 Presidential Elections Results (%) - Other
2012 Presidential Elections Results (%) - Democratic Party (Obama)
2012 Presidential Elections Results (%) - Republican Party (Romney)
2012 Presidential Elections Results (%) - Other
2016 Presidential Elections Results (%) - Democratic Party (Clinton)
2016 Presidential Elections Results (%) - Republican Party (Trump)
2016 Presidential Elections Results (%) - Other
2020 Presidential Elections Results (%) - Democratic Party (Biden)
2020 Presidential Elections Results (%) - Republican Party (Trump)
2020 Presidential Elections Results (%) - Other
Ancestries Reported - Arab (%)
Ancestries Reported - Czech (%)
Ancestries Reported - Danish (%)
Ancestries Reported - Dutch (%)
Ancestries Reported - English (%)
Ancestries Reported - French (%)
Ancestries Reported - French Canadian (%)
Ancestries Reported - German (%)
Ancestries Reported - Greek (%)
Ancestries Reported - Hungarian (%)
Ancestries Reported - Irish (%)
Ancestries Reported - Italian (%)
Ancestries Reported - Lithuanian (%)
Ancestries Reported - Norwegian (%)
Ancestries Reported - Polish (%)
Ancestries Reported - Portuguese (%)
Ancestries Reported - Russian (%)
Ancestries Reported - Scotch-Irish (%)
Ancestries Reported - Scottish (%)
Ancestries Reported - Slovak (%)
Ancestries Reported - Subsaharan African (%)
Ancestries Reported - Swedish (%)
Ancestries Reported - Swiss (%)
Ancestries Reported - Ukrainian (%)
Ancestries Reported - United States (%)
Ancestries Reported - Welsh (%)
Ancestries Reported - West Indian (%)
Ancestries Reported - Other (%)
Educational Attainment - No schooling completed (%)
Educational Attainment - Less than high school (%)
Educational Attainment - High school or equivalent (%)
Educational Attainment - Less than 1 year of college (%)
Educational Attainment - 1 or more years of college (%)
Educational Attainment - Associate degree (%)
Educational Attainment - Bachelor's degree (%)
Educational Attainment - Master's degree (%)
Educational Attainment - Professional school degree (%)
Educational Attainment - Doctorate degree (%)
School Enrollment - Nursery, preschool (%)
School Enrollment - Kindergarten (%)
School Enrollment - Grade 1 to 4 (%)
School Enrollment - Grade 5 to 8 (%)
School Enrollment - Grade 9 to 12 (%)
School Enrollment - College undergrad (%)
School Enrollment - Graduate or professional (%)
School Enrollment - Not enrolled in school (%)
School enrollment - Public schools (%)
School enrollment - Private schools (%)
School enrollment - Not enrolled (%)
Median number of rooms in houses and condos
Median number of rooms in apartments
Housing units lacking complete plumbing facilities (%)
Housing units lacking complete kitchen facilities (%)
Density of houses
Urban houses (%)
Rural houses (%)
Households with people 60 years and over (%)
Households with people 65 years and over (%)
Households with people 75 years and over (%)
Households with one or more nonrelatives (%)
Households with no nonrelatives (%)
Population in households (%)
Family households (%)
Nonfamily households (%)
Population in families (%)
Family households with own children (%)
Median number of bedrooms in owner occupied houses
Mean number of bedrooms in owner occupied houses
Median number of bedrooms in renter occupied houses
Mean number of bedrooms in renter occupied houses
Median number of vehichles in owner occupied houses
Mean number of vehichles in owner occupied houses
Median number of vehichles in renter occupied houses
Mean number of vehichles in renter occupied houses
Mortgage status - with mortgage (%)
Mortgage status - with second mortgage (%)
Mortgage status - with home equity loan (%)
Mortgage status - with both second mortgage and home equity loan (%)
Mortgage status - without a mortgage (%)
Average family size
Average family size - White
Average family size - Black or African American
Average family size - Asian
Average family size - Hispanic or Latino
Average family size - American Indian and Alaska Native
Average family size - Multirace
Average family size - Other Race
Geographical mobility - Same house 1 year ago (%)
Geographical mobility - Moved within same county (%)
Geographical mobility - Moved from different county within same state (%)
Geographical mobility - Moved from different state (%)
Geographical mobility - Moved from abroad (%)
Place of birth - Born in state of residence (%)
Place of birth - Born in other state (%)
Place of birth - Native, outside of US (%)
Place of birth - Foreign born (%)
Housing units in structures - 1, detached (%)
Housing units in structures - 1, attached (%)
Housing units in structures - 2 (%)
Housing units in structures - 3 or 4 (%)
Housing units in structures - 5 to 9 (%)
Housing units in structures - 10 to 19 (%)
Housing units in structures - 20 to 49 (%)
Housing units in structures - 50 or more (%)
Housing units in structures - Mobile home (%)
Housing units in structures - Boat, RV, van, etc. (%)
House/condo owner moved in on average (years ago)
Renter moved in on average (years ago)
Year householder moved into unit - Moved in 1999 to March 2000 (%)
Year householder moved into unit - Moved in 1995 to 1998 (%)
Year householder moved into unit - Moved in 1990 to 1994 (%)
Year householder moved into unit - Moved in 1980 to 1989 (%)
Year householder moved into unit - Moved in 1970 to 1979 (%)
Year householder moved into unit - Moved in 1969 or earlier (%)
Means of transportation to work - Drove car alone (%)
Means of transportation to work - Carpooled (%)
Means of transportation to work - Public transportation (%)
Means of transportation to work - Bus or trolley bus (%)
Means of transportation to work - Streetcar or trolley car (%)
Means of transportation to work - Subway or elevated (%)
Means of transportation to work - Railroad (%)
Means of transportation to work - Ferryboat (%)
Means of transportation to work - Taxicab (%)
Means of transportation to work - Motorcycle (%)
Means of transportation to work - Bicycle (%)
Means of transportation to work - Walked (%)
Means of transportation to work - Other means (%)
Working at home (%)
Industry diversity
Most Common Industries - Agriculture, forestry, fishing and hunting, and mining (%)
Most Common Industries - Agriculture, forestry, fishing and hunting (%)
Most Common Industries - Mining, quarrying, and oil and gas extraction (%)
Most Common Industries - Construction (%)
Most Common Industries - Manufacturing (%)
Most Common Industries - Wholesale trade (%)
Most Common Industries - Retail trade (%)
Most Common Industries - Transportation and warehousing, and utilities (%)
Most Common Industries - Transportation and warehousing (%)
Most Common Industries - Utilities (%)
Most Common Industries - Information (%)
Most Common Industries - Finance and insurance, and real estate and rental and leasing (%)
Most Common Industries - Finance and insurance (%)
Most Common Industries - Real estate and rental and leasing (%)
Most Common Industries - Professional, scientific, and management, and administrative and waste management services (%)
Most Common Industries - Professional, scientific, and technical services (%)
Most Common Industries - Management of companies and enterprises (%)
Most Common Industries - Administrative and support and waste management services (%)
Most Common Industries - Educational services, and health care and social assistance (%)
Most Common Industries - Educational services (%)
Most Common Industries - Health care and social assistance (%)
Most Common Industries - Arts, entertainment, and recreation, and accommodation and food services (%)
Most Common Industries - Arts, entertainment, and recreation (%)
Most Common Industries - Accommodation and food services (%)
Most Common Industries - Other services, except public administration (%)
Most Common Industries - Public administration (%)
Occupation diversity
Most Common Occupations - Management, business, science, and arts occupations (%)
Most Common Occupations - Management, business, and financial occupations (%)
Most Common Occupations - Management occupations (%)
Most Common Occupations - Business and financial operations occupations (%)
Most Common Occupations - Computer, engineering, and science occupations (%)
Most Common Occupations - Computer and mathematical occupations (%)
Most Common Occupations - Architecture and engineering occupations (%)
Most Common Occupations - Life, physical, and social science occupations (%)
Most Common Occupations - Education, legal, community service, arts, and media occupations (%)
Most Common Occupations - Community and social service occupations (%)
Most Common Occupations - Legal occupations (%)
Most Common Occupations - Education, training, and library occupations (%)
Most Common Occupations - Arts, design, entertainment, sports, and media occupations (%)
Most Common Occupations - Healthcare practitioners and technical occupations (%)
Most Common Occupations - Health diagnosing and treating practitioners and other technical occupations (%)
Most Common Occupations - Health technologists and technicians (%)
Most Common Occupations - Service occupations (%)
Most Common Occupations - Healthcare support occupations (%)
Most Common Occupations - Protective service occupations (%)
Most Common Occupations - Fire fighting and prevention, and other protective service workers including supervisors (%)
Most Common Occupations - Law enforcement workers including supervisors (%)
Most Common Occupations - Food preparation and serving related occupations (%)
Most Common Occupations - Building and grounds cleaning and maintenance occupations (%)
Most Common Occupations - Personal care and service occupations (%)
Most Common Occupations - Sales and office occupations (%)
Most Common Occupations - Sales and related occupations (%)
Most Common Occupations - Office and administrative support occupations (%)
Most Common Occupations - Natural resources, construction, and maintenance occupations (%)
Most Common Occupations - Farming, fishing, and forestry occupations (%)
Most Common Occupations - Construction and extraction occupations (%)
Most Common Occupations - Installation, maintenance, and repair occupations (%)
Most Common Occupations - Production, transportation, and material moving occupations (%)
Most Common Occupations - Production occupations (%)
Most Common Occupations - Transportation occupations (%)
Most Common Occupations - Material moving occupations (%)
People in Group quarters - Institutionalized population (%)
People in Group quarters - Correctional institutions (%)
People in Group quarters - Federal prisons and detention centers (%)
People in Group quarters - Halfway houses (%)
People in Group quarters - Local jails and other confinement facilities (including police lockups) (%)
People in Group quarters - Military disciplinary barracks (%)
People in Group quarters - State prisons (%)
People in Group quarters - Other types of correctional institutions (%)
People in Group quarters - Nursing homes (%)
People in Group quarters - Hospitals/wards, hospices, and schools for the handicapped (%)
People in Group quarters - Hospitals/wards and hospices for chronically ill (%)
People in Group quarters - Hospices or homes for chronically ill (%)
People in Group quarters - Military hospitals or wards for chronically ill (%)
People in Group quarters - Other hospitals or wards for chronically ill (%)
People in Group quarters - Hospitals or wards for drug/alcohol abuse (%)
People in Group quarters - Mental (Psychiatric) hospitals or wards (%)
People in Group quarters - Schools, hospitals, or wards for the mentally retarded (%)
People in Group quarters - Schools, hospitals, or wards for the physically handicapped (%)
People in Group quarters - Institutions for the deaf (%)
People in Group quarters - Institutions for the blind (%)
People in Group quarters - Orthopedic wards and institutions for the physically handicapped (%)
People in Group quarters - Wards in general hospitals for patients who have no usual home elsewhere (%)
People in Group quarters - Wards in military hospitals for patients who have no usual home elsewhere (%)
People in Group quarters - Juvenile institutions (%)
People in Group quarters - Long-term care (%)
People in Group quarters - Homes for abused, dependent, and neglected children (%)
People in Group quarters - Residential treatment centers for emotionally disturbed children (%)
People in Group quarters - Training schools for juvenile delinquents (%)
People in Group quarters - Short-term care, detention or diagnostic centers for delinquent children (%)
People in Group quarters - Type of juvenile institution unknown (%)
People in Group quarters - Noninstitutionalized population (%)
People in Group quarters - College dormitories (includes college quarters off campus) (%)
People in Group quarters - Military quarters (%)
People in Group quarters - On base (%)
People in Group quarters - Barracks, unaccompanied personnel housing (UPH), (Enlisted/Officer), ;and similar group living quarters for military personnel (%)
People in Group quarters - Transient quarters for temporary residents (%)
People in Group quarters - Military ships (%)
People in Group quarters - Group homes (%)
People in Group quarters - Homes or halfway houses for drug/alcohol abuse (%)
People in Group quarters - Homes for the mentally ill (%)
People in Group quarters - Homes for the mentally retarded (%)
People in Group quarters - Homes for the physically handicapped (%)
People in Group quarters - Other group homes (%)
People in Group quarters - Religious group quarters (%)
People in Group quarters - Dormitories (%)
People in Group quarters - Agriculture workers' dormitories on farms (%)
People in Group quarters - Job Corps and vocational training facilities (%)
People in Group quarters - Other workers' dormitories (%)
People in Group quarters - Crews of maritime vessels (%)
People in Group quarters - Other nonhousehold living situations (%)
People in Group quarters - Other noninstitutional group quarters (%)
Residents speaking English at home (%)
Residents speaking English at home - Born in the United States (%)
Residents speaking English at home - Native, born elsewhere (%)
Residents speaking English at home - Foreign born (%)
Residents speaking Spanish at home (%)
Residents speaking Spanish at home - Born in the United States (%)
Residents speaking Spanish at home - Native, born elsewhere (%)
Residents speaking Spanish at home - Foreign born (%)
Residents speaking other language at home (%)
Residents speaking other language at home - Born in the United States (%)
Residents speaking other language at home - Native, born elsewhere (%)
Residents speaking other language at home - Foreign born (%)
Class of Workers - Employee of private company (%)
Class of Workers - Self-employed in own incorporated business (%)
Class of Workers - Private not-for-profit wage and salary workers (%)
Class of Workers - Local government workers (%)
Class of Workers - State government workers (%)
Class of Workers - Federal government workers (%)
Class of Workers - Self-employed workers in own not incorporated business and Unpaid family workers (%)
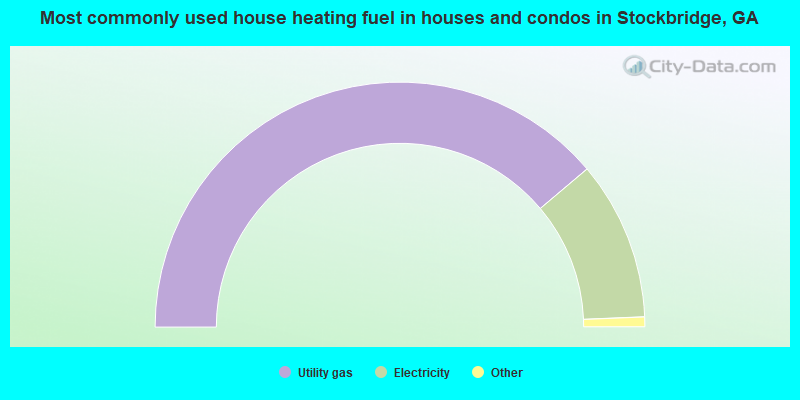
House heating fuel used in houses and condos - Utility gas (%)
House heating fuel used in houses and condos - Bottled, tank, or LP gas (%)
House heating fuel used in houses and condos - Electricity (%)
House heating fuel used in houses and condos - Fuel oil, kerosene, etc. (%)
House heating fuel used in houses and condos - Coal or coke (%)
House heating fuel used in houses and condos - Wood (%)
House heating fuel used in houses and condos - Solar energy (%)
House heating fuel used in houses and condos - Other fuel (%)
House heating fuel used in houses and condos - No fuel used (%)
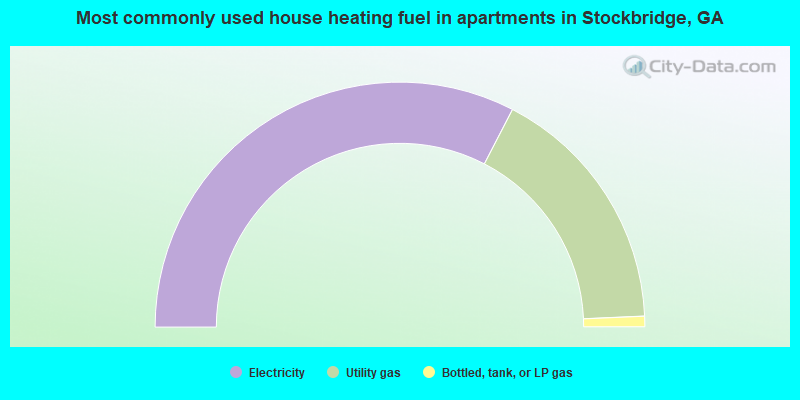
House heating fuel used in apartments - Utility gas (%)
House heating fuel used in apartments - Bottled, tank, or LP gas (%)
House heating fuel used in apartments - Electricity (%)
House heating fuel used in apartments - Fuel oil, kerosene, etc. (%)
House heating fuel used in apartments - Coal or coke (%)
House heating fuel used in apartments - Wood (%)
House heating fuel used in apartments - Solar energy (%)
House heating fuel used in apartments - Other fuel (%)
House heating fuel used in apartments - No fuel used (%)
Armed forces status - In Armed Forces (%)
Armed forces status - Civilian (%)
Armed forces status - Civilian - Veteran (%)
Armed forces status - Civilian - Nonveteran (%)
Fatal accidents locations in years 2005-2021
Fatal accidents locations in 2005
Fatal accidents locations in 2006
Fatal accidents locations in 2007
Fatal accidents locations in 2008
Fatal accidents locations in 2009
Fatal accidents locations in 2010
Fatal accidents locations in 2011
Fatal accidents locations in 2012
Fatal accidents locations in 2013
Fatal accidents locations in 2014
Fatal accidents locations in 2015
Fatal accidents locations in 2016
Fatal accidents locations in 2017
Fatal accidents locations in 2018
Fatal accidents locations in 2019
Fatal accidents locations in 2020
Fatal accidents locations in 2021
Alcohol use - People drinking some alcohol every month (%)
Alcohol use - People not drinking at all (%)
Alcohol use - Average days/month drinking alcohol
Alcohol use - Average drinks/week
Alcohol use - Average days/year people drink much
Audiometry - Average condition of hearing (%)
Audiometry - People that can hear a whisper from across a quiet room (%)
Audiometry - People that can hear normal voice from across a quiet room (%)
Audiometry - Ears ringing, roaring, buzzing (%)
Audiometry - Had a job exposure to loud noise (%)
Audiometry - Had off-work exposure to loud noise (%)
Blood Pressure & Cholesterol - Has high blood pressure (%)
Blood Pressure & Cholesterol - Checking blood pressure at home (%)
Blood Pressure & Cholesterol - Frequently checking blood cholesterol (%)
Blood Pressure & Cholesterol - Has high cholesterol level (%)
Consumer Behavior - Money monthly spent on food at supermarket/grocery store
Consumer Behavior - Money monthly spent on food at other stores
Consumer Behavior - Money monthly spent on eating out
Consumer Behavior - Money monthly spent on carryout/delivered foods
Consumer Behavior - Income spent on food at supermarket/grocery store (%)
Consumer Behavior - Income spent on food at other stores (%)
Consumer Behavior - Income spent on eating out (%)
Consumer Behavior - Income spent on carryout/delivered foods (%)
Current Health Status - General health condition (%)
Current Health Status - Blood donors (%)
Current Health Status - Has blood ever tested for HIV virus (%)
Current Health Status - Left-handed people (%)
Dermatology - People using sunscreen (%)
Diabetes - Diabetics (%)
Diabetes - Had a blood test for high blood sugar (%)
Diabetes - People taking insulin (%)
Diet Behavior & Nutrition - Diet health (%)
Diet Behavior & Nutrition - Milk product consumption (# of products/month)
Diet Behavior & Nutrition - Meals not home prepared (#/week)
Diet Behavior & Nutrition - Meals from fast food or pizza place (#/week)
Diet Behavior & Nutrition - Ready-to-eat foods (#/month)
Diet Behavior & Nutrition - Frozen meals/pizza (#/month)
Drug Use - People that ever used marijuana or hashish (%)
Drug Use - Ever used hard drugs (%)
Drug Use - Ever used any form of cocaine (%)
Drug Use - Ever used heroin (%)
Drug Use - Ever used methamphetamine (%)
Health Insurance - People covered by health insurance (%)
Kidney Conditions-Urology - Avg. # of times urinating at night
Medical Conditions - People with asthma (%)
Medical Conditions - People with anemia (%)
Medical Conditions - People with psoriasis (%)
Medical Conditions - People with overweight (%)
Medical Conditions - Elderly people having difficulties in thinking or remembering (%)
Medical Conditions - People who ever received blood transfusion (%)
Medical Conditions - People having trouble seeing even with glass/contacts (%)
Medical Conditions - People with arthritis (%)
Medical Conditions - People with gout (%)
Medical Conditions - People with congestive heart failure (%)
Medical Conditions - People with coronary heart disease (%)
Medical Conditions - People with angina pectoris (%)
Medical Conditions - People who ever had heart attack (%)
Medical Conditions - People who ever had stroke (%)
Medical Conditions - People with emphysema (%)
Medical Conditions - People with thyroid problem (%)
Medical Conditions - People with chronic bronchitis (%)
Medical Conditions - People with any liver condition (%)
Medical Conditions - People who ever had cancer or malignancy (%)
Mental Health - People who have little interest in doing things (%)
Mental Health - People feeling down, depressed, or hopeless (%)
Mental Health - People who have trouble sleeping or sleeping too much (%)
Mental Health - People feeling tired or having little energy (%)
Mental Health - People with poor appetite or overeating (%)
Mental Health - People feeling bad about themself (%)
Mental Health - People who have trouble concentrating on things (%)
Mental Health - People moving or speaking slowly or too fast (%)
Mental Health - People having thoughts they would be better off dead (%)
Oral Health - Average years since last visit a dentist
Oral Health - People embarrassed because of mouth (%)
Oral Health - People with gum disease (%)
Oral Health - General health of teeth and gums (%)
Oral Health - Average days a week using dental floss/device
Oral Health - Average days a week using mouthwash for dental problem
Oral Health - Average number of teeth
Pesticide Use - Households using pesticides to control insects (%)
Pesticide Use - Households using pesticides to kill weeds (%)
Physical Activity - People doing vigorous-intensity work activities (%)
Physical Activity - People doing moderate-intensity work activities (%)
Physical Activity - People walking or bicycling (%)
Physical Activity - People doing vigorous-intensity recreational activities (%)
Physical Activity - People doing moderate-intensity recreational activities (%)
Physical Activity - Average hours a day doing sedentary activities
Physical Activity - Average hours a day watching TV or videos
Physical Activity - Average hours a day using computer
Physical Functioning - People having limitations keeping them from working (%)
Physical Functioning - People limited in amount of work they can do (%)
Physical Functioning - People that need special equipment to walk (%)
Physical Functioning - People experiencing confusion/memory problems (%)
Physical Functioning - People requiring special healthcare equipment (%)
Prescription Medications - Average number of prescription medicines taking
Preventive Aspirin Use - Adults 40+ taking low-dose aspirin (%)
Reproductive Health - Vaginal deliveries (%)
Reproductive Health - Cesarean deliveries (%)
Reproductive Health - Deliveries resulted in a live birth (%)
Reproductive Health - Pregnancies resulted in a delivery (%)
Reproductive Health - Women breastfeeding newborns (%)
Reproductive Health - Women that had a hysterectomy (%)
Reproductive Health - Women that had both ovaries removed (%)
Reproductive Health - Women that have ever taken birth control pills (%)
Reproductive Health - Women taking birth control pills (%)
Reproductive Health - Women that have ever used Depo-Provera or injectables (%)
Reproductive Health - Women that have ever used female hormones (%)
Sexual Behavior - People 18+ that ever had sex (vaginal, anal, or oral) (%)
Sexual Behavior - Males 18+ that ever had vaginal sex with a woman (%)
Sexual Behavior - Males 18+ that ever performed oral sex on a woman (%)
Sexual Behavior - Males 18+ that ever had anal sex with a woman (%)
Sexual Behavior - Males 18+ that ever had any sex with a man (%)
Sexual Behavior - Females 18+ that ever had vaginal sex with a man (%)
Sexual Behavior - Females 18+ that ever performed oral sex on a man (%)
Sexual Behavior - Females 18+ that ever had anal sex with a man (%)
Sexual Behavior - Females 18+ that ever had any kind of sex with a woman (%)
Sexual Behavior - Average age people first had sex
Sexual Behavior - Average number of female sex partners in lifetime (males 18+)
Sexual Behavior - Average number of female vaginal sex partners in lifetime (males 18+)
Sexual Behavior - Average age people first performed oral sex on a woman (18+)
Sexual Behavior - Average number of woman performed oral sex on in lifetime (18+)
Sexual Behavior - Average number of male sex partners in lifetime (males 18+)
Sexual Behavior - Average number of male anal sex partners in lifetime (males 18+)
Sexual Behavior - Average age people first performed oral sex on a man (18+)
Sexual Behavior - Average number of male oral sex partners in lifetime (18+)
Sexual Behavior - People using protection when performing oral sex (%)
Sexual Behavior - Average number of times people have vaginal or anal sex a year
Sexual Behavior - People having sex without condom (%)
Sexual Behavior - Average number of male sex partners in lifetime (females 18+)
Sexual Behavior - Average number of male vaginal sex partners in lifetime (females 18+)
Sexual Behavior - Average number of female sex partners in lifetime (females 18+)
Sexual Behavior - Circumcised males 18+ (%)
Sleep Disorders - Average hours sleeping at night
Sleep Disorders - People that has trouble sleeping (%)
Smoking-Cigarette Use - People smoking cigarettes (%)
Taste & Smell - People 40+ having problems with smell (%)
Taste & Smell - People 40+ having problems with taste (%)
Taste & Smell - People 40+ that ever had wisdom teeth removed (%)
Taste & Smell - People 40+ that ever had tonsils teeth removed (%)
Taste & Smell - People 40+ that ever had a loss of consciousness because of a head injury (%)
Taste & Smell - People 40+ that ever had a broken nose or other serious injury to face or skull (%)
Taste & Smell - People 40+ that ever had two or more sinus infections (%)
Weight - Average height (inches)
Weight - Average weight (pounds)
Weight - Average BMI
Weight - People that are obese (%)
Weight - People that ever were obese (%)
Weight - People trying to lose weight (%)
Latest news from Stockbridge, GA collected exclusively by city-data.com from local newspapers, TV, and radio stations
Ancestries: African (3.5%), American (3.1%), Nigerian (2.0%), Guyanese (1.7%), Jamaican (1.1%), European (1.0%).
Current Local Time:
Land area: 10.9 square miles.
Population density: 2,655 people per square mile (average).
3,753 residents are foreign born (5.6% Asia , 4.0% Latin America , 1.9% Africa ).
This city:
12.6%Georgia:
10.4%
Median real estate property taxes paid for housing units with mortgages in 2022: $2,992 (1.0%)Median real estate property taxes paid for housing units with no mortgage in 2022: $2,378 (0.8%)
Nearest city with pop. 50,000+: Atlanta, GA
Nearest city with pop. 1,000,000+: Chicago, IL
Nearest cities:
Blacksville, GA (3.0 miles)
Latitude: 33.53 N, Longitude: 84.23 W
Daytime population change due to commuting: -1,156 (-3.9%)Workers who live and work in this city: 4,193 (26.3%)
Single-family new house construction building permits:
2022: 48 buildings , average cost: $241,3002021: 118 buildings , average cost: $237,0002020: 135 buildings , average cost: $239,7002019: 125 buildings , average cost: $294,8002018: 135 buildings , average cost: $309,400Unemployment in December 2023:
Most common occupations in Stockbridge, GA (%)
Both Males Females
Other office and administrative support workers, including supervisors (6.9%)
Other sales and related occupations, including supervisors (4.5%)
Retail sales workers, except cashiers (4.1%)
Driver/sales workers and truck drivers (4.1%)
Other management occupations, except farmers and farm managers (3.9%)
Secretaries and administrative assistants (3.9%)
Information and record clerks, except customer service representatives (3.0%)
Driver/sales workers and truck drivers (7.5%)
Retail sales workers, except cashiers (5.3%)
Other sales and related occupations, including supervisors (5.1%)
Other management occupations, except farmers and farm managers (4.8%)
Electrical equipment mechanics and other installation, maintenance, and repair workers, including supervisors (4.8%)
Other office and administrative support workers, including supervisors (3.8%)
Law enforcement workers, including supervisors (3.4%)
Other office and administrative support workers, including supervisors (10.2%)
Secretaries and administrative assistants (8.0%)
Preschool, kindergarten, elementary, and middle school teachers (5.2%)
Cashiers (4.9%)
Information and record clerks, except customer service representatives (4.5%)
Other sales and related occupations, including supervisors (3.9%)
Registered nurses (3.8%)
Tornado activity:
Stockbridge-area historical tornado activity is slightly above Georgia state average. It is 48% greater than the overall U.S. average.
On 1/10/1972, a category F3 (max. wind speeds 158-206 mph) tornado 12.1 miles away from the Stockbridge city center killed one person and injured 9 people and caused between $50,000 and $500,000 in damages.
On 11/22/1992, a category F4 (max. wind speeds 207-260 mph) tornado 36.7 miles away from the city center injured 46 people and caused between $5,000,000 and $50,000,000 in damages.
Earthquake activity:
Stockbridge-area historical earthquake activity is significantly above Georgia state average. It is 42% greater than the overall U.S. average. On 8/2/1974 at 08:52:09, a magnitude 4.9 (4.3 MB, 4.9 LG, Class: Light, Intensity: IV - V) earthquake occurred 103.0 miles away from Stockbridge center On 4/29/2003 at 08:59:39, a magnitude 4.9 (4.4 MB, 4.6 MW, 4.9 LG) earthquake occurred 104.1 miles away from the city center On 4/29/2003 at 08:59:39, a magnitude 4.6 (4.6 MW, Depth: 12.3 mi) earthquake occurred 104.1 miles away from Stockbridge center On 1/18/1999 at 07:00:53, a magnitude 4.8 (4.8 MB, 4.0 LG, Depth: 0.6 mi) earthquake occurred 174.7 miles away from the city center On 11/30/1973 at 07:48:41, a magnitude 4.7 (4.7 MB, 4.6 ML) earthquake occurred 157.4 miles away from Stockbridge center On 8/9/2020 at 12:07:37, a magnitude 5.1 (5.1 MW, Depth: 4.7 mi, Class: Moderate, Intensity: VI - VII) earthquake occurred 270.1 miles away from Stockbridge center Magnitude types: regional Lg-wave magnitude (LG), body-wave magnitude (MB), local magnitude (ML), moment magnitude (MW) Natural disasters: The number of natural disasters in Henry County (10) is smaller than the US average (15).Major Disasters (Presidential) Declared: 5Emergencies Declared: 4Floods: 4, Tornadoes: 4, Winter Storms: 3, Storms: 2, Drought: 1, Heavy Rain: 1, Hurricane: 1, Snowfall: 1, Tropical Storm: 1, Other: 1 (Note: some incidents may be assigned to more than one category). Main business address for: HENRY COUNTY BANCSHARES INC STATE COMMERCIAL BANKS ).
Hospitals and medical centers in Stockbridge: BRAWNER SOUTH MENTAL HEALTH SYSTEM (1000 EAGLE'S LANDING PARKWAY) PIEDMONT HENRY HOSPITAL (Government - Hospital District or Authority, provides emergency services, 1133 EAGLE'S LANDING PARKWAY) PROVIDENCE HOSPICE, INC (1550 ROCKQUARRY ROAD, SUITE B) LAUREL PARK AT HENRY MED CTR (1050 HOSPITAL DRIVE)
HENRY DIALYSIS CENTER (1365 ROCK QUARRY ROAD, ST 100)
NORTH HENRY DIALYSIS (5627 N HENRY BLVD SUITE I-1)
RAI CARE CENTERS OF STOCKBRIDGE (500 EAGLES LANDING PKWY)
STOCKBRIDGE DIALYSIS CLINIC,LLC (3580 CAMERON PARKWAY)
FIRST AMERICAN HOME CARE OF GA STKBRDG (100 EAGLE WALK SUITE B)
Colleges/universities with over 2000 students nearest to Stockbridge:
Clayton State University (about 7 miles; Morrow, GA ; Full-time enrollment: 5,844)
Georgia Perimeter College (about 11 miles; Decatur, GA ; FT enrollment: 17,138)
Atlanta Metropolitan State College (about 16 miles; Atlanta, GA ; FT enrollment: 2,437)
Atlanta Technical College (about 16 miles; Atlanta, GA ; FT enrollment: 4,217)
DeVry University-Georgia (about 18 miles; Decatur, GA ; FT enrollment: 4,157)
Georgia State University (about 18 miles; Atlanta, GA ; FT enrollment: 30,264)
Georgia Piedmont Technical College (about 18 miles; Clarkston, GA ; FT enrollment: 3,276)
Public high schools in Stockbridge:
Private high school in Stockbridge: COMMUNITY CHRISTIAN SCHOOL Students: 915, Location: 2001 JODECO RD, Grades: PK-12)
Biggest public elementary/middle schools in Stockbridge: GENERAL RAY DAVIS MIDDLE SCHOOL Students: 855, Location: 3375 E FAIRVIEW RD SW, Grades: 6-8)RED OAK ELEMENTARY SCHOOL Students: 830, Location: 175 MONARCH VILLAGE WAY, Grades: PK-5)STOCKBRIDGE ELEMENTARY SCHOOL Students: 798, Location: 4617 N HENRY BLVD, Grades: KG-3)AUSTIN ROAD MIDDLE SCHOOL Students: 774, Location: 100 AUSTIN RD, Grades: 6-8)LORRAINE ELEMENTARY SCHOOL Students: 740, Location: 3343 E FAIRVIEW RD SW, Grades: PK-5)PATE'S CREEK ELEMENTARY SCHOOL Students: 632, Location: 1309 JODECO RD, Grades: PK-5)PLEASANT GROVE ELEMENTARY SCHOOL Students: 578, Location: 150 REAGAN RD, Grades: PK-5)STOCKBRIDGE MIDDLE SCHOOL Students: 519, Location: 533 OLD CONYERS RD, Grades: 6-8)AUSTIN ROAD ELEMENTARY SCHOOL Students: 509, Location: 50 AUSTIN RD, Grades: KG-5)COTTON INDIAN ELEMENTARY SCHOOL Students: 391, Location: 1201 OLD CONYERS RD, Grades: PK-5)Private elementary/middle school in Stockbridge: AGAPE CHRISTIAN SCHOOL OF THE PERFORMING ARTS Students: 22, Location: 3887 WALT STEPHENS RD, Grades: PK-5)
See full list of schools located in Stockbridge
Notable locations in Stockbridge: (A) , Henry County Fire Department Station 9 (B) , Stockbridge City Hall (C) . Display/hide their locations on the map
Shopping Centers: (1) , Mays Corner Shopping Center (2) , Mays Crossing Shopping Center (3) . Display/hide their locations on the map
Main business address in Stockbridge: (A) . Display/hide its location on the map
Churches in Stockbridge include: (A) , Spivey Community Church (B) , Stockbridge United Methodist Church (C) , Stockbridge Presbyterian Chruch (D) . Display/hide their locations on the map
Reservoirs: (A) , Lion Country Lake (B) , W C Davis Lake (C) , Vulcan Materials Quarry Lake (D) , Askew Lakes-North Lake (E) , Minska Pinska Lake (F) . Display/hide their locations on the map
Creeks: (A) , Reeves Creek (B) , Pates Creek (C) . Display/hide their locations on the map
Park in Stockbridge: (1) . Display/hide its location on the map
Tourist attraction: (1) . Display/hide its approximate location on the map
Hotels: (1) , Days Inn Atl Stes Stockbridge (7385 Hannover Parkway North) (2) , Hampton Inn Atlanta-Stockbridge (7342 Hannover Parkway) (3) , Amerihost Inn Stockbridge GA (100 North Park Court) (4) , Best Western Atlanta South (619 Highway 138) (5) , Hampton Inn Stockbridge (7342 Hannover Parkway North) (6) . Display/hide their approximate locations on the map
Birthplace of: Lee H. Phillips - Marine Corps Medal of Honor recipient, Martin Luther King, Sr. - Religious leader, Max Gresham - Stock car racing driver, Ed Roland - Male singer, Joey Clanton - Stock car racing driver, Markel Humphrey - College basketball player (Marshall Thundering Herd), Phil McCullough - Baseball player, Ricky Sanders (racing driver) - Racing driver.
Henry County has a predicted average indoor radon screening level between 2 and 4 pCi/L (pico curies per liter) - Moderate Potential Average household size: This city:
2.7 peopleGeorgia:
2.6 people
Percentage of family households: This city:
68.8%Whole state:
68.5%
Percentage of households with unmarried partners: This city:
5.8%Whole state:
5.9%
Likely homosexual households (counted as self-reported same-sex unmarried-partner households)
Lesbian couples: 0.4% of all households Gay men: 0.3% of all households
8 people in group homes intended for adults in 2010people in other noninstitutional group quarters in 2000people in other nonhousehold living situations in 2000
Banks with most branches in Stockbridge (2011 data):
SunTrust Bank: Stockbridge Branch, Eagles Landing Branch, Eagles Landing North Branch. Info updated 2010/05/27: Bank assets: $171,291.7 mil, Deposits: $129,833.2 mil, headquarters in Atlanta, GA, positive income , Commercial Lending Specialization, 1716 total offices , Holding Company: Suntrust Banks, Inc.
Hamilton State Bank: The First State Bank Branch at 4806 North Henry Boulevard, branch established on 1964/10/08; Hudson Bridge Road Branch at 1810 Hudson Bridge Road, branch established on 1994/09/01. Info updated 2012/01/23: Bank assets: $909.1 mil, Deposits: $727.5 mil, headquarters in Hoschton, GA, positive income , Commercial Lending Specialization, 22 total offices , Holding Company: Hamilton State Bancshares, Inc.
Wells Fargo Bank, National Association: North Henry Branch at 5490 North Henry Boulevard, branch established on 1990/12/11; Eagles Landing Branch at 1925 Hudson Bridge Road, branch established on 2003/11/17. Info updated 2011/04/05: Bank assets: $1,161,490.0 mil, Deposits: $905,653.0 mil, headquarters in Sioux Falls, SD, positive income , 6395 total offices , Holding Company: Wells Fargo & Company
Bank of America, National Association: Stockbridge Branch at 5505 North Henry Boulevard, branch established on 1981/04/11; Hudson Bridge Branch at 1550 Hudson Bridge Road, branch established on 1998/04/30. Info updated 2009/11/18: Bank assets: $1,451,969.3 mil, Deposits: $1,077,176.8 mil, headquarters in Charlotte, NC, positive income , 5782 total offices , Holding Company: Bank Of America Corporation
Guaranty Bank: South Stockbridge Branch at 1400 Hudson Bridge Road, branch established on 2006/10/18. Info updated 2011/07/21: Bank assets: $1,179.1 mil, Deposits: $1,102.7 mil, headquarters in Milwaukee, WI, negative income in the last year , Mortgage Lending Specialization, 166 total offices
JPMorgan Chase Bank, National Association: Stockbridge Village Branch at 3604 Se Hwy 138, branch established on 2008/09/25. Info updated 2011/11/10: Bank assets: $1,811,678.0 mil, Deposits: $1,190,738.0 mil, headquarters in Columbus, OH, positive income , International Specialization, 5577 total offices , Holding Company: Jpmorgan Chase & Co.
Heritage Bank: Stockbridge Branch at 830 Eagles Landing Parkway, Suite 100, branch established on 2004/07/21. Info updated 2006/11/03: Bank assets: $367.1 mil, Deposits: $329.6 mil, headquarters in Jonesboro, GA, negative income in the last year , Commercial Lending Specialization, 7 total offices , Holding Company: Ccf Holding Company
United Community Bank: Eagle National Stockbridge Branch at 850 Eagle's Landing Parkway, branch established on 1997/12/02. Info updated 2009/06/23: Bank assets: $6,977.4 mil, Deposits: $6,170.1 mil, headquarters in Blairsville, GA, negative income in the last year , Commercial Lending Specialization, 106 total offices , Holding Company: United Community Banks, Inc.
Branch Banking and Trust Company: Stockbridge Branch at 991 Eagles Landing Parkway, branch established on 2005/05/23. Info updated 2010/03/29: Bank assets: $168,867.6 mil, Deposits: $127,549.5 mil, headquarters in Winston Salem, NC, positive income , Commercial Lending Specialization, 1793 total offices , Holding Company: Bb&T Corporation
3 other banks with 3 local branches
For population 15 years and over in Stockbridge:
Never married: 43.3%Now married: 39.1%Separated: 1.8%Widowed: 4.5%Divorced: 11.3% For population 25 years and over in Stockbridge:
High school or higher: 89.7%Bachelor's degree or higher: 29.1%Graduate or professional degree: 11.5%Unemployed: 4.2%Mean travel time to work (commute): 26.5 minutes
Education Gini index (Inequality in education) Here:
12.2Georgia average:
12.2
Religion statistics for Stockbridge, GA (based on Henry County data)
Religion Adherents Congregations Evangelical Protestant 51,021 117 Mainline Protestant 12,828 31 Catholic 3,766 1 Black Protestant 783 6 Other 755 3 None 134,769 -
Source: Clifford Grammich, Kirk Hadaway, Richard Houseal, Dale E.Jones, Alexei Krindatch, Richie Stanley and Richard H.Taylor. 2012. 2010 U.S.Religion Census: Religious Congregations & Membership Study. Association of Statisticians of American Religious Bodies. Jones, Dale E., et al. 2002. Congregations and Membership in the United States 2000. Nashville, TN: Glenmary Research Center. Graphs represent county-level data
Food Environment Statistics: Number of grocery stores : 26Henry County :
1.40 / 10,000 pop.Georgia :
1.91 / 10,000 pop.
Number of supercenters and club stores : 5Henry County :
0.27 / 10,000 pop.State :
0.15 / 10,000 pop.
Number of convenience stores (no gas) : 7Henry County :
0.38 / 10,000 pop.State :
0.86 / 10,000 pop.
Number of convenience stores (with gas) : 91This county :
4.91 / 10,000 pop.State :
5.12 / 10,000 pop.
Number of full-service restaurants : 112Henry County :
6.04 / 10,000 pop.Georgia :
7.41 / 10,000 pop.
Adult diabetes rate : This county :
9.9%Georgia :
10.4%
Adult obesity rate : Henry County :
30.8%Georgia :
27.8%
Low-income preschool obesity rate : This county :
11.9%Georgia :
14.6%
Health and Nutrition: Healthy diet rate : Stockbridge:
50.0%Georgia:
48.9%
Average overall health of teeth and gums : Stockbridge:
48.3%Georgia:
46.5%
Average BMI : Stockbridge:
28.7Georgia:
28.9
People feeling badly about themselves : People not drinking alcohol at all : This city:
11.0%Georgia:
10.8%
Average hours sleeping at night : Stockbridge:
6.8Georgia:
6.7
Overweight people : Stockbridge:
32.4%Georgia:
33.5%
General health condition : This city:
58.1%State:
56.2%
Average condition of hearing : Stockbridge:
82.1%Georgia:
80.8%
More about Health and Nutrition of Stockbridge, GA Residents
Local government employment and payroll (March 2022)
Function
Full-time employees
Monthly full-time payroll
Average yearly full-time wage
Part-time employees
Monthly part-time payroll
Other Government Administration
29 $162,852 $67,387 6 $6,200 Parks and Recreation
14 $52,735 $45,201 0 $0 Financial Administration
14 $67,177 $57,580 0 $0 Water Supply
11 $49,104 $53,568 0 $0 Sewerage
9 $44,509 $59,345 0 $0 Police Protection - Officers
5 $20,453 $49,087 0 $0 Judicial and Legal
2 $8,890 $53,340 1 $400
Totals for Government
84 $405,721 $57,960 7 $6,600
Stockbridge government finances - Expenditure in 2018 (per resident):
Construction - General Public Buildings: $223,000 ($7.67)
Current Operations - Regular Highways: $1,841,000 ($63.34)
Sewerage: $1,731,000 ($59.56)General - Other: $1,644,000 ($56.56)Water Utilities: $1,577,000 ($54.26)Solid Waste Management: $1,256,000 ($43.21)Financial Administration: $1,194,000 ($41.08)Central Staff Services: $885,000 ($30.45)Judicial and Legal Services: $605,000 ($20.82)Parks and Recreation: $220,000 ($7.57)Police Protection: $161,000 ($5.54)General Public Buildings: $54,000 ($1.86)General - Interest on Debt: $653,000 ($22.47)
Intergovernmental to Local - Other - Water Utilities: $590,000 ($20.30)
Other - Solid Waste Management: $292,000 ($10.05)Other - Correctional Institutions: $4,000 ($0.14)Other Capital Outlay - General Public Building: $392,000 ($13.49)
Parks and Recreation: $385,000 ($13.25)Regular Highways: $364,000 ($12.52)Central Staff Services: $28,000 ($0.96)Water Utilities - Interest on Debt: $21,000 ($0.72)
Stockbridge government finances - Revenue in 2018 (per resident):
Charges - Sewerage: $2,921,000 ($100.50)
Solid Waste Management: $1,237,000 ($42.56)Other: $27,000 ($0.93)Local Intergovernmental - General Local Government Support: $3,888,000 ($133.77)
Other: $2,519,000 ($86.67)Miscellaneous - Rents: $108,000 ($3.72)
Fines and Forfeits: $69,000 ($2.37)Interest Earnings: $2,000 ($0.07)General Revenue - Other: $1,000 ($0.03)Revenue - Water Utilities: $1,170,000 ($40.26)
State Intergovernmental - Other: $240,000 ($8.26)
General Local Government Support: $80,000 ($2.75)Tax - Insurance Premiums Sales: $1,751,000 ($60.25)
Public Utilities Sales: $1,419,000 ($48.82)Alcoholic Beverage Sales: $726,000 ($24.98)Occupation and Business License - Other: $577,000 ($19.85)Other Selective Sales: $445,000 ($15.31)Alcoholic Beverage License: $183,000 ($6.30)Property: $127,000 ($4.37)Other: $97,000 ($3.34)Other License: $55,000 ($1.89)
Stockbridge government finances - Debt in 2018 (per resident):
Long Term Debt - Beginning Outstanding - Unspecified Public Purpose: $14,540,000 ($500.28)
Outstanding Unspecified Public Purpose: $13,832,000 ($475.92)Retired Unspecified Public Purpose: $708,000 ($24.36)
Stockbridge government finances - Cash and Securities in 2018 (per resident):
Bond Funds - Cash and Securities: $6,083,000 ($209.30)
Other Funds - Cash and Securities: $33,313,000 ($1146.19)
11.91% of this county's 2021 resident taxpayers lived in other counties in 2020 ($45,812 average adjusted gross income )
Here:
11.91%Georgia average:
10.21%
0.03% of residents moved from foreign countries ($151 average AGI )Henry County:
0.03%Georgia average:
0.04%
Top counties from which taxpayers relocated into this county between 2020 and 2021:
10.82% of this county's 2020 resident taxpayers moved to other counties in 2021 ($52,079 average adjusted gross income )
Here:
10.82%Georgia average:
9.60%
0.02% of residents moved to foreign countries ($137 average AGI )Henry County:
0.02%Georgia average:
0.03%
Top counties to which taxpayers relocated from this county between 2020 and 2021:
Businesses in Stockbridge, GA
Name Count Name Count
ALDI 1 Lowe's 1 AT&T 2 McDonald's 2 Advance Auto Parts 1 Microtel 1 Applebee's 1 Motel 6 1 Arby's 2 Nike 1 AutoZone 1 Office Depot 1 Baymont Inn 1 Outback 1 Blockbuster 2 Outback Steakhouse 1 Burger King 1 Payless 1 CVS 2 Penske 1 CarMax 1 Pizza Hut 1 Chick-Fil-A 2 Popeyes 1 Church's Chicken 1 Publix Super Markets 2 Comfort Suites 1 Quality 1 Curves 1 Quiznos 2 DHL 2 RadioShack 1 Dairy Queen 2 Red Roof Inn 1 Days Inn 1 Rite Aid 1 Discount Tire 1 Ryan's Grill 1 Domino's Pizza 1 SONIC Drive-In 1 Dunkin Donuts 1 Sleep Inn 1 Econo Lodge 1 Sprint Nextel 1 FedEx 9 Starbucks 1 GameStop 2 Suburban 1 H&R Block 3 Subway 3 Hilton 1 Super 8 1 Holiday Inn 1 T-Mobile 4 Howard Johnson 1 Taco Bell 2 IHOP 1 The Room Place 1 Jones New York 2 U-Haul 2 KFC 2 UPS 13 Kohl's 1 Waffle House 5 Kroger 2 Walgreens 2 La Quinta 1 Walmart 2 Little Caesars Pizza 1
Strongest AM radio stations in Stockbridge:
WGUN (1010 AM; 50 kW; ATLANTA, GA; Owner: WGUN, INC.)
WGST (640 AM; 50 kW; ATLANTA, GA; Owner: CITICASTERS LICENSES, L.P.)
WSB (750 AM; 50 kW; ATLANTA, GA; Owner: CXR HOLDINGS, INC.)
WAOK (1380 AM; 50 kW; ATLANTA, GA; Owner: INFINITY BROADCASTING OPERATIONS, INC.)
WQXI (790 AM; 28 kW; ATLANTA, GA; Owner: JEFFERSON-PILOT COMMUNICATIONS COMPANY OF GEORGIA)
WCNN (680 AM; 50 kW; NORTH ATLANTA, GA; Owner: DICKEY BROADCASTING COMPANY)
WSSA (1570 AM; 5 kW; MORROW, GA; Owner: SOUTH ATLANTA BROACASTING, INC.)
WGKA (1190 AM; 25 kW; ATLANTA, GA; Owner: SALEM MEDIA OF GEORGIA, INC.)
WMLB (1160 AM; 50 kW; EAST POINT, GA; Owner: ATLANTA AREA BROADCASTING, INC.)
WPBS (1050 AM; 12 kW; CONYERS, GA; Owner: MIDWAY HOLINESS CHURCH, INC,)
WAZX (1550 AM; 50 kW; SMYRNA, GA; Owner: GA-MEX BROADCASTING, INC.)
WAEC (860 AM; 5 kW; ATLANTA, GA; Owner: WAEC LICENSE LIMITED PARTNERSHIP)
WFTD (1080 AM; daytime; 50 kW; MARIETTA, GA; Owner: PRIETO ENTERPRISES, INC.)
Strongest FM radio stations in Stockbridge:
WSB-FM (98.5 FM; ATLANTA, GA; Owner: CXR HOLDINGS, INC.)
WZGC (92.9 FM; ATLANTA, GA; Owner: INFINITY BROADCASTING CORP. OF ATLANTA)
WSTR (94.1 FM; SMYRNA, GA; Owner: JEFFERSON-PILOT COMMUNICATIONS COMPANY OF GEORGIA)
WVEE (103.3 FM; ATLANTA, GA; Owner: INFINITY BROADCASTING OPERATIONS, INC.)
WWWQ (100.5 FM; ANNISTON, AL; Owner: WNNX LICO, INC.)
WNNX (99.7 FM; ATLANTA, GA; Owner: WNNX LICO, INC.)
WRFG (89.3 FM; ATLANTA, GA; Owner: RADIO FREE GEORGIA BROADCASTING FOUNDATION INC)
WKHX-FM (101.5 FM; MARIETTA, GA; Owner: ABC, INC.)
WABE (90.1 FM; ATLANTA, GA; Owner: BOARD OF EDUCATION, CITY OF ATLANTA)
WMVV (90.7 FM; GRIFFIN, GA; Owner: LIFE RADIO MINISTRIES, INC)
WKLS (96.1 FM; ATLANTA, GA; Owner: CITICASTERS LICENSES, L.P.)
WLTM (94.9 FM; ATLANTA, GA; Owner: CITICASTERS LICENSES, L.P.)
WRAS (88.5 FM; ATLANTA, GA; Owner: GEORGIA STATE UNIVERSITY)
WFSH-FM (104.7 FM; ATHENS, GA; Owner: SOUTH TEXAS BROADCASTING, INC.)
WHTA (107.9 FM; HAMPTON, GA; Owner: RADIO ONE LICENSES, LLC)
WPZE (97.5 FM; FAYETTEVILLE, GA; Owner: ROA LICENSES, LLC)
WFOX (97.1 FM; GAINESVILLE, GA; Owner: COX RADIO, INC.)
WALR-FM (104.1 FM; LA GRANGE, GA; Owner: CXR HOLDINGS, INC.)
WAMJ (102.5 FM; MABLETON, GA; Owner: NEW MABLETON BROADCASTING CORPORATION)
WYAY (106.7 FM; GAINESVILLE, GA; Owner: ABC, INC.)
TV broadcast stations around Stockbridge:
WXIA-TV (Channel 11; ATLANTA, GA; Owner: GANNETT GEORGIA, L.P.)
WUVG (Channel 34; ATHENS, GA; Owner: UNIVISION ATLANTA LLC)
WSB-TV (Channel 2; ATLANTA, GA; Owner: WSB-TV HOLDINGS, INC.)
WAGA (Channel 5; ATLANTA, GA; Owner: FOX TELEVISION STATIONS, INC.)
WHSG (Channel 63; MONROE, GA; Owner: TRINITY BROADCASTING NETWORK)
W52CL (Channel 52; MACON, GA; Owner: TRINITY BROADCASTING NETWORK)
WUPA (Channel 69; ATLANTA, GA; Owner: VIACOM STATIONS GROUP OF ATLANTA INC.)
WPBA (Channel 30; ATLANTA, GA; Owner: BOARD OF EDUCATION OF THE CITY OF ATLANTA)
WTBS (Channel 17; ATLANTA, GA; Owner: SUPERSTATION, INC.)
WATL (Channel 36; ATLANTA, GA; Owner: WATL, LLC)
WGCL-TV (Channel 46; ATLANTA, GA; Owner: MEREDITH CORPORATION)
WANN-LP (Channel 32; ATLANTA, GA; Owner: PRISM BROADCASTING NETWORK, INC.)
WDTA-LP (Channel 53; FAYETTEVILLE, GA; Owner: WORD OF GOD FELLOWSHIP, INC.)
WANX-LP (Channel 26; ATLANTA, GA; Owner: PRISM BROADCASTING NETWORK, INC.)
WTHC-LP (Channel 42; ATLANTA, GA; Owner: THE ATLANTA CHANNEL, INC.)
WIRE-CA (Channel 40; ATLANTA, GA; Owner: COMMERCIAL BROADCASTING CORP.)
W24AL (Channel 24; ATLANTA, GA; Owner: VENTANA TELEVISION, INC.)
W04DB (Channel 4; ATLANTA, GA; Owner: VVILPTV, INC.)
WATC (Channel 57; ATLANTA, GA; Owner: COMMUNITY TELEVISION, INC.)
WSKC-LP (Channel 59; ATLANTA, GA; Owner: KM LPTV OF ATLANTA, L.L.C.)
WGTV (Channel 8; ATHENS, GA; Owner: GEORGIA PUBLIC TELECOMMUNICATIONS COMMISSION)
Medal of Honor Recipients
Medal of Honor Recipient born in Stockbridge: Lee H. Phillips.
National Bridge Inventory (NBI) Statistics 84 Number of bridges938ft / 286m Total length $246,838,000 Total costs2,682,670 Total average daily traffic97,008 Total average daily truck traffic
New bridges - historical statistics
1 1930-1939 5 1950-1959 12 1960-1969 6 1970-1979 13 1980-1989 6 1990-1999 14 2000-2009 10 2010-2019
See full National Bridge Inventory statistics for Stockbridge, GA
Home Mortgage Disclosure Act Aggregated Statistics For Year 2009(Based on 10 partial tracts) A) FHA, FSA/RHS & VA B) Conventional C) Refinancings D) Home Improvement Loans F) Non-occupant Loans on G) Loans On Manufactured Number Average Value Number Average Value Number Average Value Number Average Value Number Average Value Number Average Value
LOANS ORIGINATED 77 $126,616 30 $106,150 172 $170,824 9 $36,974 27 $254,510 1 $60,420 APPLICATIONS APPROVED, NOT ACCEPTED 4 $100,850 1 $160,060 17 $148,006 1 $18,140 1 $103,830 0 $0 APPLICATIONS DENIED 19 $130,901 11 $120,100 121 $160,703 13 $30,088 11 $60,468 0 $0 APPLICATIONS WITHDRAWN 15 $110,867 6 $114,945 75 $159,346 3 $72,390 5 $91,168 0 $0 FILES CLOSED FOR INCOMPLETENESS 4 $104,032 3 $149,600 17 $174,562 0 $0 1 $85,440 0 $0
Aggregated Statistics For Year 2008(Based on 10 partial tracts) A) FHA, FSA/RHS & VA B) Conventional C) Refinancings D) Home Improvement Loans E) Loans on Dwellings For 5+ Families F) Non-occupant Loans on G) Loans On Manufactured Number Average Value Number Average Value Number Average Value Number Average Value Number Average Value Number Average Value Number Average Value
LOANS ORIGINATED 91 $144,106 66 $130,079 161 $160,515 9 $33,751 2 $6,340,700 56 $150,556 2 $59,310 APPLICATIONS APPROVED, NOT ACCEPTED 4 $150,910 12 $109,436 25 $162,555 3 $16,840 0 $0 3 $98,027 0 $0 APPLICATIONS DENIED 15 $145,680 23 $157,387 155 $153,376 36 $41,327 1 $420,670 23 $75,830 0 $0 APPLICATIONS WITHDRAWN 13 $141,615 16 $133,258 60 $163,057 4 $74,928 0 $0 7 $112,314 0 $0 FILES CLOSED FOR INCOMPLETENESS 3 $143,547 5 $169,740 10 $167,877 1 $130,940 0 $0 2 $105,115 0 $0
Aggregated Statistics For Year 2007(Based on 10 partial tracts) A) FHA, FSA/RHS & VA B) Conventional C) Refinancings D) Home Improvement Loans E) Loans on Dwellings For 5+ Families F) Non-occupant Loans on G) Loans On Manufactured Number Average Value Number Average Value Number Average Value Number Average Value Number Average Value Number Average Value Number Average Value
LOANS ORIGINATED 40 $149,913 206 $140,062 205 $141,421 28 $38,921 1 $17,051,600 67 $113,100 1 $43,230 APPLICATIONS APPROVED, NOT ACCEPTED 2 $132,625 38 $132,022 64 $158,589 9 $50,934 0 $0 15 $103,345 0 $0 APPLICATIONS DENIED 8 $161,152 82 $145,471 283 $158,994 62 $43,374 0 $0 46 $125,554 2 $30,910 APPLICATIONS WITHDRAWN 7 $160,303 34 $147,493 107 $152,337 8 $80,145 0 $0 11 $118,548 0 $0 FILES CLOSED FOR INCOMPLETENESS 1 $94,660 17 $149,546 30 $174,385 1 $90,330 0 $0 4 $106,045 0 $0
Aggregated Statistics For Year 2006(Based on 10 partial tracts) A) FHA, FSA/RHS & VA B) Conventional C) Refinancings D) Home Improvement Loans F) Non-occupant Loans on G) Loans On Manufactured Number Average Value Number Average Value Number Average Value Number Average Value Number Average Value Number Average Value
LOANS ORIGINATED 49 $146,924 432 $117,106 257 $131,154 34 $37,194 118 $108,751 3 $52,190 APPLICATIONS APPROVED, NOT ACCEPTED 4 $145,152 72 $122,010 59 $130,105 6 $31,588 20 $96,646 4 $51,672 APPLICATIONS DENIED 6 $161,573 140 $134,962 267 $146,799 65 $42,463 37 $92,799 4 $66,760 APPLICATIONS WITHDRAWN 10 $157,107 63 $133,340 138 $145,391 8 $60,286 18 $115,276 0 $0 FILES CLOSED FOR INCOMPLETENESS 0 $0 22 $140,643 41 $154,066 0 $0 4 $119,212 0 $0
Aggregated Statistics For Year 2005(Based on 10 partial tracts) A) FHA, FSA/RHS & VA B) Conventional C) Refinancings D) Home Improvement Loans E) Loans on Dwellings For 5+ Families F) Non-occupant Loans on G) Loans On Manufactured Number Average Value Number Average Value Number Average Value Number Average Value Number Average Value Number Average Value Number Average Value
LOANS ORIGINATED 70 $150,663 503 $112,483 336 $132,001 29 $53,859 1 $1,735,430 129 $112,118 3 $24,980 APPLICATIONS APPROVED, NOT ACCEPTED 2 $115,530 45 $128,033 72 $131,287 9 $48,636 1 $739,810 12 $124,930 3 $40,090 APPLICATIONS DENIED 10 $132,871 129 $121,193 299 $142,677 49 $51,843 0 $0 32 $131,343 7 $41,607 APPLICATIONS WITHDRAWN 6 $163,977 85 $134,690 188 $146,743 21 $108,612 1 $66,260 26 $122,597 0 $0 FILES CLOSED FOR INCOMPLETENESS 0 $0 26 $103,060 41 $152,879 1 $36,160 0 $0 6 $103,692 0 $0
Aggregated Statistics For Year 2004(Based on 10 partial tracts) A) FHA, FSA/RHS & VA B) Conventional C) Refinancings D) Home Improvement Loans E) Loans on Dwellings For 5+ Families F) Non-occupant Loans on G) Loans On Manufactured Number Average Value Number Average Value Number Average Value Number Average Value Number Average Value Number Average Value Number Average Value
LOANS ORIGINATED 97 $141,802 344 $123,082 355 $131,239 21 $54,610 1 $130,170 91 $98,548 2 $55,265 APPLICATIONS APPROVED, NOT ACCEPTED 4 $157,150 38 $126,272 73 $124,515 6 $51,440 0 $0 13 $110,390 4 $60,530 APPLICATIONS DENIED 15 $135,806 70 $124,907 247 $125,747 43 $46,911 0 $0 25 $94,680 5 $33,870 APPLICATIONS WITHDRAWN 8 $143,426 44 $149,015 123 $128,860 10 $43,836 0 $0 12 $115,467 0 $0 FILES CLOSED FOR INCOMPLETENESS 2 $145,605 18 $115,693 50 $146,215 3 $52,237 0 $0 2 $143,490 0 $0
Aggregated Statistics For Year 2003(Based on 10 partial tracts) A) FHA, FSA/RHS & VA B) Conventional C) Refinancings D) Home Improvement Loans F) Non-occupant Loans on Number Average Value Number Average Value Number Average Value Number Average Value Number Average Value
LOANS ORIGINATED 111 $136,367 264 $134,048 740 $128,963 22 $49,179 89 $112,862 APPLICATIONS APPROVED, NOT ACCEPTED 4 $125,215 28 $148,826 81 $125,288 4 $26,462 5 $111,054 APPLICATIONS DENIED 15 $134,536 47 $142,534 191 $125,230 26 $30,561 18 $120,933 APPLICATIONS WITHDRAWN 12 $134,978 37 $125,850 113 $135,677 5 $30,946 8 $163,001 FILES CLOSED FOR INCOMPLETENESS 1 $115,460 14 $169,909 28 $133,259 0 $0 2 $155,325
Aggregated Statistics For Year 1999(Based on 10 partial tracts) A) FHA, FSA/RHS & VA B) Conventional C) Refinancings D) Home Improvement Loans F) Non-occupant Loans on Number Average Value Number Average Value Number Average Value Number Average Value Number Average Value
LOANS ORIGINATED 142 $108,143 185 $119,344 136 $97,088 23 $22,803 13 $92,494 APPLICATIONS APPROVED, NOT ACCEPTED 1 $164,540 26 $72,409 32 $82,012 14 $18,571 2 $68,990 APPLICATIONS DENIED 14 $107,274 92 $65,393 72 $80,014 26 $17,669 5 $95,264 APPLICATIONS WITHDRAWN 11 $106,681 20 $109,629 45 $95,053 6 $37,578 1 $92,020 FILES CLOSED FOR INCOMPLETENESS 0 $0 3 $103,123 13 $111,072 2 $20,305 1 $121,560
Detailed HMDA statistics for the following Tracts:
0701.04
, 0701.05 , 0701.06 , 0703.03 , 0703.05
Private Mortgage Insurance Companies Aggregated Statistics For Year 2009(Based on 10 partial tracts) A) Conventional B) Refinancings C) Non-occupant Loans on Number Average Value Number Average Value Number Average Value
LOANS ORIGINATED 4 $154,995 7 $150,273 1 $148,380 APPLICATIONS APPROVED, NOT ACCEPTED 1 $185,110 2 $165,810 0 $0 APPLICATIONS DENIED 1 $89,530 3 $533,557 0 $0 APPLICATIONS WITHDRAWN 1 $45,260 1 $148,400 0 $0 FILES CLOSED FOR INCOMPLETENESS 0 $0 0 $0 0 $0
Aggregated Statistics For Year 2008(Based on 10 partial tracts) A) Conventional B) Refinancings C) Non-occupant Loans on Number Average Value Number Average Value Number Average Value
LOANS ORIGINATED 34 $132,417 23 $162,095 12 $89,192 APPLICATIONS APPROVED, NOT ACCEPTED 17 $159,545 13 $175,530 2 $132,365 APPLICATIONS DENIED 5 $116,732 3 $150,927 3 $90,300 APPLICATIONS WITHDRAWN 3 $97,853 3 $194,017 2 $71,215 FILES CLOSED FOR INCOMPLETENESS 1 $174,810 1 $189,290 0 $0
Aggregated Statistics For Year 2007(Based on 10 partial tracts) A) Conventional B) Refinancings C) Non-occupant Loans on Number Average Value Number Average Value Number Average Value
LOANS ORIGINATED 88 $148,948 42 $154,164 12 $125,222 APPLICATIONS APPROVED, NOT ACCEPTED 12 $139,855 15 $157,686 2 $105,525 APPLICATIONS DENIED 4 $130,218 1 $126,080 2 $107,630 APPLICATIONS WITHDRAWN 5 $154,172 3 $164,973 1 $183,260 FILES CLOSED FOR INCOMPLETENESS 1 $67,040 0 $0 0 $0
Aggregated Statistics For Year 2006(Based on 10 partial tracts) A) Conventional B) Refinancings C) Non-occupant Loans on Number Average Value Number Average Value Number Average Value
LOANS ORIGINATED 54 $148,379 26 $156,026 10 $137,366 APPLICATIONS APPROVED, NOT ACCEPTED 5 $167,702 8 $152,562 0 $0 APPLICATIONS DENIED 2 $159,080 0 $0 1 $131,950 APPLICATIONS WITHDRAWN 2 $163,920 3 $212,467 1 $200,420 FILES CLOSED FOR INCOMPLETENESS 0 $0 0 $0 0 $0
Aggregated Statistics For Year 2005(Based on 10 partial tracts) A) Conventional B) Refinancings C) Non-occupant Loans on Number Average Value Number Average Value Number Average Value
LOANS ORIGINATED 45 $151,281 36 $146,890 13 $136,005 APPLICATIONS APPROVED, NOT ACCEPTED 6 $156,565 7 $181,856 2 $177,275 APPLICATIONS DENIED 1 $155,310 0 $0 1 $80,240 APPLICATIONS WITHDRAWN 2 $134,585 2 $143,250 3 $120,437 FILES CLOSED FOR INCOMPLETENESS 2 $103,735 1 $94,010 1 $123,400
Aggregated Statistics For Year 2004(Based on 10 partial tracts) A) Conventional B) Refinancings C) Non-occupant Loans on Number Average Value Number Average Value Number Average Value
LOANS ORIGINATED 61 $148,715 38 $144,794 17 $119,755 APPLICATIONS APPROVED, NOT ACCEPTED 14 $140,415 11 $150,798 5 $115,902 APPLICATIONS DENIED 1 $187,020 1 $175,800 1 $71,730 APPLICATIONS WITHDRAWN 6 $165,668 3 $130,450 2 $129,620 FILES CLOSED FOR INCOMPLETENESS 0 $0 0 $0 0 $0
Aggregated Statistics For Year 2003(Based on 10 partial tracts) A) Conventional B) Refinancings C) Non-occupant Loans on Number Average Value Number Average Value Number Average Value
LOANS ORIGINATED 69 $152,315 108 $136,569 18 $120,498 APPLICATIONS APPROVED, NOT ACCEPTED 12 $146,690 17 $139,076 1 $158,390 APPLICATIONS DENIED 1 $105,250 1 $179,430 1 $118,560 APPLICATIONS WITHDRAWN 7 $195,443 8 $146,120 2 $258,945 FILES CLOSED FOR INCOMPLETENESS 0 $0 0 $0 0 $0
Aggregated Statistics For Year 1999(Based on 10 partial tracts) A) Conventional B) Refinancings C) Non-occupant Loans on Number Average Value Number Average Value Number Average Value
LOANS ORIGINATED 69 $141,989 23 $121,625 4 $100,372 APPLICATIONS APPROVED, NOT ACCEPTED 5 $120,744 3 $120,273 0 $0 APPLICATIONS DENIED 2 $162,110 2 $93,110 0 $0 APPLICATIONS WITHDRAWN 2 $216,190 2 $134,010 0 $0 FILES CLOSED FOR INCOMPLETENESS 0 $0 0 $0 0 $0
Detailed PMIC statistics for the following Tracts:
0701.04
, 0701.05 , 0701.06 , 0703.03 , 0703.05 Fire-safe hotels and motels in Stockbridge, Georgia:
Motel 6 Stockbridge, 7233 Davidson Pkwy, Stockbridge, Georgia 30281 Phone: (770) 389-1142
Howard Johnson, 619 Hwy 138, Stockbridge, Georgia 30281 Phone: (770) 474-8771, Fax: (770) 474-2440
Baymont Inn & Suites, 100 N Park Ct, Stockbridge, Georgia 30281 Phone: (770) 507-6500, Fax: (770) 507-6300
Shoneys Inn, 110 Hwy 138, Stockbridge, Georgia 30281 Phone: (770) 389-5179, Fax: (770) 474-0016
Microtel Inn & Suites, 195 Country Club Dr, Stockbridge, Georgia 30281 Phone: (888) 771-7171
Quality Inn & Suites, 7325 Davidson Pkwy, Stockbridge, Georgia 30281 Phone: (770) 507-7911, Fax: (770) 507-7921
Sleep Inn & Suites, 7423 Davidson Circle W, Stockbridge, Georgia 30281 Phone: (770) 474-3870, Fax: (770) 474-3898
Super 8 Motel, 1451 Hudson Bridge Rd, Stockbridge, Georgia 30281 Phone: (770) 474-5758, Fax: (770) 474-1297
6 other hotels and motels
All 14 fire-safe hotels and motels in Stockbridge, Georgia
Most common first names in Stockbridge, GA among deceased individuals Name Count Lived (average)
James 162 69.9 years William 158 73.4 years John 124 73.8 years Mary 122 78.5 years Robert 83 69.6 years Charles 76 69.8 years George 56 73.0 years Thomas 47 70.5 years Frances 47 77.3 years Dorothy 45 77.8 years
Most common last names in Stockbridge, GA among deceased individuals Last name Count Lived (average)
Smith 75 71.6 years Jones 58 72.5 years Johnson 48 76.9 years Brown 43 74.6 years Davis 39 70.0 years Turner 38 76.7 years Williams 37 68.8 years Wilson 34 76.8 years Phillips 30 78.0 years Moseley 28 79.4 years
Stockbridge compared to Georgia state average:
Unemployed percentage significantly below state average. Black race population percentage significantly above state average. Hispanic race population percentage above state average. Median age below state average. Foreign-born population percentage significantly above state average. Length of stay since moving in above state average. House age significantly below state average. Number of college students above state average. Stockbridge on our top lists :
#33 on the list of "Top 101 cities with the largest percentage population increase from 2000 (population 5,000+)"
#94 on the list of "Top 101 cities with largest percentage of males in industries: transportation and warehousing (population 5,000+)"
#5 on the list of "Top 101 counties with the largest decrease in the number of births per 1000 residents 2000-2006 to 2007-2013 (pop 50,000+)"
#58 on the list of "Top 101 counties with the lowest ground withdrawal of fresh water for public supply (pop. 50,000+)"
#74 on the list of "Top 101 counties with the highest percentage of residents relocating to other counties in 2011 (pop. 50,000+)"
#81 on the list of "Top 101 counties with the highest percentage of residents relocating from other counties between 2010 and 2011 (pop. 50,000+)"
#95 on the list of "Top 101 counties with the lowest number of deaths per 1000 residents 2007-2013 (pop. 50,000+)"
Top Patent Applicants
Kondareddiar Ramalingam (6)
Robert E. Mills, Jr. (5)
Quang L. Duong (4)
James M. Dabbs, Iii (2)
Darryl J. Dawson, Sr. (2)
Gordon Edwards (2)
Steve Lundquist (2)
J. Rhett Mayor (2)
Mark C. Englert (2)
Kendrick Michael Borst, Sr. (2)
Total of 68 patent applications in 2008-2024.

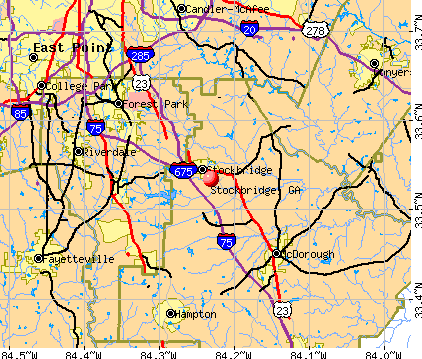


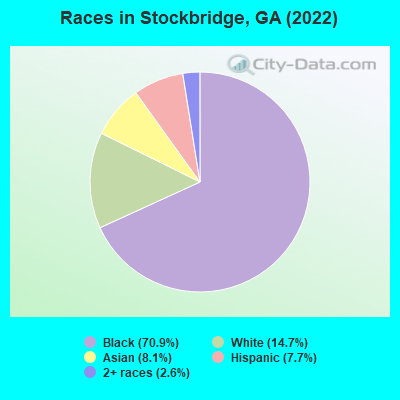
 Recent articles from our blog. Our writers, many of them Ph.D. graduates or candidates, create easy-to-read articles on a wide variety of topics.


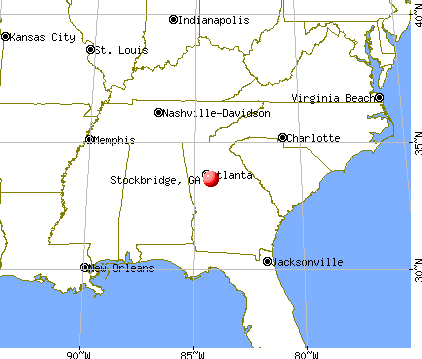
 (18.5 miles
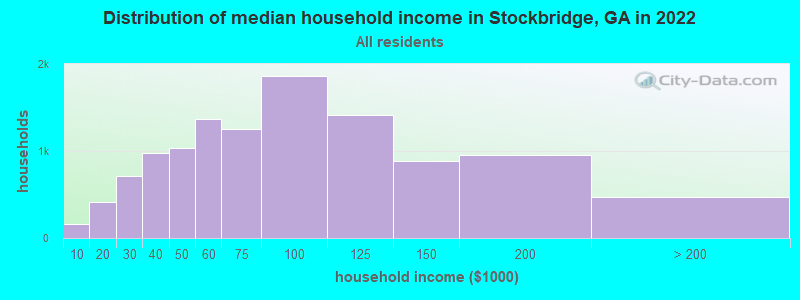
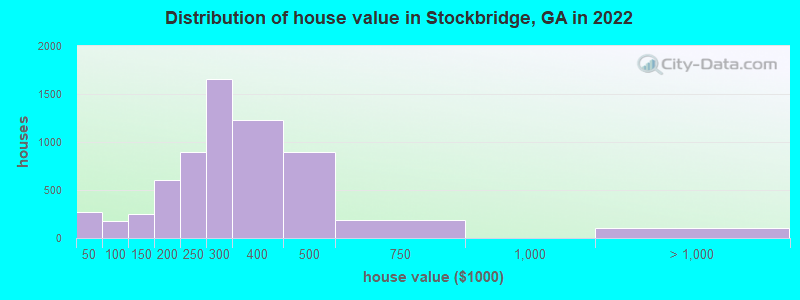

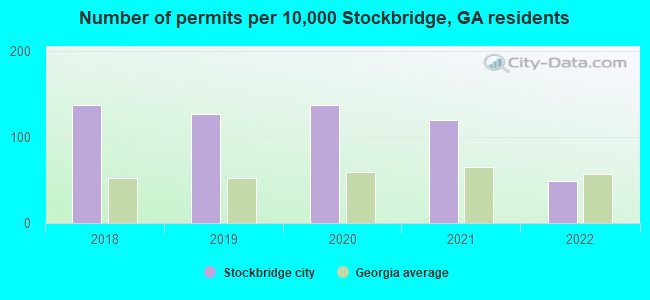
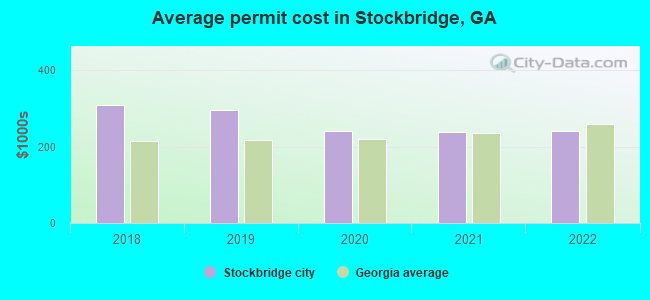
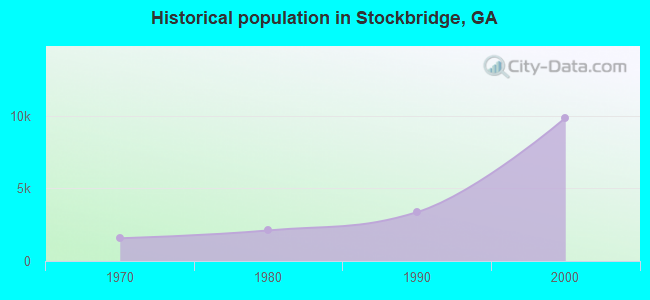
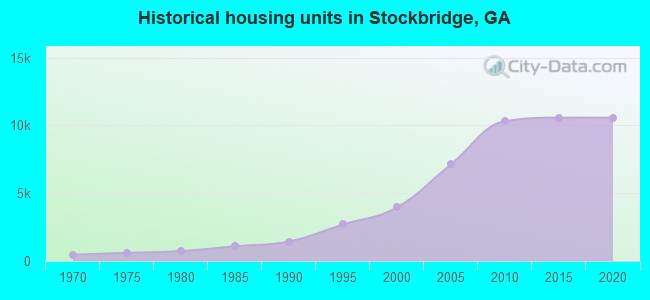
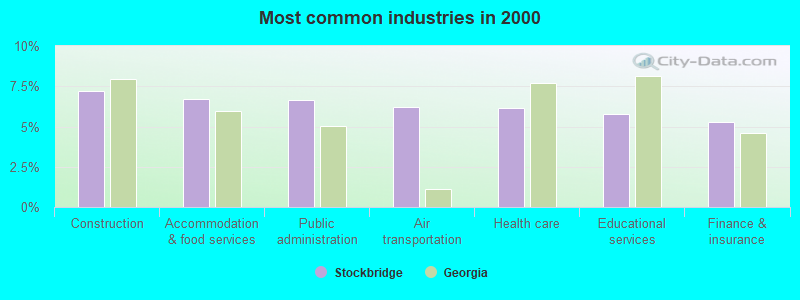
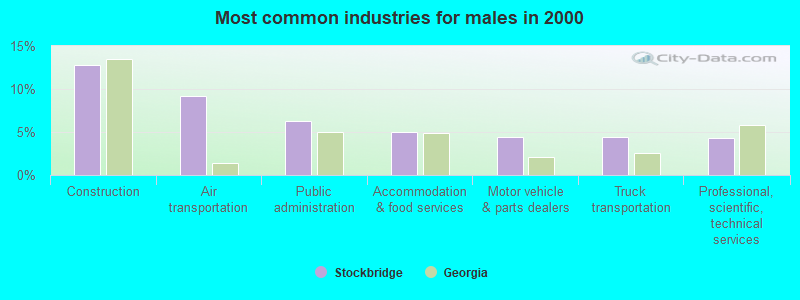
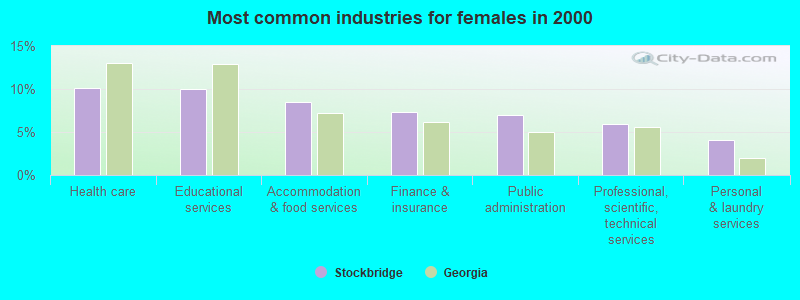
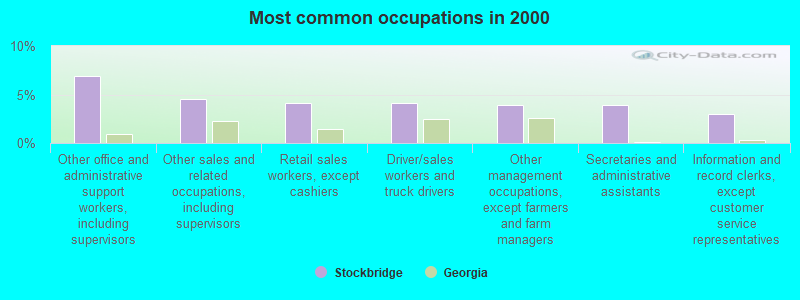
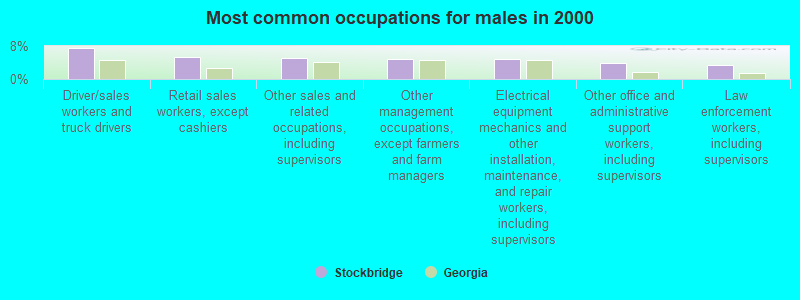
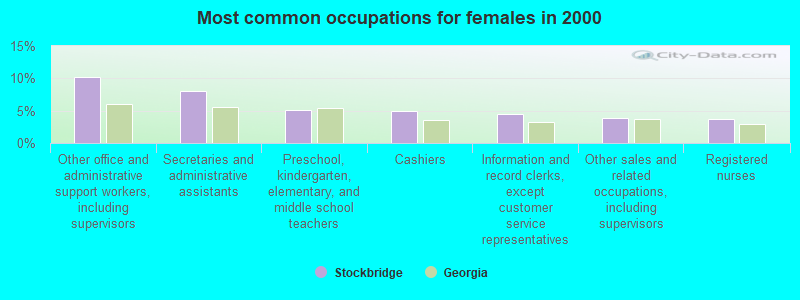
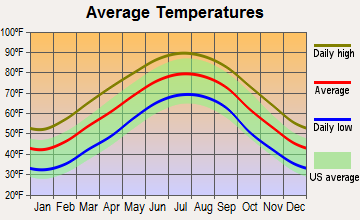

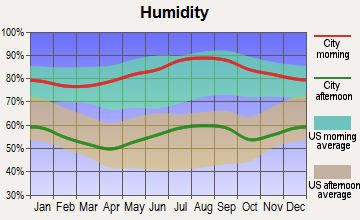


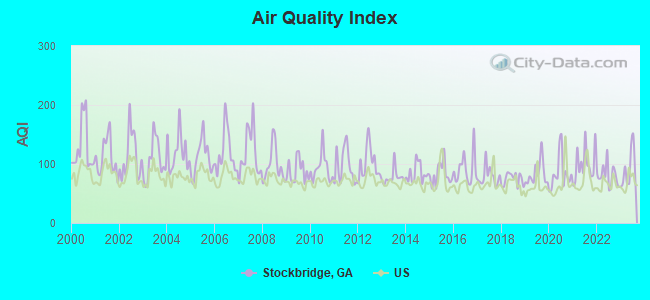
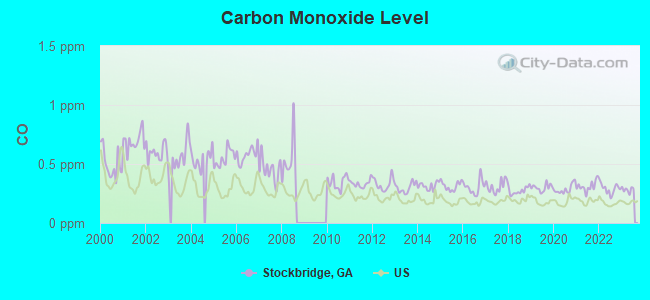
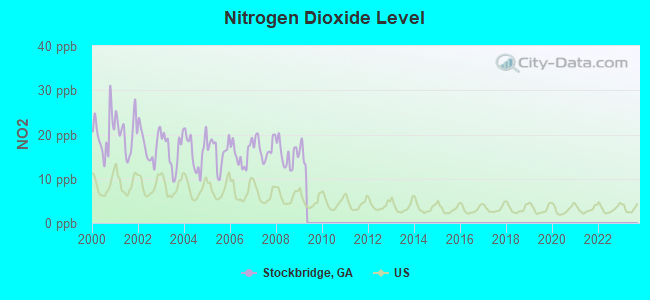
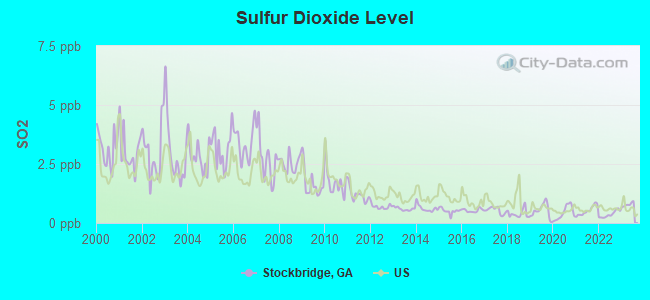
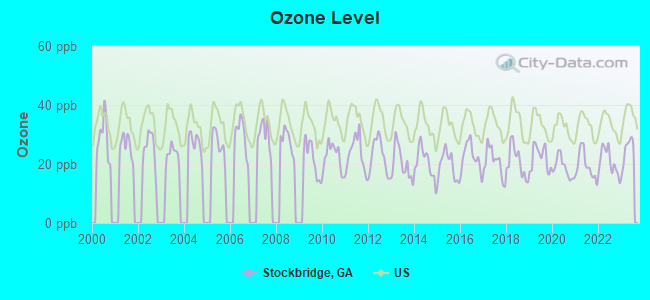
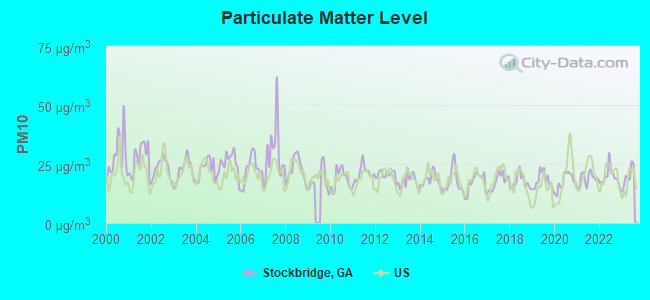
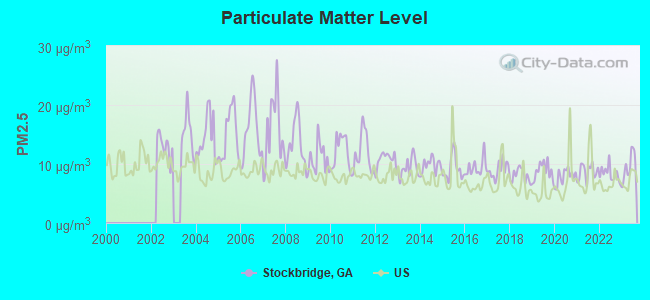
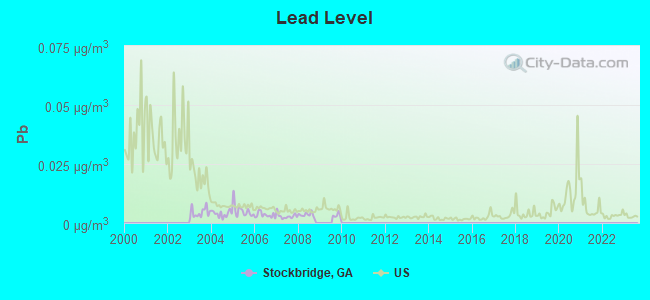

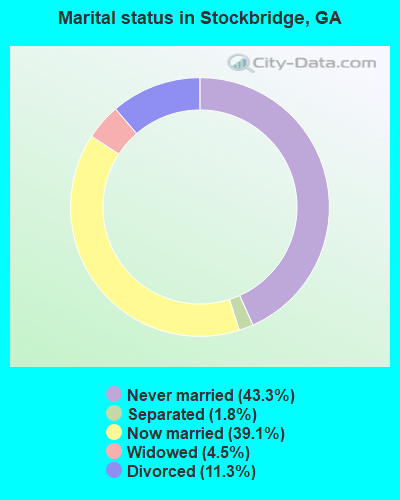
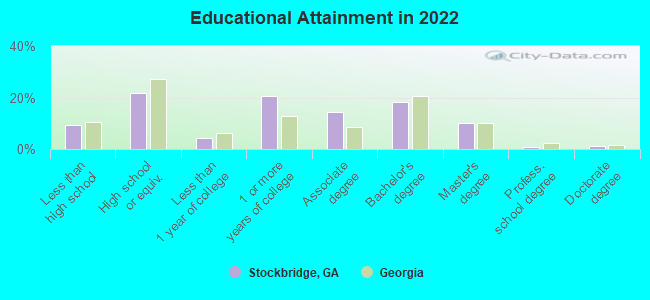
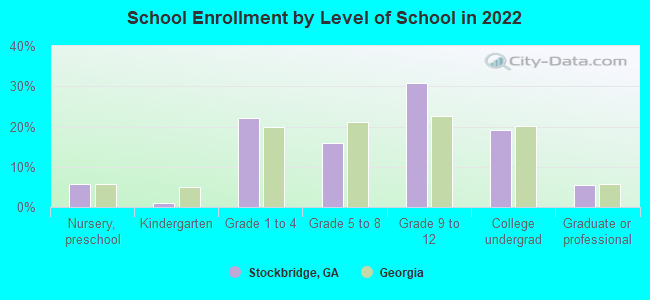
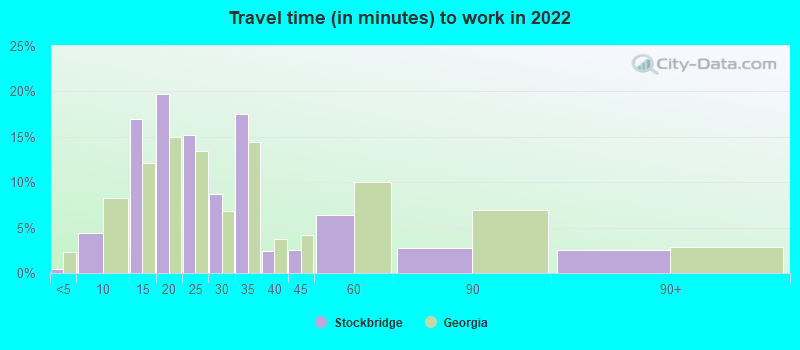
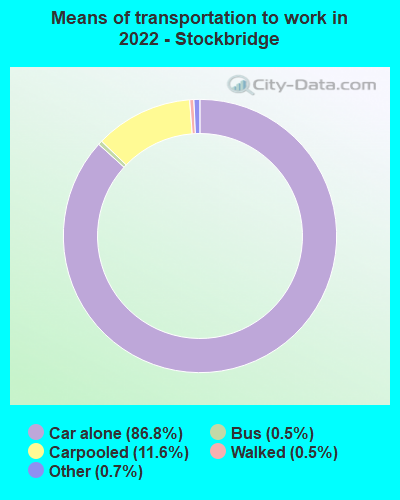
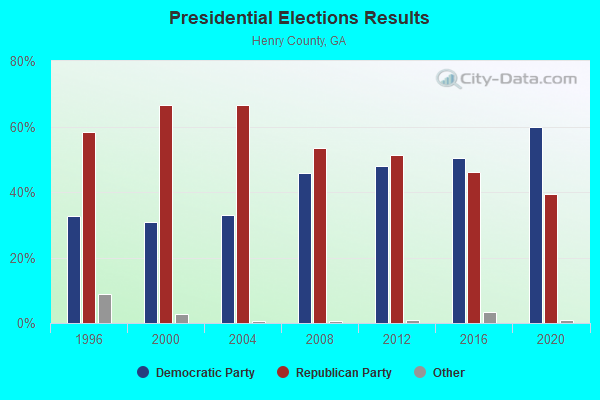
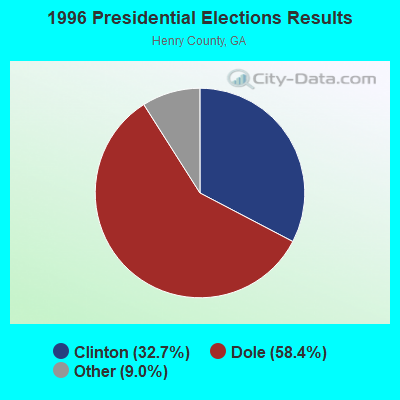
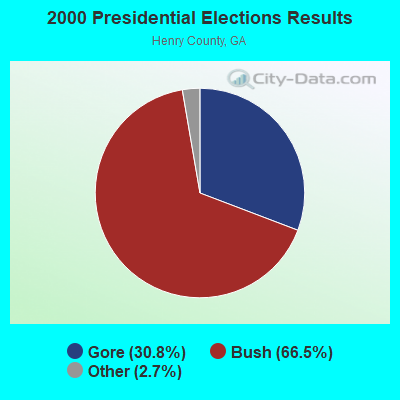
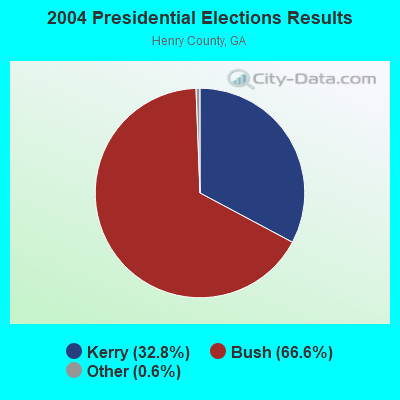
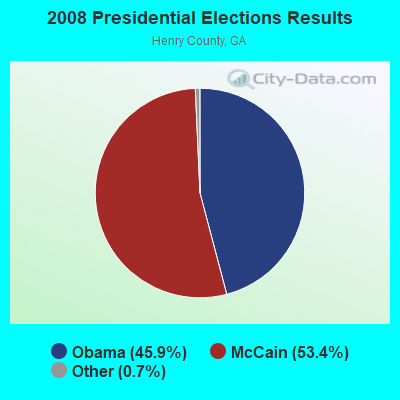
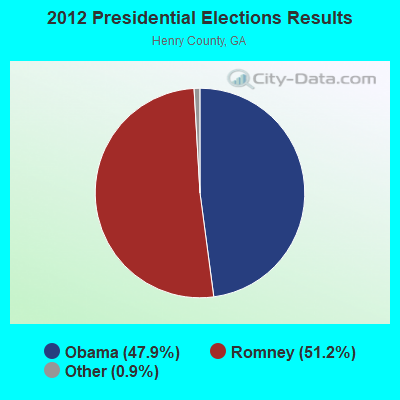
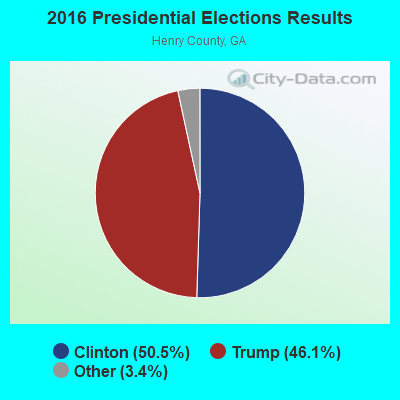
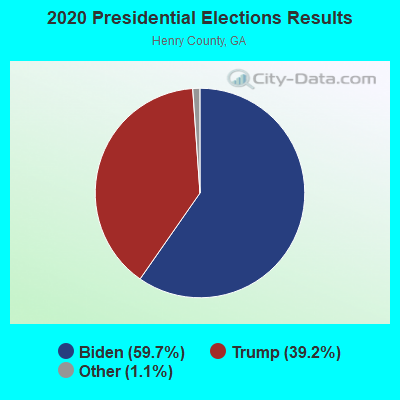
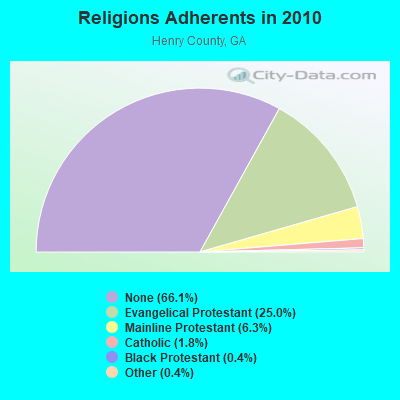
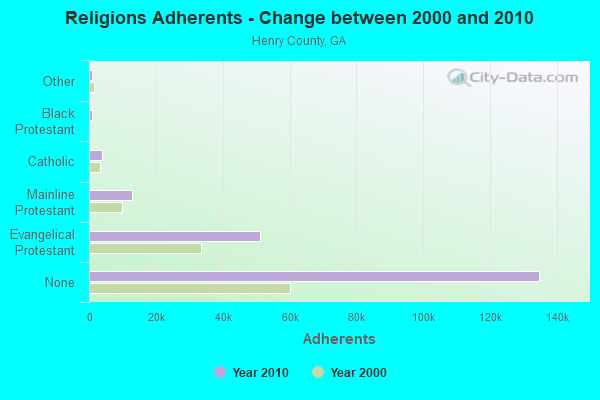
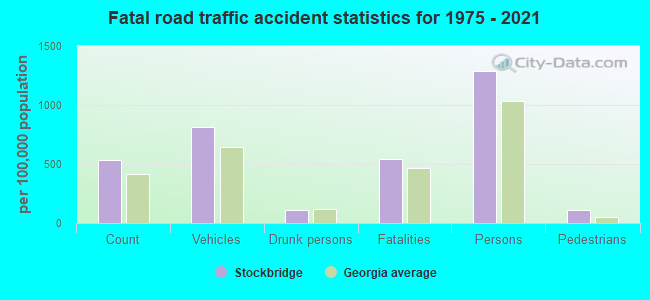
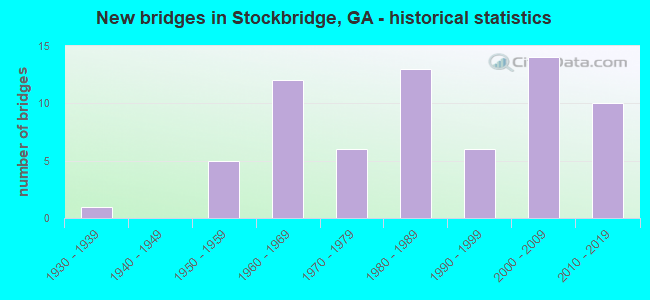
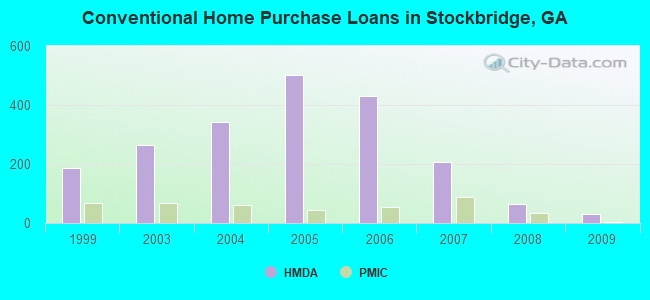
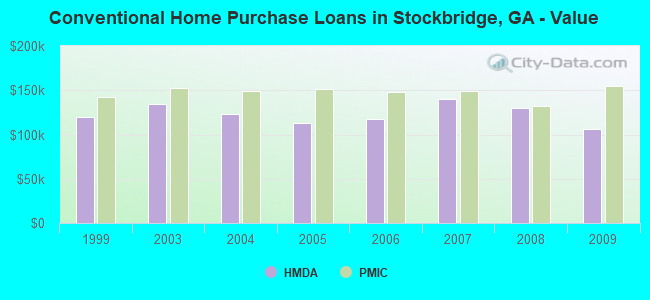
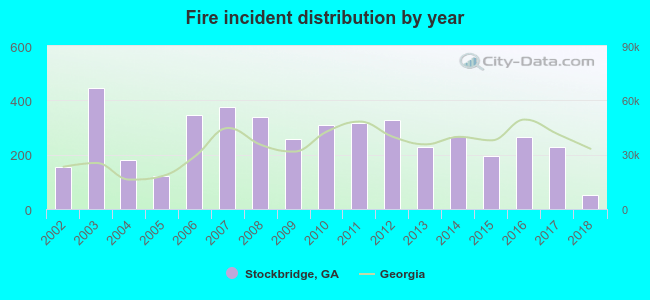 According to the data from the years 2002 - 2018 the average number of fires per year is 260. The highest number of reported fire incidents - 447 took place in 2003, and the least - 50 in 2018. The data has a decreasing trend.
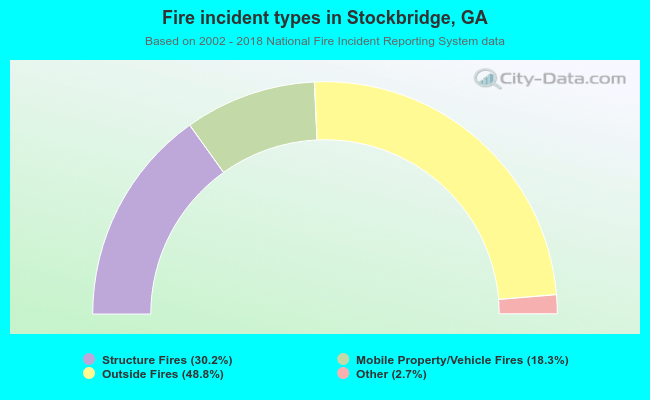 When looking into fire subcategories, the most reports belonged to: Outside Fires (48.8%), and Structure Fires (30.2%).