Universal City, Texas Submit your own pictures of this city and show them to the world
OSM Map
General Map
Google Map
MSN Map
OSM Map
General Map
Google Map
MSN Map
OSM Map
General Map
Google Map
MSN Map
OSM Map
General Map
Google Map
MSN Map
Please wait while loading the map...
Population in 2022: 19,990 (100% urban, 0% rural). Population change since 2000: +34.6%Males: 10,076 Females: 9,914
March 2022 cost of living index in Universal City: 87.8 (less than average, U.S. average is 100) Percentage of residents living in poverty in 2022: 11.7%for White Non-Hispanic residents , 5.0% for Black residents , 12.8% for Hispanic or Latino residents , 9.7% for other race residents , 19.4% for two or more races residents )
Profiles of local businesses
Business Search - 14 Million verified businesses
Data:
Median household income ($)
Median household income (% change since 2000)
Household income diversity
Ratio of average income to average house value (%)
Ratio of average income to average rent
Median household income ($) - White
Median household income ($) - Black or African American
Median household income ($) - Asian
Median household income ($) - Hispanic or Latino
Median household income ($) - American Indian and Alaska Native
Median household income ($) - Multirace
Median household income ($) - Other Race
Median household income for houses/condos with a mortgage ($)
Median household income for apartments without a mortgage ($)
Races - White alone (%)
Races - White alone (% change since 2000)
Races - Black alone (%)
Races - Black alone (% change since 2000)
Races - American Indian alone (%)
Races - American Indian alone (% change since 2000)
Races - Asian alone (%)
Races - Asian alone (% change since 2000)
Races - Hispanic (%)
Races - Hispanic (% change since 2000)
Races - Native Hawaiian and Other Pacific Islander alone (%)
Races - Native Hawaiian and Other Pacific Islander alone (% change since 2000)
Races - Two or more races (%)
Races - Two or more races (% change since 2000)
Races - Other race alone (%)
Races - Other race alone (% change since 2000)
Racial diversity
Unemployment (%)
Unemployment (% change since 2000)
Unemployment (%) - White
Unemployment (%) - Black or African American
Unemployment (%) - Asian
Unemployment (%) - Hispanic or Latino
Unemployment (%) - American Indian and Alaska Native
Unemployment (%) - Multirace
Unemployment (%) - Other Race
Population density (people per square mile)
Population - Males (%)
Population - Females (%)
Population - Males (%) - White
Population - Males (%) - Black or African American
Population - Males (%) - Asian
Population - Males (%) - Hispanic or Latino
Population - Males (%) - American Indian and Alaska Native
Population - Males (%) - Multirace
Population - Males (%) - Other Race
Population - Females (%) - White
Population - Females (%) - Black or African American
Population - Females (%) - Asian
Population - Females (%) - Hispanic or Latino
Population - Females (%) - American Indian and Alaska Native
Population - Females (%) - Multirace
Population - Females (%) - Other Race
Coronavirus confirmed cases (Apr 18, 2024)
Deaths caused by coronavirus (Apr 18, 2024)
Coronavirus confirmed cases (per 100k population) (Apr 18, 2024)
Deaths caused by coronavirus (per 100k population) (Apr 18, 2024)
Daily increase in number of cases (Apr 18, 2024)
Weekly increase in number of cases (Apr 18, 2024)
Cases doubled (in days) (Apr 18, 2024)
Hospitalized patients (Apr 18, 2022)
Negative test results (Apr 18, 2022)
Total test results (Apr 18, 2022)
COVID Vaccine doses distributed (per 100k population) (Sep 19, 2023)
COVID Vaccine doses administered (per 100k population) (Sep 19, 2023)
COVID Vaccine doses distributed (Sep 19, 2023)
COVID Vaccine doses administered (Sep 19, 2023)
Likely homosexual households (%)
Likely homosexual households (% change since 2000)
Likely homosexual households - Lesbian couples (%)
Likely homosexual households - Lesbian couples (% change since 2000)
Likely homosexual households - Gay men (%)
Likely homosexual households - Gay men (% change since 2000)
Cost of living index
Median gross rent ($)
Median contract rent ($)
Median monthly housing costs ($)
Median house or condo value ($)
Median house or condo value ($ change since 2000)
Mean house or condo value by units in structure - 1, detached ($)
Mean house or condo value by units in structure - 1, attached ($)
Mean house or condo value by units in structure - 2 ($)
Mean house or condo value by units in structure by units in structure - 3 or 4 ($)
Mean house or condo value by units in structure - 5 or more ($)
Mean house or condo value by units in structure - Boat, RV, van, etc. ($)
Mean house or condo value by units in structure - Mobile home ($)
Median house or condo value ($) - White
Median house or condo value ($) - Black or African American
Median house or condo value ($) - Asian
Median house or condo value ($) - Hispanic or Latino
Median house or condo value ($) - American Indian and Alaska Native
Median house or condo value ($) - Multirace
Median house or condo value ($) - Other Race
Median resident age
Resident age diversity
Median resident age - Males
Median resident age - Females
Median resident age - White
Median resident age - Black or African American
Median resident age - Asian
Median resident age - Hispanic or Latino
Median resident age - American Indian and Alaska Native
Median resident age - Multirace
Median resident age - Other Race
Median resident age - Males - White
Median resident age - Males - Black or African American
Median resident age - Males - Asian
Median resident age - Males - Hispanic or Latino
Median resident age - Males - American Indian and Alaska Native
Median resident age - Males - Multirace
Median resident age - Males - Other Race
Median resident age - Females - White
Median resident age - Females - Black or African American
Median resident age - Females - Asian
Median resident age - Females - Hispanic or Latino
Median resident age - Females - American Indian and Alaska Native
Median resident age - Females - Multirace
Median resident age - Females - Other Race
Commute - mean travel time to work (minutes)
Travel time to work - Less than 5 minutes (%)
Travel time to work - Less than 5 minutes (% change since 2000)
Travel time to work - 5 to 9 minutes (%)
Travel time to work - 5 to 9 minutes (% change since 2000)
Travel time to work - 10 to 19 minutes (%)
Travel time to work - 10 to 19 minutes (% change since 2000)
Travel time to work - 20 to 29 minutes (%)
Travel time to work - 20 to 29 minutes (% change since 2000)
Travel time to work - 30 to 39 minutes (%)
Travel time to work - 30 to 39 minutes (% change since 2000)
Travel time to work - 40 to 59 minutes (%)
Travel time to work - 40 to 59 minutes (% change since 2000)
Travel time to work - 60 to 89 minutes (%)
Travel time to work - 60 to 89 minutes (% change since 2000)
Travel time to work - 90 or more minutes (%)
Travel time to work - 90 or more minutes (% change since 2000)
Marital status - Never married (%)
Marital status - Now married (%)
Marital status - Separated (%)
Marital status - Widowed (%)
Marital status - Divorced (%)
Median family income ($)
Median family income (% change since 2000)
Median non-family income ($)
Median non-family income (% change since 2000)
Median per capita income ($)
Median per capita income (% change since 2000)
Median family income ($) - White
Median family income ($) - Black or African American
Median family income ($) - Asian
Median family income ($) - Hispanic or Latino
Median family income ($) - American Indian and Alaska Native
Median family income ($) - Multirace
Median family income ($) - Other Race
Median year house/condo built
Median year apartment built
Year house built - Built 2005 or later (%)
Year house built - Built 2000 to 2004 (%)
Year house built - Built 1990 to 1999 (%)
Year house built - Built 1980 to 1989 (%)
Year house built - Built 1970 to 1979 (%)
Year house built - Built 1960 to 1969 (%)
Year house built - Built 1950 to 1959 (%)
Year house built - Built 1940 to 1949 (%)
Year house built - Built 1939 or earlier (%)
Average household size
Household density (households per square mile)
Average household size - White
Average household size - Black or African American
Average household size - Asian
Average household size - Hispanic or Latino
Average household size - American Indian and Alaska Native
Average household size - Multirace
Average household size - Other Race
Occupied housing units (%)
Vacant housing units (%)
Owner occupied housing units (%)
Renter occupied housing units (%)
Vacancy status - For rent (%)
Vacancy status - For sale only (%)
Vacancy status - Rented or sold, not occupied (%)
Vacancy status - For seasonal, recreational, or occasional use (%)
Vacancy status - For migrant workers (%)
Vacancy status - Other vacant (%)
Residents with income below the poverty level (%)
Residents with income below 50% of the poverty level (%)
Children below poverty level (%)
Poor families by family type - Married-couple family (%)
Poor families by family type - Male, no wife present (%)
Poor families by family type - Female, no husband present (%)
Poverty status for native-born residents (%)
Poverty status for foreign-born residents (%)
Poverty among high school graduates not in families (%)
Poverty among people who did not graduate high school not in families (%)
Residents with income below the poverty level (%) - White
Residents with income below the poverty level (%) - Black or African American
Residents with income below the poverty level (%) - Asian
Residents with income below the poverty level (%) - Hispanic or Latino
Residents with income below the poverty level (%) - American Indian and Alaska Native
Residents with income below the poverty level (%) - Multirace
Residents with income below the poverty level (%) - Other Race
Air pollution - Air Quality Index (AQI)
Air pollution - CO
Air pollution - NO2
Air pollution - SO2
Air pollution - Ozone
Air pollution - PM10
Air pollution - PM25
Air pollution - Pb
Crime - Murders per 100,000 population
Crime - Rapes per 100,000 population
Crime - Robberies per 100,000 population
Crime - Assaults per 100,000 population
Crime - Burglaries per 100,000 population
Crime - Thefts per 100,000 population
Crime - Auto thefts per 100,000 population
Crime - Arson per 100,000 population
Crime - City-data.com crime index
Crime - Violent crime index
Crime - Property crime index
Crime - Murders per 100,000 population (5 year average)
Crime - Rapes per 100,000 population (5 year average)
Crime - Robberies per 100,000 population (5 year average)
Crime - Assaults per 100,000 population (5 year average)
Crime - Burglaries per 100,000 population (5 year average)
Crime - Thefts per 100,000 population (5 year average)
Crime - Auto thefts per 100,000 population (5 year average)
Crime - Arson per 100,000 population (5 year average)
Crime - City-data.com crime index (5 year average)
Crime - Violent crime index (5 year average)
Crime - Property crime index (5 year average)
1996 Presidential Elections Results (%) - Democratic Party (Clinton)
1996 Presidential Elections Results (%) - Republican Party (Dole)
1996 Presidential Elections Results (%) - Other
2000 Presidential Elections Results (%) - Democratic Party (Gore)
2000 Presidential Elections Results (%) - Republican Party (Bush)
2000 Presidential Elections Results (%) - Other
2004 Presidential Elections Results (%) - Democratic Party (Kerry)
2004 Presidential Elections Results (%) - Republican Party (Bush)
2004 Presidential Elections Results (%) - Other
2008 Presidential Elections Results (%) - Democratic Party (Obama)
2008 Presidential Elections Results (%) - Republican Party (McCain)
2008 Presidential Elections Results (%) - Other
2012 Presidential Elections Results (%) - Democratic Party (Obama)
2012 Presidential Elections Results (%) - Republican Party (Romney)
2012 Presidential Elections Results (%) - Other
2016 Presidential Elections Results (%) - Democratic Party (Clinton)
2016 Presidential Elections Results (%) - Republican Party (Trump)
2016 Presidential Elections Results (%) - Other
2020 Presidential Elections Results (%) - Democratic Party (Biden)
2020 Presidential Elections Results (%) - Republican Party (Trump)
2020 Presidential Elections Results (%) - Other
Ancestries Reported - Arab (%)
Ancestries Reported - Czech (%)
Ancestries Reported - Danish (%)
Ancestries Reported - Dutch (%)
Ancestries Reported - English (%)
Ancestries Reported - French (%)
Ancestries Reported - French Canadian (%)
Ancestries Reported - German (%)
Ancestries Reported - Greek (%)
Ancestries Reported - Hungarian (%)
Ancestries Reported - Irish (%)
Ancestries Reported - Italian (%)
Ancestries Reported - Lithuanian (%)
Ancestries Reported - Norwegian (%)
Ancestries Reported - Polish (%)
Ancestries Reported - Portuguese (%)
Ancestries Reported - Russian (%)
Ancestries Reported - Scotch-Irish (%)
Ancestries Reported - Scottish (%)
Ancestries Reported - Slovak (%)
Ancestries Reported - Subsaharan African (%)
Ancestries Reported - Swedish (%)
Ancestries Reported - Swiss (%)
Ancestries Reported - Ukrainian (%)
Ancestries Reported - United States (%)
Ancestries Reported - Welsh (%)
Ancestries Reported - West Indian (%)
Ancestries Reported - Other (%)
Educational Attainment - No schooling completed (%)
Educational Attainment - Less than high school (%)
Educational Attainment - High school or equivalent (%)
Educational Attainment - Less than 1 year of college (%)
Educational Attainment - 1 or more years of college (%)
Educational Attainment - Associate degree (%)
Educational Attainment - Bachelor's degree (%)
Educational Attainment - Master's degree (%)
Educational Attainment - Professional school degree (%)
Educational Attainment - Doctorate degree (%)
School Enrollment - Nursery, preschool (%)
School Enrollment - Kindergarten (%)
School Enrollment - Grade 1 to 4 (%)
School Enrollment - Grade 5 to 8 (%)
School Enrollment - Grade 9 to 12 (%)
School Enrollment - College undergrad (%)
School Enrollment - Graduate or professional (%)
School Enrollment - Not enrolled in school (%)
School enrollment - Public schools (%)
School enrollment - Private schools (%)
School enrollment - Not enrolled (%)
Median number of rooms in houses and condos
Median number of rooms in apartments
Housing units lacking complete plumbing facilities (%)
Housing units lacking complete kitchen facilities (%)
Density of houses
Urban houses (%)
Rural houses (%)
Households with people 60 years and over (%)
Households with people 65 years and over (%)
Households with people 75 years and over (%)
Households with one or more nonrelatives (%)
Households with no nonrelatives (%)
Population in households (%)
Family households (%)
Nonfamily households (%)
Population in families (%)
Family households with own children (%)
Median number of bedrooms in owner occupied houses
Mean number of bedrooms in owner occupied houses
Median number of bedrooms in renter occupied houses
Mean number of bedrooms in renter occupied houses
Median number of vehichles in owner occupied houses
Mean number of vehichles in owner occupied houses
Median number of vehichles in renter occupied houses
Mean number of vehichles in renter occupied houses
Mortgage status - with mortgage (%)
Mortgage status - with second mortgage (%)
Mortgage status - with home equity loan (%)
Mortgage status - with both second mortgage and home equity loan (%)
Mortgage status - without a mortgage (%)
Average family size
Average family size - White
Average family size - Black or African American
Average family size - Asian
Average family size - Hispanic or Latino
Average family size - American Indian and Alaska Native
Average family size - Multirace
Average family size - Other Race
Geographical mobility - Same house 1 year ago (%)
Geographical mobility - Moved within same county (%)
Geographical mobility - Moved from different county within same state (%)
Geographical mobility - Moved from different state (%)
Geographical mobility - Moved from abroad (%)
Place of birth - Born in state of residence (%)
Place of birth - Born in other state (%)
Place of birth - Native, outside of US (%)
Place of birth - Foreign born (%)
Housing units in structures - 1, detached (%)
Housing units in structures - 1, attached (%)
Housing units in structures - 2 (%)
Housing units in structures - 3 or 4 (%)
Housing units in structures - 5 to 9 (%)
Housing units in structures - 10 to 19 (%)
Housing units in structures - 20 to 49 (%)
Housing units in structures - 50 or more (%)
Housing units in structures - Mobile home (%)
Housing units in structures - Boat, RV, van, etc. (%)
House/condo owner moved in on average (years ago)
Renter moved in on average (years ago)
Year householder moved into unit - Moved in 1999 to March 2000 (%)
Year householder moved into unit - Moved in 1995 to 1998 (%)
Year householder moved into unit - Moved in 1990 to 1994 (%)
Year householder moved into unit - Moved in 1980 to 1989 (%)
Year householder moved into unit - Moved in 1970 to 1979 (%)
Year householder moved into unit - Moved in 1969 or earlier (%)
Means of transportation to work - Drove car alone (%)
Means of transportation to work - Carpooled (%)
Means of transportation to work - Public transportation (%)
Means of transportation to work - Bus or trolley bus (%)
Means of transportation to work - Streetcar or trolley car (%)
Means of transportation to work - Subway or elevated (%)
Means of transportation to work - Railroad (%)
Means of transportation to work - Ferryboat (%)
Means of transportation to work - Taxicab (%)
Means of transportation to work - Motorcycle (%)
Means of transportation to work - Bicycle (%)
Means of transportation to work - Walked (%)
Means of transportation to work - Other means (%)
Working at home (%)
Industry diversity
Most Common Industries - Agriculture, forestry, fishing and hunting, and mining (%)
Most Common Industries - Agriculture, forestry, fishing and hunting (%)
Most Common Industries - Mining, quarrying, and oil and gas extraction (%)
Most Common Industries - Construction (%)
Most Common Industries - Manufacturing (%)
Most Common Industries - Wholesale trade (%)
Most Common Industries - Retail trade (%)
Most Common Industries - Transportation and warehousing, and utilities (%)
Most Common Industries - Transportation and warehousing (%)
Most Common Industries - Utilities (%)
Most Common Industries - Information (%)
Most Common Industries - Finance and insurance, and real estate and rental and leasing (%)
Most Common Industries - Finance and insurance (%)
Most Common Industries - Real estate and rental and leasing (%)
Most Common Industries - Professional, scientific, and management, and administrative and waste management services (%)
Most Common Industries - Professional, scientific, and technical services (%)
Most Common Industries - Management of companies and enterprises (%)
Most Common Industries - Administrative and support and waste management services (%)
Most Common Industries - Educational services, and health care and social assistance (%)
Most Common Industries - Educational services (%)
Most Common Industries - Health care and social assistance (%)
Most Common Industries - Arts, entertainment, and recreation, and accommodation and food services (%)
Most Common Industries - Arts, entertainment, and recreation (%)
Most Common Industries - Accommodation and food services (%)
Most Common Industries - Other services, except public administration (%)
Most Common Industries - Public administration (%)
Occupation diversity
Most Common Occupations - Management, business, science, and arts occupations (%)
Most Common Occupations - Management, business, and financial occupations (%)
Most Common Occupations - Management occupations (%)
Most Common Occupations - Business and financial operations occupations (%)
Most Common Occupations - Computer, engineering, and science occupations (%)
Most Common Occupations - Computer and mathematical occupations (%)
Most Common Occupations - Architecture and engineering occupations (%)
Most Common Occupations - Life, physical, and social science occupations (%)
Most Common Occupations - Education, legal, community service, arts, and media occupations (%)
Most Common Occupations - Community and social service occupations (%)
Most Common Occupations - Legal occupations (%)
Most Common Occupations - Education, training, and library occupations (%)
Most Common Occupations - Arts, design, entertainment, sports, and media occupations (%)
Most Common Occupations - Healthcare practitioners and technical occupations (%)
Most Common Occupations - Health diagnosing and treating practitioners and other technical occupations (%)
Most Common Occupations - Health technologists and technicians (%)
Most Common Occupations - Service occupations (%)
Most Common Occupations - Healthcare support occupations (%)
Most Common Occupations - Protective service occupations (%)
Most Common Occupations - Fire fighting and prevention, and other protective service workers including supervisors (%)
Most Common Occupations - Law enforcement workers including supervisors (%)
Most Common Occupations - Food preparation and serving related occupations (%)
Most Common Occupations - Building and grounds cleaning and maintenance occupations (%)
Most Common Occupations - Personal care and service occupations (%)
Most Common Occupations - Sales and office occupations (%)
Most Common Occupations - Sales and related occupations (%)
Most Common Occupations - Office and administrative support occupations (%)
Most Common Occupations - Natural resources, construction, and maintenance occupations (%)
Most Common Occupations - Farming, fishing, and forestry occupations (%)
Most Common Occupations - Construction and extraction occupations (%)
Most Common Occupations - Installation, maintenance, and repair occupations (%)
Most Common Occupations - Production, transportation, and material moving occupations (%)
Most Common Occupations - Production occupations (%)
Most Common Occupations - Transportation occupations (%)
Most Common Occupations - Material moving occupations (%)
People in Group quarters - Institutionalized population (%)
People in Group quarters - Correctional institutions (%)
People in Group quarters - Federal prisons and detention centers (%)
People in Group quarters - Halfway houses (%)
People in Group quarters - Local jails and other confinement facilities (including police lockups) (%)
People in Group quarters - Military disciplinary barracks (%)
People in Group quarters - State prisons (%)
People in Group quarters - Other types of correctional institutions (%)
People in Group quarters - Nursing homes (%)
People in Group quarters - Hospitals/wards, hospices, and schools for the handicapped (%)
People in Group quarters - Hospitals/wards and hospices for chronically ill (%)
People in Group quarters - Hospices or homes for chronically ill (%)
People in Group quarters - Military hospitals or wards for chronically ill (%)
People in Group quarters - Other hospitals or wards for chronically ill (%)
People in Group quarters - Hospitals or wards for drug/alcohol abuse (%)
People in Group quarters - Mental (Psychiatric) hospitals or wards (%)
People in Group quarters - Schools, hospitals, or wards for the mentally retarded (%)
People in Group quarters - Schools, hospitals, or wards for the physically handicapped (%)
People in Group quarters - Institutions for the deaf (%)
People in Group quarters - Institutions for the blind (%)
People in Group quarters - Orthopedic wards and institutions for the physically handicapped (%)
People in Group quarters - Wards in general hospitals for patients who have no usual home elsewhere (%)
People in Group quarters - Wards in military hospitals for patients who have no usual home elsewhere (%)
People in Group quarters - Juvenile institutions (%)
People in Group quarters - Long-term care (%)
People in Group quarters - Homes for abused, dependent, and neglected children (%)
People in Group quarters - Residential treatment centers for emotionally disturbed children (%)
People in Group quarters - Training schools for juvenile delinquents (%)
People in Group quarters - Short-term care, detention or diagnostic centers for delinquent children (%)
People in Group quarters - Type of juvenile institution unknown (%)
People in Group quarters - Noninstitutionalized population (%)
People in Group quarters - College dormitories (includes college quarters off campus) (%)
People in Group quarters - Military quarters (%)
People in Group quarters - On base (%)
People in Group quarters - Barracks, unaccompanied personnel housing (UPH), (Enlisted/Officer), ;and similar group living quarters for military personnel (%)
People in Group quarters - Transient quarters for temporary residents (%)
People in Group quarters - Military ships (%)
People in Group quarters - Group homes (%)
People in Group quarters - Homes or halfway houses for drug/alcohol abuse (%)
People in Group quarters - Homes for the mentally ill (%)
People in Group quarters - Homes for the mentally retarded (%)
People in Group quarters - Homes for the physically handicapped (%)
People in Group quarters - Other group homes (%)
People in Group quarters - Religious group quarters (%)
People in Group quarters - Dormitories (%)
People in Group quarters - Agriculture workers' dormitories on farms (%)
People in Group quarters - Job Corps and vocational training facilities (%)
People in Group quarters - Other workers' dormitories (%)
People in Group quarters - Crews of maritime vessels (%)
People in Group quarters - Other nonhousehold living situations (%)
People in Group quarters - Other noninstitutional group quarters (%)
Residents speaking English at home (%)
Residents speaking English at home - Born in the United States (%)
Residents speaking English at home - Native, born elsewhere (%)
Residents speaking English at home - Foreign born (%)
Residents speaking Spanish at home (%)
Residents speaking Spanish at home - Born in the United States (%)
Residents speaking Spanish at home - Native, born elsewhere (%)
Residents speaking Spanish at home - Foreign born (%)
Residents speaking other language at home (%)
Residents speaking other language at home - Born in the United States (%)
Residents speaking other language at home - Native, born elsewhere (%)
Residents speaking other language at home - Foreign born (%)
Class of Workers - Employee of private company (%)
Class of Workers - Self-employed in own incorporated business (%)
Class of Workers - Private not-for-profit wage and salary workers (%)
Class of Workers - Local government workers (%)
Class of Workers - State government workers (%)
Class of Workers - Federal government workers (%)
Class of Workers - Self-employed workers in own not incorporated business and Unpaid family workers (%)
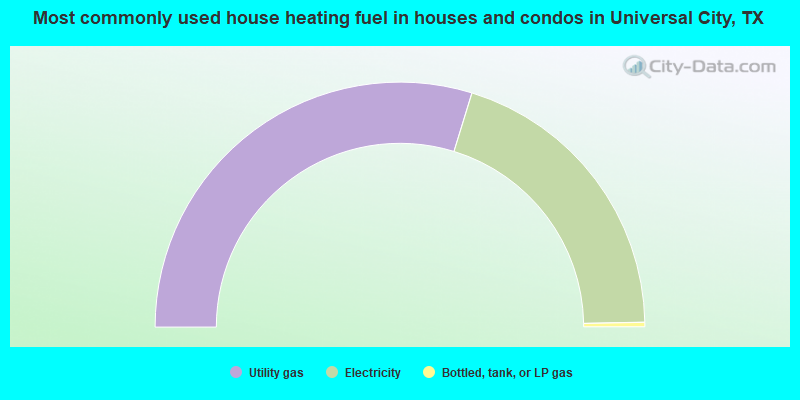
House heating fuel used in houses and condos - Utility gas (%)
House heating fuel used in houses and condos - Bottled, tank, or LP gas (%)
House heating fuel used in houses and condos - Electricity (%)
House heating fuel used in houses and condos - Fuel oil, kerosene, etc. (%)
House heating fuel used in houses and condos - Coal or coke (%)
House heating fuel used in houses and condos - Wood (%)
House heating fuel used in houses and condos - Solar energy (%)
House heating fuel used in houses and condos - Other fuel (%)
House heating fuel used in houses and condos - No fuel used (%)
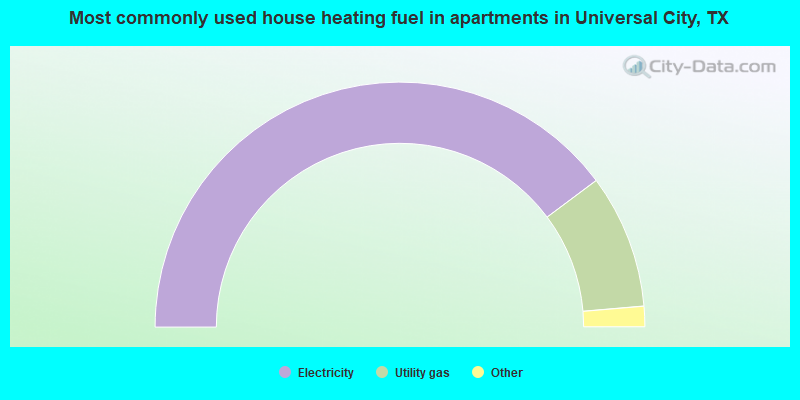
House heating fuel used in apartments - Utility gas (%)
House heating fuel used in apartments - Bottled, tank, or LP gas (%)
House heating fuel used in apartments - Electricity (%)
House heating fuel used in apartments - Fuel oil, kerosene, etc. (%)
House heating fuel used in apartments - Coal or coke (%)
House heating fuel used in apartments - Wood (%)
House heating fuel used in apartments - Solar energy (%)
House heating fuel used in apartments - Other fuel (%)
House heating fuel used in apartments - No fuel used (%)
Armed forces status - In Armed Forces (%)
Armed forces status - Civilian (%)
Armed forces status - Civilian - Veteran (%)
Armed forces status - Civilian - Nonveteran (%)
Fatal accidents locations in years 2005-2021
Fatal accidents locations in 2005
Fatal accidents locations in 2006
Fatal accidents locations in 2007
Fatal accidents locations in 2008
Fatal accidents locations in 2009
Fatal accidents locations in 2010
Fatal accidents locations in 2011
Fatal accidents locations in 2012
Fatal accidents locations in 2013
Fatal accidents locations in 2014
Fatal accidents locations in 2015
Fatal accidents locations in 2016
Fatal accidents locations in 2017
Fatal accidents locations in 2018
Fatal accidents locations in 2019
Fatal accidents locations in 2020
Fatal accidents locations in 2021
Alcohol use - People drinking some alcohol every month (%)
Alcohol use - People not drinking at all (%)
Alcohol use - Average days/month drinking alcohol
Alcohol use - Average drinks/week
Alcohol use - Average days/year people drink much
Audiometry - Average condition of hearing (%)
Audiometry - People that can hear a whisper from across a quiet room (%)
Audiometry - People that can hear normal voice from across a quiet room (%)
Audiometry - Ears ringing, roaring, buzzing (%)
Audiometry - Had a job exposure to loud noise (%)
Audiometry - Had off-work exposure to loud noise (%)
Blood Pressure & Cholesterol - Has high blood pressure (%)
Blood Pressure & Cholesterol - Checking blood pressure at home (%)
Blood Pressure & Cholesterol - Frequently checking blood cholesterol (%)
Blood Pressure & Cholesterol - Has high cholesterol level (%)
Consumer Behavior - Money monthly spent on food at supermarket/grocery store
Consumer Behavior - Money monthly spent on food at other stores
Consumer Behavior - Money monthly spent on eating out
Consumer Behavior - Money monthly spent on carryout/delivered foods
Consumer Behavior - Income spent on food at supermarket/grocery store (%)
Consumer Behavior - Income spent on food at other stores (%)
Consumer Behavior - Income spent on eating out (%)
Consumer Behavior - Income spent on carryout/delivered foods (%)
Current Health Status - General health condition (%)
Current Health Status - Blood donors (%)
Current Health Status - Has blood ever tested for HIV virus (%)
Current Health Status - Left-handed people (%)
Dermatology - People using sunscreen (%)
Diabetes - Diabetics (%)
Diabetes - Had a blood test for high blood sugar (%)
Diabetes - People taking insulin (%)
Diet Behavior & Nutrition - Diet health (%)
Diet Behavior & Nutrition - Milk product consumption (# of products/month)
Diet Behavior & Nutrition - Meals not home prepared (#/week)
Diet Behavior & Nutrition - Meals from fast food or pizza place (#/week)
Diet Behavior & Nutrition - Ready-to-eat foods (#/month)
Diet Behavior & Nutrition - Frozen meals/pizza (#/month)
Drug Use - People that ever used marijuana or hashish (%)
Drug Use - Ever used hard drugs (%)
Drug Use - Ever used any form of cocaine (%)
Drug Use - Ever used heroin (%)
Drug Use - Ever used methamphetamine (%)
Health Insurance - People covered by health insurance (%)
Kidney Conditions-Urology - Avg. # of times urinating at night
Medical Conditions - People with asthma (%)
Medical Conditions - People with anemia (%)
Medical Conditions - People with psoriasis (%)
Medical Conditions - People with overweight (%)
Medical Conditions - Elderly people having difficulties in thinking or remembering (%)
Medical Conditions - People who ever received blood transfusion (%)
Medical Conditions - People having trouble seeing even with glass/contacts (%)
Medical Conditions - People with arthritis (%)
Medical Conditions - People with gout (%)
Medical Conditions - People with congestive heart failure (%)
Medical Conditions - People with coronary heart disease (%)
Medical Conditions - People with angina pectoris (%)
Medical Conditions - People who ever had heart attack (%)
Medical Conditions - People who ever had stroke (%)
Medical Conditions - People with emphysema (%)
Medical Conditions - People with thyroid problem (%)
Medical Conditions - People with chronic bronchitis (%)
Medical Conditions - People with any liver condition (%)
Medical Conditions - People who ever had cancer or malignancy (%)
Mental Health - People who have little interest in doing things (%)
Mental Health - People feeling down, depressed, or hopeless (%)
Mental Health - People who have trouble sleeping or sleeping too much (%)
Mental Health - People feeling tired or having little energy (%)
Mental Health - People with poor appetite or overeating (%)
Mental Health - People feeling bad about themself (%)
Mental Health - People who have trouble concentrating on things (%)
Mental Health - People moving or speaking slowly or too fast (%)
Mental Health - People having thoughts they would be better off dead (%)
Oral Health - Average years since last visit a dentist
Oral Health - People embarrassed because of mouth (%)
Oral Health - People with gum disease (%)
Oral Health - General health of teeth and gums (%)
Oral Health - Average days a week using dental floss/device
Oral Health - Average days a week using mouthwash for dental problem
Oral Health - Average number of teeth
Pesticide Use - Households using pesticides to control insects (%)
Pesticide Use - Households using pesticides to kill weeds (%)
Physical Activity - People doing vigorous-intensity work activities (%)
Physical Activity - People doing moderate-intensity work activities (%)
Physical Activity - People walking or bicycling (%)
Physical Activity - People doing vigorous-intensity recreational activities (%)
Physical Activity - People doing moderate-intensity recreational activities (%)
Physical Activity - Average hours a day doing sedentary activities
Physical Activity - Average hours a day watching TV or videos
Physical Activity - Average hours a day using computer
Physical Functioning - People having limitations keeping them from working (%)
Physical Functioning - People limited in amount of work they can do (%)
Physical Functioning - People that need special equipment to walk (%)
Physical Functioning - People experiencing confusion/memory problems (%)
Physical Functioning - People requiring special healthcare equipment (%)
Prescription Medications - Average number of prescription medicines taking
Preventive Aspirin Use - Adults 40+ taking low-dose aspirin (%)
Reproductive Health - Vaginal deliveries (%)
Reproductive Health - Cesarean deliveries (%)
Reproductive Health - Deliveries resulted in a live birth (%)
Reproductive Health - Pregnancies resulted in a delivery (%)
Reproductive Health - Women breastfeeding newborns (%)
Reproductive Health - Women that had a hysterectomy (%)
Reproductive Health - Women that had both ovaries removed (%)
Reproductive Health - Women that have ever taken birth control pills (%)
Reproductive Health - Women taking birth control pills (%)
Reproductive Health - Women that have ever used Depo-Provera or injectables (%)
Reproductive Health - Women that have ever used female hormones (%)
Sexual Behavior - People 18+ that ever had sex (vaginal, anal, or oral) (%)
Sexual Behavior - Males 18+ that ever had vaginal sex with a woman (%)
Sexual Behavior - Males 18+ that ever performed oral sex on a woman (%)
Sexual Behavior - Males 18+ that ever had anal sex with a woman (%)
Sexual Behavior - Males 18+ that ever had any sex with a man (%)
Sexual Behavior - Females 18+ that ever had vaginal sex with a man (%)
Sexual Behavior - Females 18+ that ever performed oral sex on a man (%)
Sexual Behavior - Females 18+ that ever had anal sex with a man (%)
Sexual Behavior - Females 18+ that ever had any kind of sex with a woman (%)
Sexual Behavior - Average age people first had sex
Sexual Behavior - Average number of female sex partners in lifetime (males 18+)
Sexual Behavior - Average number of female vaginal sex partners in lifetime (males 18+)
Sexual Behavior - Average age people first performed oral sex on a woman (18+)
Sexual Behavior - Average number of woman performed oral sex on in lifetime (18+)
Sexual Behavior - Average number of male sex partners in lifetime (males 18+)
Sexual Behavior - Average number of male anal sex partners in lifetime (males 18+)
Sexual Behavior - Average age people first performed oral sex on a man (18+)
Sexual Behavior - Average number of male oral sex partners in lifetime (18+)
Sexual Behavior - People using protection when performing oral sex (%)
Sexual Behavior - Average number of times people have vaginal or anal sex a year
Sexual Behavior - People having sex without condom (%)
Sexual Behavior - Average number of male sex partners in lifetime (females 18+)
Sexual Behavior - Average number of male vaginal sex partners in lifetime (females 18+)
Sexual Behavior - Average number of female sex partners in lifetime (females 18+)
Sexual Behavior - Circumcised males 18+ (%)
Sleep Disorders - Average hours sleeping at night
Sleep Disorders - People that has trouble sleeping (%)
Smoking-Cigarette Use - People smoking cigarettes (%)
Taste & Smell - People 40+ having problems with smell (%)
Taste & Smell - People 40+ having problems with taste (%)
Taste & Smell - People 40+ that ever had wisdom teeth removed (%)
Taste & Smell - People 40+ that ever had tonsils teeth removed (%)
Taste & Smell - People 40+ that ever had a loss of consciousness because of a head injury (%)
Taste & Smell - People 40+ that ever had a broken nose or other serious injury to face or skull (%)
Taste & Smell - People 40+ that ever had two or more sinus infections (%)
Weight - Average height (inches)
Weight - Average weight (pounds)
Weight - Average BMI
Weight - People that are obese (%)
Weight - People that ever were obese (%)
Weight - People trying to lose weight (%)
According to our research of Texas and other state lists, there were 11 registered sex offenders living in Universal City, Texas as of April 18, 2024 . The ratio of all residents to sex offenders in Universal City is 1,861 to 1.The ratio of registered sex offenders to all residents in this city is much lower than the state average.
Officers per 1,000 residents here:
1.27Texas average:
2.07
Latest news from Universal City, TX collected exclusively by city-data.com from local newspapers, TV, and radio stations
Universal City, TX City Guides: Ancestries: German (6.4%), English (5.2%), Irish (4.0%), American (3.0%), European (1.1%), French (1.0%).
Current Local Time:
Land area: 5.65 square miles.
Population density: 3,538 people per square mile (average).
1,701 residents are foreign born (5.5% Latin America , 1.5% Asia , 0.9% Europe ).
This city:
8.4%Texas:
17.1%
Median real estate property taxes paid for housing units with mortgages in 2022: $5,509 (2.1%)Median real estate property taxes paid for housing units with no mortgage in 2022: $4,591 (1.7%)
Nearest city with pop. 50,000+: San Antonio, TX
Nearest cities:
Latitude: 29.55 N, Longitude: 98.30 W
Daytime population change due to commuting: -4,858 (-24.0%)Workers who live and work in this city: 1,298 (12.6%)
Property values in Universal City, TX
Single-family new house construction building permits:
2022: 78 buildings , average cost: $250,3002021: 103 buildings , average cost: $257,3002020: 88 buildings , average cost: $235,6002019: 73 buildings , average cost: $237,5002018: 68 buildings , average cost: $285,9002017: 66 buildings , average cost: $285,3002016: 36 buildings , average cost: $223,6002015: 67 buildings , average cost: $164,9002014: 7 buildings , average cost: $230,8002013: 15 buildings , average cost: $257,7002012: 5 buildings , average cost: $266,4002011: 25 buildings , average cost: $192,5002010: 23 buildings , average cost: $186,0002009: 6 buildings , average cost: $207,0002008: 14 buildings , average cost: $204,1002007: 26 buildings , average cost: $200,0002006: 65 buildings , average cost: $148,8002005: 215 buildings , average cost: $114,9002004: 206 buildings , average cost: $135,3002003: 180 buildings , average cost: $120,7002002: 162 buildings , average cost: $116,1002001: 47 buildings , average cost: $105,7002000: 46 buildings , average cost: $103,5001999: 59 buildings , average cost: $108,1001998: 103 buildings , average cost: $89,3001997: 100 buildings , average cost: $88,600Unemployment in December 2023:
Population change in the 1990s: +1,465 (+10.9%).
Most common occupations in Universal City, TX (%)
Both Males Females
Other sales and related occupations, including supervisors (5.4%)
Other management occupations, except farmers and farm managers (4.7%)
Preschool, kindergarten, elementary, and middle school teachers (4.4%)
Secretaries and administrative assistants (4.2%)
Other office and administrative support workers, including supervisors (3.5%)
Computer specialists (3.5%)
Cashiers (3.4%)
Other management occupations, except farmers and farm managers (5.7%)
Computer specialists (5.2%)
Other sales and related occupations, including supervisors (5.2%)
Sales representatives, services, wholesale and manufacturing (4.1%)
Electrical equipment mechanics and other installation, maintenance, and repair workers, including supervisors (3.7%)
Driver/sales workers and truck drivers (3.5%)
Vehicle and mobile equipment mechanics, installers, and repairers (3.5%)
Secretaries and administrative assistants (7.9%)
Preschool, kindergarten, elementary, and middle school teachers (7.9%)
Other office and administrative support workers, including supervisors (5.8%)
Other sales and related occupations, including supervisors (5.7%)
Cashiers (5.1%)
Information and record clerks, except customer service representatives (4.3%)
Retail sales workers, except cashiers (3.6%)
Tornado activity:
Universal City-area historical tornado activity is slightly below Texas state average. It is 2% greater than the overall U.S. average.
On 4/28/1953, a category F4 (max. wind speeds 207-260 mph) tornado 23.9 miles away from the Universal City city center killed 2 people and injured 15 people .
On 4/28/1953, a category F3 (max. wind speeds 158-206 mph) tornado 10.2 miles away from the city center killed one person and injured 5 people and caused between $50,000 and $500,000 in damages.
Earthquake activity:
Universal City-area historical earthquake activity is significantly above Texas state average. It is 26% smaller than the overall U.S. average. On 10/20/2011 at 12:24:41, a magnitude 4.8 (4.8 MW, Depth: 3.1 mi, Class: Light, Intensity: IV - V) earthquake occurred 49.4 miles away from Universal City center On 4/14/1995 at 00:32:56, a magnitude 5.7 (5.6 MB, 5.7 MS, 5.7 MW, Depth: 11.1 mi, Class: Moderate, Intensity: VI - VII) earthquake occurred 307.7 miles away from the city center On 4/9/1993 at 12:29:19, a magnitude 4.3 (4.1 MB, 4.3 LG, Depth: 3.1 mi) earthquake occurred 52.4 miles away from Universal City center On 6/16/1978 at 11:46:54, a magnitude 5.3 (4.4 MB, 4.6 UK, 5.3 ML) earthquake occurred 281.1 miles away from Universal City center On 5/1/2018 at 16:28:56, a magnitude 4.0 (4.0 MW, Depth: 3.1 mi) earthquake occurred 45.6 miles away from the city center On 4/7/2008 at 09:51:12, a magnitude 3.9 (3.9 MW, Depth: 3.1 mi, Class: Light, Intensity: II - III) earthquake occurred 46.7 miles away from Universal City center Magnitude types: regional Lg-wave magnitude (LG), body-wave magnitude (MB), local magnitude (ML), surface-wave magnitude (MS), moment magnitude (MW) Natural disasters: The number of natural disasters in Bexar County (21) is greater than the US average (15).Major Disasters (Presidential) Declared: 6Emergencies Declared: 10Hurricanes: 8, Fires: 7, Floods: 3, Storms: 3, Tropical Storms: 2, Tornado: 1, Other: 1 (Note: some incidents may be assigned to more than one category). Main business address for: AMERICAN ENERGY PRODUCTION INC BLANK CHECKS ).
Hospitals and medical centers in Universal City: GUILFORD FORGE COMMUNITY HOME (250 GUILFORD FORGE) Other hospitals and medical centers near Universal City: COUNCIL OAKS AT PHOENIX (Hospital, about 2 miles away; SELMA, TX)
COUNCIL OAKS AT SHALLOW CREEK (Hospital, about 3 miles away; SAN ANTONIO, TX)
COUNCIL OAKS AT SHALLOW RIDGE (Hospital, about 3 miles away; SAN ANTONIO, TX)
FMC - VILLAGE OAKS KIDNEY DISEASE CLINC (Dialysis Facility, about 3 miles away; LIVE OAK, TX)
SPRUCE RIDGE (Hospital, about 3 miles away; CONVERSE, TX)
NORTHEAST METHODIST HOSP TR (Nursing Home, about 3 miles away; SAN ANTONIO, TX)
SILVER TREE NURSING AND REHABILITATION CENTER (Nursing Home, about 3 miles away; SCHERTZ, TX)
Airports located in Universal City: Amtrak station near Universal City: 14 miles: SAN ANTONIO (224 HOEFGEN ST.) Services: ticket office, fully wheelchair accessible, enclosed waiting area, public restrooms, public payphones, vending machines, free short-term parking, call for taxi service.
Colleges/universities with over 2000 students nearest to Universal City:
University of the Incarnate Word (about 12 miles; San Antonio, TX ; Full-time enrollment: 6,875)
Trinity University (about 13 miles; San Antonio, TX ; FT enrollment: 2,467)
St Philip's College (about 14 miles; San Antonio, TX ; FT enrollment: 5,970)
San Antonio College (about 14 miles; San Antonio, TX ; FT enrollment: 15,182)
Our Lady of the Lake University (about 17 miles; San Antonio, TX ; FT enrollment: 2,133)
The University of Texas at San Antonio (about 20 miles; San Antonio, TX ; FT enrollment: 25,503)
Palo Alto College (about 22 miles; San Antonio, TX ; FT enrollment: 5,055)
Private high school in Universal City: FIRST BAPTIST ACADEMY OF UNIVERSAL CITY Students: 461, Location: 1401 PAT BOOKER RD, Grades: PK-12)
Public elementary/middle schools in Universal City: KITTY HAWK MIDDLE Students: 1,429, Location: 840 OLD CIMMARON TRL, Grades: 6-8)RICARDO SALINAS EL Students: 809, Location: 10560 OLD CIMMARON TRL, Grades: PK-5)OLYMPIA EL Students: 806, Location: 8439 ATHENIAN, Grades: PK-5)CORONADO VILLAGE EL Students: 455, Location: 213 AMISTAD BLVD, Grades: PK-5)ROSE GARDEN EL Students: 387, Location: 506 N BLVD, Grades: PK-4)RADIANCE ACADEMY OF LEARNING (DAYSTAR) Students: 83, Location: 413 KITTY HAWK RD, Grades: PK-5, Charter school )See full list of schools located in Universal City Library in Universal City: UNIVERSAL CITY PUBLIC LIBRARY Operating income: $173,662; Location: 100 NORTHVIEW DR; 23,830 books ; 749 audio materials ; 1,317 video materials ; 1 local licensed databases ; 50 state licensed databases ; 2 other licensed databases ; 58 print serial subscriptions )
Notable locations in Universal City: (A) , Schertz Emergency Medical Services (B) . Display/hide their locations on the map
Main business address in Universal City: (A) . Display/hide its location on the map
Churches in Universal City include: (A) , Saint Matthews Episcopal Church (B) , Universal City United Methodist Church (C) , Calvary Chapel of San Antonio Church (D) , The Hanmi Presbyterian Church (E) , Harvest Time Community Church (F) , Grace Community Church (G) , Tabernacle Baptist Church (H) . Display/hide their locations on the map
Parks in Universal City include: (1) , Red Horse Park (2) , Universal City Park (3) . Display/hide their locations on the map
Hotel:
Bexar County has a predicted average indoor radon screening level less than 2 pCi/L (pico curies per liter) - Low Potential Average household size: This city:
2.5 peopleTexas:
2.8 people
Percentage of family households: This city:
65.7%Whole state:
69.9%
Percentage of households with unmarried partners: This city:
6.7%Whole state:
6.0%
Likely homosexual households (counted as self-reported same-sex unmarried-partner households)
Lesbian couples: 0.4% of all households Gay men: 0.1% of all households
6 people in group homes intended for adults in 2010People in group quarters in Universal City in 2000:
36 people in homes for the mentally retarded
7 people in other group homes
4 people in homes or halfway houses for drug/alcohol abuse
Banks with branches in Universal City (2011 data):
JPMorgan Chase Bank, National Association: Kitty Hawk Banking Center at 912 Kitty Hawk Rd, branch established on 2011/11/15; Pat Booker Branch at 2921 Pat Booker, Ste 100, branch established on 2002/10/03. Info updated 2011/11/10: Bank assets: $1,811,678.0 mil, Deposits: $1,190,738.0 mil, headquarters in Columbus, OH, positive income , International Specialization, 5577 total offices , Holding Company: Jpmorgan Chase & Co.
TexStar National Bank: Texstar National Bank at 600 Pat Booker Rd., branch established on 2004/01/20. Info updated 2006/11/03: Bank assets: $187.5 mil, Deposits: $167.5 mil, local headquarters , positive income , Commercial Lending Specialization, 5 total offices , Holding Company: Texstar Bancshares, Inc.
Bank of America, National Association: Randolph Branch at 3000 Pat Booker Road, branch established on 1980/03/03. Info updated 2009/11/18: Bank assets: $1,451,969.3 mil, Deposits: $1,077,176.8 mil, headquarters in Charlotte, NC, positive income , 5782 total offices , Holding Company: Bank Of America Corporation
For population 15 years and over in Universal City:
Never married: 31.9%Now married: 47.9%Separated: 2.2%Widowed: 3.9%Divorced: 14.1% For population 25 years and over in Universal City:
High school or higher: 95.0%Bachelor's degree or higher: 31.9%Graduate or professional degree: 11.0%Unemployed: 3.4%Mean travel time to work (commute): 25.5 minutes
Education Gini index (Inequality in education) Here:
9.5Texas average:
14.0
Religion statistics for Universal City, TX (based on Bexar County data)
Religion Adherents Congregations Catholic 528,827 104 Evangelical Protestant 288,534 765 Mainline Protestant 78,855 149 Other 61,554 122 Black Protestant 8,961 42 Orthodox 1,004 7 None 747,038 -
Source: Clifford Grammich, Kirk Hadaway, Richard Houseal, Dale E.Jones, Alexei Krindatch, Richie Stanley and Richard H.Taylor. 2012. 2010 U.S.Religion Census: Religious Congregations & Membership Study. Association of Statisticians of American Religious Bodies. Jones, Dale E., et al. 2002. Congregations and Membership in the United States 2000. Nashville, TN: Glenmary Research Center. Graphs represent county-level data
Food Environment Statistics: Number of grocery stores : 162Bexar County :
1.02 / 10,000 pop.Texas :
1.47 / 10,000 pop.
Number of supercenters and club stores : 19Bexar County :
0.12 / 10,000 pop.Texas :
0.14 / 10,000 pop.
Number of convenience stores (no gas) : 181Bexar County :
1.14 / 10,000 pop.Texas :
1.11 / 10,000 pop.
Number of convenience stores (with gas) : 487Bexar County :
3.06 / 10,000 pop.State :
3.95 / 10,000 pop.
Number of full-service restaurants : 1,073Bexar County :
6.75 / 10,000 pop.Texas :
6.13 / 10,000 pop.
Adult diabetes rate : Bexar County :
8.3%Texas :
8.9%
Adult obesity rate : This county :
26.3%State :
26.6%
Low-income preschool obesity rate : Bexar County :
16.8%State :
15.7%
Health and Nutrition:
Average overall health of teeth and gums : Average BMI : Universal City:
28.7State:
28.5
People feeling badly about themselves : This city:
20.1%Texas:
20.6%
People not drinking alcohol at all : This city:
10.5%State:
10.3%
Average hours sleeping at night : Overweight people : This city:
34.9%State:
33.1%
General health condition : This city:
57.1%Texas:
56.2%
Average condition of hearing : Universal City:
79.7%State:
80.7%
More about Health and Nutrition of Universal City, TX Residents
Local government employment and payroll (March 2022)
Function
Full-time employees
Monthly full-time payroll
Average yearly full-time wage
Part-time employees
Monthly part-time payroll
Police Protection - Officers
26 $162,854 $75,163 0 $0 Firefighters
23 $138,641 $72,334 0 $0 Parks and Recreation
14 $67,425 $57,793 28 $38,712 Water Supply
12 $69,546 $69,546 0 $0 Police - Other
10 $39,071 $46,885 0 $0 Streets and Highways
10 $43,473 $52,168 0 $0 Other and Unallocable
10 $54,905 $65,886 1 $3,193 Health
6 $29,401 $58,802 1 $1,738 Financial Administration
5 $25,553 $61,327 1 $1,922 Other Government Administration
3 $33,540 $134,160 7 $220 Judicial and Legal
3 $12,688 $50,752 0 $0 Sewerage
2 $9,539 $57,234 0 $0 Local Libraries
2 $9,484 $56,904 3 $4,136 Fire - Other
1 $4,982 $59,784 0 $0 Natural Resources
1 $6,528 $78,336 0 $0 Solid Waste Management
1 $5,033 $60,396 0 $0
Totals for Government
129 $712,663 $66,294 41 $49,922
Universal City government finances - Expenditure in 2017 (per resident):
Construction - Libraries: $2,194,000 ($109.75)
Regular Highways: $536,000 ($26.81)Parks and Recreation: $93,000 ($4.65)Water Utilities: $3,000 ($0.15)Current Operations - General - Other: $2,877,000 ($143.92)
Water Utilities: $2,810,000 ($140.57)Police Protection: $2,608,000 ($130.47)Parks and Recreation: $1,830,000 ($91.55)Local Fire Protection: $1,501,000 ($75.09)Central Staff Services: $1,277,000 ($63.88)Regular Highways: $934,000 ($46.72)Financial Administration: $289,000 ($14.46)Sewerage: $186,000 ($9.30)Judicial and Legal Services: $180,000 ($9.00)Libraries: $154,000 ($7.70)Intergovernmental to Local - Other - Sewerage: $1,543,000 ($77.19)
Other - General - Other: $255,000 ($12.76)Other Capital Outlay - Local Fire Protection: $171,000 ($8.55)
Police Protection: $99,000 ($4.95)Parks and Recreation: $81,000 ($4.05)Central Staff Services: $78,000 ($3.90)Judicial and Legal Services: $65,000 ($3.25)Regular Highways: $27,000 ($1.35)Total Salaries and Wages: $7,318,000 ($366.08)
Water Utilities - Interest on Debt: $637,000 ($31.87)
Universal City government finances - Revenue in 2017 (per resident):
Charges - Sewerage: $3,007,000 ($150.43)
Parks and Recreation: $1,639,000 ($81.99)Other: $380,000 ($19.01)Miscellaneous - Fines and Forfeits: $1,195,000 ($59.78)
Rents: $181,000 ($9.05)General Revenue - Other: $130,000 ($6.50)Donations From Private Sources: $99,000 ($4.95)Interest Earnings: $36,000 ($1.80)Sale of Property: $34,000 ($1.70)Revenue - Water Utilities: $4,226,000 ($211.41)
State Intergovernmental - General Local Government Support: $51,000 ($2.55)
Other: $4,000 ($0.20)Tax - Property: $5,951,000 ($297.70)
General Sales and Gross Receipts: $2,890,000 ($144.57)Public Utilities Sales: $1,450,000 ($72.54)Occupation and Business License - Other: $1,091,000 ($54.58)Other Selective Sales: $127,000 ($6.35)Other License: $23,000 ($1.15)Alcoholic Beverage License: $4,000 ($0.20)
Universal City government finances - Debt in 2017 (per resident):
Long Term Debt - Outstanding Unspecified Public Purpose: $30,804,000 ($1540.97)
Beginning Outstanding - Unspecified Public Purpose: $27,492,000 ($1375.29)Beginning Outstanding - Public Debt for Private Purpose: $10,835,000 ($542.02)Outstanding Nonguaranteed - Industrial Revenue: $10,095,000 ($505.00)Issue, Unspecified Public Purpose: $5,345,000 ($267.38)Retired Unspecified Public Purpose: $2,033,000 ($101.70)Retired Nonguaranteed - Public Debt for Private Purpose: $740,000 ($37.02)
Universal City government finances - Cash and Securities in 2017 (per resident):
Bond Funds - Cash and Securities: $8,598,000 ($430.12)
Other Funds - Cash and Securities: $18,573,000 ($929.11)
Sinking Funds - Cash and Securities: $12,436,000 ($622.11)
5.98% of this county's 2021 resident taxpayers lived in other counties in 2020 ($64,274 average adjusted gross income )
Here:
5.98%Texas average:
8.12%
0.12% of residents moved from foreign countries ($1,410 average AGI )Bexar County:
0.12%Texas average:
0.04%
Top counties from which taxpayers relocated into this county between 2020 and 2021:
5.48% of this county's 2020 resident taxpayers moved to other counties in 2021 ($65,369 average adjusted gross income )
Here:
5.48%Texas average:
7.40%
0.09% of residents moved to foreign countries ($1,244 average AGI )Bexar County:
0.09%Texas average:
0.03%
Top counties to which taxpayers relocated from this county between 2020 and 2021:
Businesses in Universal City, TX
Name Count Name Count
Advance Auto Parts 1 Penske 1 Arby's 1 Pizza Hut 1 AutoZone 1 Popeyes 1 CVS 1 RadioShack 1 Church's Chicken 1 SONIC Drive-In 1 Cricket Wireless 2 Subway 2 Curves 1 Super 8 1 Domino's Pizza 1 T-Mobile 1 FedEx 2 Taco Bell 1 Firestone Complete Auto Care 1 True Value 1 H&R Block 2 U-Haul 2 KFC 1 UPS 2 Little Caesars Pizza 1 Wendy's 1 McDonald's 1
Strongest AM radio stations in Universal City:
KTKR (760 AM; 50 kW; SAN ANTONIO, TX; Owner: CCB TEXAS LICENSES, L.P.)
KDRY (1100 AM; 11 kW; ALAMO HEIGHTS, TX; Owner: KDRY RADIO, INC.)
WOAI (1200 AM; 50 kW; SAN ANTONIO, TX; Owner: CCB TEXAS LICENSES, L.P.)
KSAH (720 AM; 10 kW; UNIVERSAL CITY, TX; Owner: KSAH LICENSING, INC.)
KTSA (550 AM; 5 kW; SAN ANTONIO, TX; Owner: INFINITY BROADCASTING CORPORATION OF SAN ANTONIO)
KLUP (930 AM; 5 kW; TERRELL HILLS, TX; Owner: SOUTH TEXAS BROADCASTING, INC.)
KKYX (680 AM; 50 kW; SAN ANTONIO, TX; Owner: CXR HOLDINGS, INC.)
KSLR (630 AM; 5 kW; SAN ANTONIO, TX; Owner: SALEM MEDIA OF TEXAS, INC.)
KONO (860 AM; 5 kW; SAN ANTONIO, TX; Owner: CXR HOLDINGS, INC.)
KENS (1160 AM; 25 kW; SAN ANTONIO, TX; Owner: KENS-TV, INC.)
KXTN (1310 AM; 5 kW; SAN ANTONIO, TX)
KEDA (1540 AM; 5 kW; SAN ANTONIO, TX; Owner: D & E BROADCASTING CO., INC.)
KCHL (1480 AM; 2 kW; SAN ANTONIO, TX; Owner: MARTIN BROADCASTING, INC.)
Strongest FM radio stations in Universal City:
KXXM (96.1 FM; SAN ANTONIO, TX; Owner: CCB TEXAS LICENSES, L.P.)
KXTN-FM (107.5 FM; SAN ANTONIO, TX; Owner: TICHENOR LICENSE CORPORATION ("TLC"))
KROM (92.9 FM; SAN ANTONIO, TX; Owner: TICHENOR LICENSE CORPORATION ("TLC"))
KYFS (90.9 FM; SAN ANTONIO, TX; Owner: BIBLE BROADCASTING NETWORK, INC.)
KSMG (105.3 FM; SEGUIN, TX; Owner: CXR HOLDINGS, INC.)
KCYY (100.3 FM; SAN ANTONIO, TX; Owner: CXR HOLDINGS, INC.)
KISS-FM (99.5 FM; SAN ANTONIO, TX; Owner: CXR HOLDINGS, INC.)
KQXT-FM (101.9 FM; SAN ANTONIO, TX; Owner: CCB TEXAS LICENSES, L.P.)
KTFM (102.7 FM; SAN ANTONIO, TX; Owner: INFINITY BROADCASTING CORPORATION OF SAN ANTONIO)
KZEP-FM (104.5 FM; SAN ANTONIO, TX; Owner: TEXAS LOTUS LTD.)
KONO-FM (101.1 FM; HELOTES, TX; Owner: CXR HOLDINGS, INC.)
KAJA (97.3 FM; SAN ANTONIO, TX; Owner: CCB TEXAS LICENSES, L.P.)
KSTX (89.1 FM; SAN ANTONIO, TX; Owner: TEXAS PUBLIC RADIO)
KCJZ (106.7 FM; TERRELL HILLS, TX; Owner: CXR HOLDINGS, INC.)
KTSW (89.9 FM; SAN MARCOS, TX; Owner: SOUTHWEST TEXAS STATE UNIVERSITY)
K237AS (95.3 FM; SAN ANTONIO, TX; Owner: CXR HOLDINGS, INC.)
K279AB (103.7 FM; SAN ANTONIO, TX; Owner: WILDCATTER WIRELESS, LLC)
KPAC (88.3 FM; SAN ANTONIO, TX; Owner: TEXAS PUBLIC RADIO)
KEYI-FM (103.5 FM; SAN MARCOS, TX; Owner: EMMIS AUSTIN RADIO BROADCASTING COMPANY, L.P.)
KLEY-FM (94.1 FM; FLORESVILLE, TX; Owner: KLEY LICENSING, INC.)
TV broadcast stations around Universal City:
KENS-TV (Channel 5; SAN ANTONIO, TX; Owner: KENS-TV, INC.)
KJLF-LP (Channel 7; SAN ANTONIO, TX; Owner: B COMMUNICATIONS JOINT VENTURE)
KXTM-LP (Channel 21; SAN ANTONIO, TX; Owner: HUMBERTO LOPEZ)
KVDA (Channel 60; SAN ANTONIO, TX; Owner: TELEMUNDO OF TEXAS PARTNERSHIP, LP)
KABB (Channel 29; SAN ANTONIO, TX; Owner: KABB LICENSEE, LLC)
KEVI-LP (Channel 25; SAN ANTONIO, TX; Owner: KEVIN ORTIZ)
KWEX-TV (Channel 41; SAN ANTONIO, TX; Owner: KWEX LICENSE PARTNERSHIP, L.P.)
KLRN (Channel 9; SAN ANTONIO, TX; Owner: ALAMO PUBLIC TELECOMMUNICATIONS COUNCIL)
WOAI-TV (Channel 4; SAN ANTONIO, TX; Owner: CCB TEXAS LICENSES, L.P.)
KSAA-LP (Channel 28; SAN ANTONIO, TX; Owner: MAKO COMMUNICATIONS, LLC)
KSAT-TV (Channel 12; SAN ANTONIO, TX; Owner: POST-NEWSWEEK STATIONS, SAN ANTONIO, LP)
KRRT (Channel 35; KERRVILLE, TX; Owner: SAN ANTONIO (KRRT-TV) LICENSEE, INC.)
K45FJ (Channel 45; SAN ANTONIO, TX; Owner: TRINITY BROADCASTING NETWORK)
KMHZ-LP (Channel 65; SAN ANTONIO, TX; Owner: LOUIS MARTINEZ FAMILY GROUP, LLC)
KHCE (Channel 23; SAN ANTONIO, TX; Owner: SAN ANTONIO COMMUNITY EDUCATIONAL TV, INC.)
KFTO-CA (Channel 67; SAN ANTONIO, TX; Owner: TELEFUTURA PARTNERSHIP OF SAN ANTONIO)
KNIC-CA (Channel 17; SAN ANTONIO, TX; Owner: TELEFUTURA PARTNERSHIP OF SAN ANTONIO)
KTDF-LP (Channel 18; SAN ANTONIO, TX; Owner: JOSEPH W. SHAFFER)
K52EA (Channel 52; SAN ANTONIO, TX; Owner: ORTIZ BROADCASTING CORPORATION)
KQVE-LP (Channel 46; La VERNIA, TX; Owner: WORD OF GOD FELLOWSHIP, INC.)
K31EX (Channel 31; SAN ANTONIO, TX; Owner: MAKO COMMUNICATIONS, LLC)
KBNB-LP (Channel 10; SAN ANTONIO, TX; Owner: B COMMUNICATIONS JOINT VENTURE)
KGMM-CA (Channel 58; SAN ANTONIO, TX; Owner: CABALLERO TELEVISION TEXAS, L.L.C.)
K45DX (Channel 45; FLORESVILLE, TX; Owner: TELEFUTURA PARTNERSHIP OF FLORESVILLE)
KPXL (Channel 26; UVALDE, TX; Owner: PAXSON SAN ANTONIO LICENSE, INC.)
Home Mortgage Disclosure Act Aggregated Statistics For Year 2009(Based on 1 full and 3 partial tracts) A) FHA, FSA/RHS & VA B) Conventional C) Refinancings D) Home Improvement Loans E) Loans on Dwellings For 5+ Families F) Non-occupant Loans on G) Loans On Manufactured Number Average Value Number Average Value Number Average Value Number Average Value Number Average Value Number Average Value Number Average Value
LOANS ORIGINATED 98 $140,083 57 $121,682 222 $122,533 43 $29,555 3 $3,027,590 29 $113,024 2 $54,280 APPLICATIONS APPROVED, NOT ACCEPTED 4 $106,902 6 $81,775 28 $132,081 4 $43,288 0 $0 1 $139,680 0 $0 APPLICATIONS DENIED 11 $127,354 17 $77,833 69 $132,796 26 $25,105 0 $0 13 $79,404 2 $28,730 APPLICATIONS WITHDRAWN 7 $134,147 5 $113,566 55 $127,616 8 $51,820 0 $0 4 $162,525 0 $0 FILES CLOSED FOR INCOMPLETENESS 1 $160,040 2 $135,720 7 $122,321 2 $18,690 0 $0 2 $135,720 0 $0
Aggregated Statistics For Year 2008(Based on 1 full and 3 partial tracts) A) FHA, FSA/RHS & VA B) Conventional C) Refinancings D) Home Improvement Loans E) Loans on Dwellings For 5+ Families F) Non-occupant Loans on G) Loans On Manufactured Number Average Value Number Average Value Number Average Value Number Average Value Number Average Value Number Average Value Number Average Value
LOANS ORIGINATED 86 $144,031 104 $130,988 142 $103,921 46 $29,787 1 $4,910,630 43 $100,738 2 $40,760 APPLICATIONS APPROVED, NOT ACCEPTED 6 $151,843 15 $140,205 18 $110,512 8 $35,574 0 $0 5 $76,970 1 $68,300 APPLICATIONS DENIED 7 $132,539 29 $136,948 63 $106,303 46 $30,281 0 $0 20 $134,329 3 $19,137 APPLICATIONS WITHDRAWN 5 $130,884 11 $139,319 44 $118,376 4 $100,380 0 $0 9 $109,134 0 $0 FILES CLOSED FOR INCOMPLETENESS 2 $122,385 5 $162,100 8 $105,676 1 $11,820 0 $0 2 $239,710 1 $16,010
Aggregated Statistics For Year 2007(Based on 1 full and 3 partial tracts) A) FHA, FSA/RHS & VA B) Conventional C) Refinancings D) Home Improvement Loans E) Loans on Dwellings For 5+ Families F) Non-occupant Loans on G) Loans On Manufactured Number Average Value Number Average Value Number Average Value Number Average Value Number Average Value Number Average Value Number Average Value
LOANS ORIGINATED 61 $139,287 265 $115,318 134 $96,136 45 $33,934 1 $11,550,000 70 $140,634 1 $72,920 APPLICATIONS APPROVED, NOT ACCEPTED 8 $135,608 44 $144,057 21 $99,031 15 $24,874 0 $0 13 $192,133 1 $50,780 APPLICATIONS DENIED 6 $92,020 61 $114,808 131 $102,956 62 $40,541 1 $9,748,500 22 $123,451 10 $48,619 APPLICATIONS WITHDRAWN 4 $184,535 32 $159,877 60 $111,818 10 $33,278 0 $0 15 $186,139 0 $0 FILES CLOSED FOR INCOMPLETENESS 0 $0 6 $98,358 24 $128,956 1 $27,890 0 $0 3 $89,733 0 $0
Aggregated Statistics For Year 2006(Based on 1 full and 3 partial tracts) A) FHA, FSA/RHS & VA B) Conventional C) Refinancings D) Home Improvement Loans E) Loans on Dwellings For 5+ Families F) Non-occupant Loans on G) Loans On Manufactured Number Average Value Number Average Value Number Average Value Number Average Value Number Average Value Number Average Value Number Average Value
LOANS ORIGINATED 109 $135,459 382 $91,367 126 $96,907 65 $32,659 2 $2,489,390 99 $85,280 5 $48,660 APPLICATIONS APPROVED, NOT ACCEPTED 3 $165,687 53 $88,248 20 $110,429 8 $29,931 0 $0 13 $92,142 6 $39,692 APPLICATIONS DENIED 7 $95,537 79 $80,658 151 $100,306 59 $35,009 0 $0 22 $85,877 21 $45,698 APPLICATIONS WITHDRAWN 10 $130,671 53 $93,479 120 $107,637 5 $58,750 0 $0 21 $82,780 0 $0 FILES CLOSED FOR INCOMPLETENESS 1 $131,680 4 $85,268 20 $100,496 1 $10,000 0 $0 1 $119,810 0 $0
Aggregated Statistics For Year 2005(Based on 1 full and 3 partial tracts) A) FHA, FSA/RHS & VA B) Conventional C) Refinancings D) Home Improvement Loans E) Loans on Dwellings For 5+ Families F) Non-occupant Loans on G) Loans On Manufactured Number Average Value Number Average Value Number Average Value Number Average Value Number Average Value Number Average Value Number Average Value
LOANS ORIGINATED 107 $126,362 353 $86,528 169 $90,409 54 $41,588 2 $631,300 109 $96,400 0 $0 APPLICATIONS APPROVED, NOT ACCEPTED 2 $148,845 44 $104,388 31 $92,718 11 $48,607 0 $0 21 $144,203 6 $33,210 APPLICATIONS DENIED 7 $143,207 84 $76,006 142 $83,644 47 $34,016 1 $960,300 31 $77,375 23 $45,651 APPLICATIONS WITHDRAWN 9 $133,954 36 $93,176 77 $104,321 24 $156,908 0 $0 11 $101,991 0 $0 FILES CLOSED FOR INCOMPLETENESS 1 $247,950 10 $83,431 57 $108,942 2 $34,375 0 $0 5 $84,838 0 $0
Aggregated Statistics For Year 2004(Based on 1 full and 3 partial tracts) A) FHA, FSA/RHS & VA B) Conventional C) Refinancings D) Home Improvement Loans E) Loans on Dwellings For 5+ Families F) Non-occupant Loans on G) Loans On Manufactured Number Average Value Number Average Value Number Average Value Number Average Value Number Average Value Number Average Value Number Average Value
LOANS ORIGINATED 136 $118,939 253 $93,177 250 $88,968 37 $36,341 1 $2,528,000 61 $72,986 2 $31,685 APPLICATIONS APPROVED, NOT ACCEPTED 4 $149,360 38 $84,714 32 $90,318 5 $17,836 0 $0 8 $65,866 6 $44,880 APPLICATIONS DENIED 12 $120,531 65 $71,798 150 $84,366 37 $32,820 0 $0 18 $89,008 16 $46,871 APPLICATIONS WITHDRAWN 20 $109,134 33 $97,292 124 $89,751 9 $66,843 0 $0 14 $69,368 2 $58,195 FILES CLOSED FOR INCOMPLETENESS 1 $90,540 10 $65,302 77 $97,994 5 $64,820 0 $0 3 $91,410 0 $0
Aggregated Statistics For Year 2003(Based on 1 full and 3 partial tracts) A) FHA, FSA/RHS & VA B) Conventional C) Refinancings D) Home Improvement Loans F) Non-occupant Loans on Number Average Value Number Average Value Number Average Value Number Average Value Number Average Value
LOANS ORIGINATED 182 $121,723 197 $89,881 507 $93,884 23 $24,053 55 $74,389 APPLICATIONS APPROVED, NOT ACCEPTED 7 $129,969 14 $79,380 43 $83,177 3 $47,810 6 $73,230 APPLICATIONS DENIED 10 $116,629 60 $52,358 203 $79,265 17 $25,025 19 $62,615 APPLICATIONS WITHDRAWN 27 $117,396 15 $104,647 115 $89,299 1 $33,000 5 $73,314 FILES CLOSED FOR INCOMPLETENESS 1 $121,410 6 $84,182 22 $93,366 2 $58,465 3 $83,663
Aggregated Statistics For Year 2002(Based on 1 full and 3 partial tracts) A) FHA, FSA/RHS & VA B) Conventional C) Refinancings D) Home Improvement Loans E) Loans on Dwellings For 5+ Families F) Non-occupant Loans on Number Average Value Number Average Value Number Average Value Number Average Value Number Average Value Number Average Value
LOANS ORIGINATED 126 $108,852 153 $91,629 306 $91,801 26 $19,199 1 $10,767,000 32 $67,224 APPLICATIONS APPROVED, NOT ACCEPTED 3 $138,407 19 $71,799 41 $80,747 7 $21,361 0 $0 5 $67,824 APPLICATIONS DENIED 8 $111,611 48 $67,857 82 $74,581 22 $18,597 0 $0 10 $74,736 APPLICATIONS WITHDRAWN 11 $115,033 12 $125,728 71 $83,141 3 $9,773 0 $0 4 $53,778 FILES CLOSED FOR INCOMPLETENESS 1 $107,670 8 $87,336 23 $84,473 0 $0 0 $0 0 $0
Aggregated Statistics For Year 2001(Based on 1 full and 3 partial tracts) A) FHA, FSA/RHS & VA B) Conventional C) Refinancings D) Home Improvement Loans E) Loans on Dwellings For 5+ Families F) Non-occupant Loans on Number Average Value Number Average Value Number Average Value Number Average Value Number Average Value Number Average Value
LOANS ORIGINATED 125 $99,928 113 $78,949 167 $80,637 33 $15,290 1 $2,175,000 24 $57,528 APPLICATIONS APPROVED, NOT ACCEPTED 3 $86,573 15 $56,559 19 $88,598 7 $31,857 0 $0 6 $48,553 APPLICATIONS DENIED 6 $91,273 72 $52,644 68 $70,699 17 $19,918 0 $0 8 $50,375 APPLICATIONS WITHDRAWN 8 $99,442 8 $97,851 41 $87,385 5 $21,624 0 $0 3 $44,820 FILES CLOSED FOR INCOMPLETENESS 0 $0 2 $60,605 11 $84,045 2 $9,060 0 $0 1 $88,090
Aggregated Statistics For Year 2000(Based on 1 full and 3 partial tracts) A) FHA, FSA/RHS & VA B) Conventional C) Refinancings D) Home Improvement Loans E) Loans on Dwellings For 5+ Families F) Non-occupant Loans on Number Average Value Number Average Value Number Average Value Number Average Value Number Average Value Number Average Value
LOANS ORIGINATED 112 $90,178 114 $83,697 50 $68,389 24 $16,875 1 $292,000 10 $46,734 APPLICATIONS APPROVED, NOT ACCEPTED 8 $66,305 33 $61,840 13 $49,190 11 $20,385 0 $0 3 $42,177 APPLICATIONS DENIED 7 $81,387 71 $48,540 25 $75,628 18 $17,459 0 $0 6 $30,735 APPLICATIONS WITHDRAWN 5 $102,730 10 $80,989 17 $65,842 1 $12,640 0 $0 3 $89,330 FILES CLOSED FOR INCOMPLETENESS 2 $96,160 3 $45,087 11 $55,179 2 $20,500 0 $0 2 $41,455
Aggregated Statistics For Year 1999(Based on 1 full and 3 partial tracts) A) FHA, FSA/RHS & VA B) Conventional C) Refinancings D) Home Improvement Loans E) Loans on Dwellings For 5+ Families F) Non-occupant Loans on Number Average Value Number Average Value Number Average Value Number Average Value Number Average Value Number Average Value
LOANS ORIGINATED 121 $90,656 117 $80,224 98 $75,500 31 $16,508 1 $145,070 17 $56,412 APPLICATIONS APPROVED, NOT ACCEPTED 7 $91,809 41 $55,495 27 $80,492 11 $19,418 0 $0 5 $55,728 APPLICATIONS DENIED 10 $74,598 90 $54,722 35 $58,913 43 $16,597 0 $0 9 $44,623 APPLICATIONS WITHDRAWN 13 $89,093 21 $93,427 30 $73,166 5 $13,380 0 $0 4 $66,020 FILES CLOSED FOR INCOMPLETENESS 0 $0 4 $76,258 18 $64,154 1 $13,200 0 $0 0 $0
Detailed HMDA statistics for the following Tracts:
1216.01
, 1216.03 , 1216.04 , 1217.00
Private Mortgage Insurance Companies Aggregated Statistics For Year 2009(Based on 1 full and 3 partial tracts) A) Conventional B) Refinancings C) Non-occupant Loans on Number Average Value Number Average Value Number Average Value
LOANS ORIGINATED 8 $171,680 6 $125,788 1 $51,780 APPLICATIONS APPROVED, NOT ACCEPTED 1 $214,610 2 $193,080 1 $210,980 APPLICATIONS DENIED 1 $120,770 0 $0 0 $0 APPLICATIONS WITHDRAWN 1 $120,770 2 $51,775 0 $0 FILES CLOSED FOR INCOMPLETENESS 0 $0 0 $0 0 $0
Aggregated Statistics For Year 2008(Based on 1 full and 3 partial tracts) A) Conventional B) Refinancings C) Non-occupant Loans on Number Average Value Number Average Value Number Average Value
LOANS ORIGINATED 46 $145,593 5 $165,896 8 $132,685 APPLICATIONS APPROVED, NOT ACCEPTED 13 $180,933 6 $134,360 4 $222,050 APPLICATIONS DENIED 1 $144,710 0 $0 1 $78,240 APPLICATIONS WITHDRAWN 2 $90,430 1 $141,860 0 $0 FILES CLOSED FOR INCOMPLETENESS 1 $280,100 0 $0 1 $74,210
Aggregated Statistics For Year 2007(Based on 1 full and 3 partial tracts) A) Conventional B) Refinancings C) Non-occupant Loans on Number Average Value Number Average Value Number Average Value
LOANS ORIGINATED 79 $129,575 7 $127,687 8 $130,088 APPLICATIONS APPROVED, NOT ACCEPTED 8 $132,275 2 $194,760 0 $0 APPLICATIONS DENIED 1 $72,670 0 $0 0 $0 APPLICATIONS WITHDRAWN 2 $165,510 1 $73,060 0 $0 FILES CLOSED FOR INCOMPLETENESS 1 $92,390 0 $0 0 $0
Aggregated Statistics For Year 2006(Based on 1 full and 3 partial tracts) A) Conventional B) Refinancings C) Non-occupant Loans on Number Average Value Number Average Value Number Average Value
LOANS ORIGINATED 56 $120,814 5 $175,132 7 $110,834 APPLICATIONS APPROVED, NOT ACCEPTED 9 $145,278 1 $153,200 0 $0 APPLICATIONS DENIED 0 $0 1 $79,390 0 $0 APPLICATIONS WITHDRAWN 1 $57,750 0 $0 0 $0 FILES CLOSED FOR INCOMPLETENESS 0 $0 0 $0 0 $0
Aggregated Statistics For Year 2005(Based on 1 full and 3 partial tracts) A) Conventional B) Refinancings C) Non-occupant Loans on Number Average Value Number Average Value Number Average Value
LOANS ORIGINATED 47 $116,222 8 $141,514 10 $125,087 APPLICATIONS APPROVED, NOT ACCEPTED 9 $120,958 3 $118,047 0 $0 APPLICATIONS DENIED 0 $0 0 $0 0 $0 APPLICATIONS WITHDRAWN 3 $86,893 1 $203,300 1 $48,000 FILES CLOSED FOR INCOMPLETENESS 1 $56,380 0 $0 1 $56,380
Aggregated Statistics For Year 2004(Based on 1 full and 3 partial tracts) A) Conventional B) Refinancings C) Non-occupant Loans on Number Average Value Number Average Value Number Average Value
LOANS ORIGINATED 55 $121,353 20 $117,622 11 $92,176 APPLICATIONS APPROVED, NOT ACCEPTED 7 $83,881 3 $121,187 2 $57,500 APPLICATIONS DENIED 0 $0 0 $0 0 $0 APPLICATIONS WITHDRAWN 2 $129,590 1 $50,240 1 $43,150 FILES CLOSED FOR INCOMPLETENESS 1 $154,960 1 $188,420 0 $0
Aggregated Statistics For Year 2003(Based on 1 full and 3 partial tracts) A) Conventional B) Refinancings C) Non-occupant Loans on Number Average Value Number Average Value Number Average Value
LOANS ORIGINATED 60 $108,543 35 $115,345 9 $73,389 APPLICATIONS APPROVED, NOT ACCEPTED 12 $121,193 9 $91,783 2 $64,420 APPLICATIONS DENIED 2 $51,730 1 $36,380 1 $36,380 APPLICATIONS WITHDRAWN 2 $121,855 2 $80,590 0 $0 FILES CLOSED FOR INCOMPLETENESS 0 $0 1 $50,000 1 $50,000
Aggregated Statistics For Year 2002(Based on 1 full and 3 partial tracts) A) Conventional B) Refinancings C) Non-occupant Loans on Number Average Value Number Average Value Number Average Value
LOANS ORIGINATED 38 $107,341 15 $115,073 4 $76,645 APPLICATIONS APPROVED, NOT ACCEPTED 4 $98,325 4 $84,980 0 $0 APPLICATIONS DENIED 0 $0 3 $106,253 1 $143,320 APPLICATIONS WITHDRAWN 1 $71,300 3 $164,890 0 $0 FILES CLOSED FOR INCOMPLETENESS 0 $0 1 $49,270 1 $49,270
Aggregated Statistics For Year 2001(Based on 1 full and 3 partial tracts) A) Conventional B) Refinancings C) Non-occupant Loans on Number Average Value Number Average Value Number Average Value
LOANS ORIGINATED 29 $102,253 7 $116,527 4 $50,338 APPLICATIONS APPROVED, NOT ACCEPTED 5 $72,928 1 $89,770 2 $105,315 APPLICATIONS DENIED 2 $109,125 0 $0 0 $0 APPLICATIONS WITHDRAWN 0 $0 0 $0 0 $0 FILES CLOSED FOR INCOMPLETENESS 0 $0 0 $0 0 $0
Aggregated Statistics For Year 2000(Based on 1 full and 3 partial tracts) A) Conventional B) Refinancings C) Non-occupant Loans on Number Average Value Number Average Value Number Average Value
LOANS ORIGINATED 33 $95,231 4 $102,680 5 $44,632 APPLICATIONS APPROVED, NOT ACCEPTED 2 $155,685 0 $0 0 $0 APPLICATIONS DENIED 3 $102,813 0 $0 0 $0 APPLICATIONS WITHDRAWN 1 $79,300 1 $153,500 0 $0 FILES CLOSED FOR INCOMPLETENESS 1 $35,090 0 $0 0 $0
Aggregated Statistics For Year 1999(Based on 1 full and 3 partial tracts) A) Conventional B) Refinancings C) Non-occupant Loans on Number Average Value Number Average Value Number Average Value
LOANS ORIGINATED 24 $101,228 4 $92,408 1 $47,660 APPLICATIONS APPROVED, NOT ACCEPTED 5 $90,842 2 $124,095 0 $0 APPLICATIONS DENIED 3 $139,557 1 $88,730 0 $0 APPLICATIONS WITHDRAWN 0 $0 0 $0 0 $0 FILES CLOSED FOR INCOMPLETENESS 0 $0 0 $0 0 $0
Detailed PMIC statistics for the following Tracts:
1216.01
, 1216.03 , 1216.04 , 1217.00
Most common first names in Universal City, TX among deceased individuals Name Count Lived (average)
John 61 74.7 years Robert 58 67.5 years Mary 50 71.2 years William 49 73.7 years James 42 70.2 years Charles 28 64.9 years Dorothy 25 76.0 years George 22 71.5 years Helen 21 74.9 years Thomas 21 72.7 years
Most common last names in Universal City, TX among deceased individuals Last name Count Lived (average)
Smith 23 75.0 years Johnson 19 74.9 years Taylor 12 67.8 years Williams 12 69.7 years Davis 12 73.9 years Anderson 11 73.2 years Young 8 72.8 years Gomez 8 72.9 years Jones 8 64.0 years Moore 7 66.7 years
Universal City compared to Texas state average:
Unemployed percentage significantly below state average. Median age above state average. Length of stay since moving in significantly above state average. Number of college students above state average.
Top Patent Applicants
Royce W. Johnson (20)
Royce Johnson (9)
Cesar Z. Lina (7)
Johnathan L. Kiel (4)
Cesar Lina (3)
Robert L. Robinson (2)
Charles Anthony Wheeler, Jr. (2)
Jason W. Hayes (1)
Christina Topinka (1)
Gilbert Salazar (1)
Total of 62 patent applications in 2008-2024.
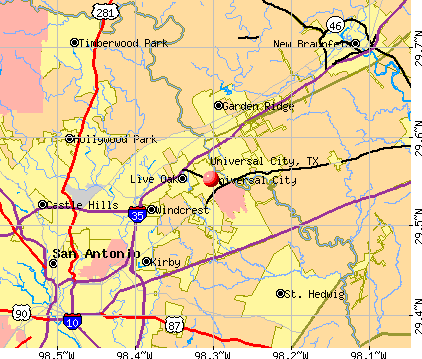


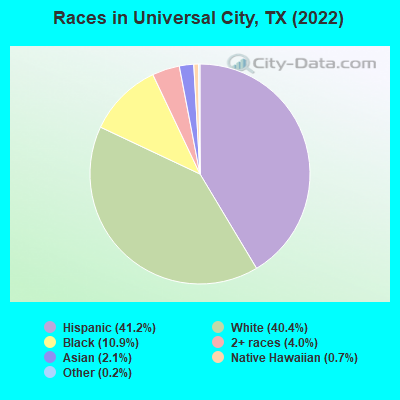
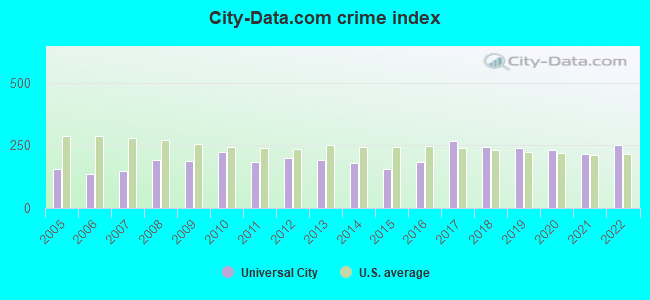
 Recent articles from our blog. Our writers, many of them Ph.D. graduates or candidates, create easy-to-read articles on a wide variety of topics.


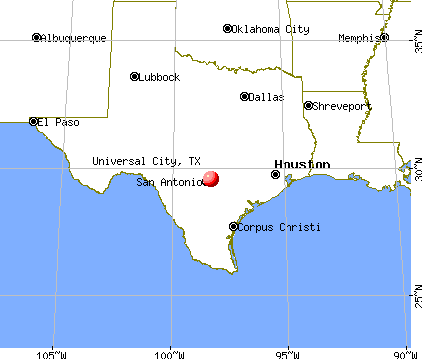
 (14.4 miles
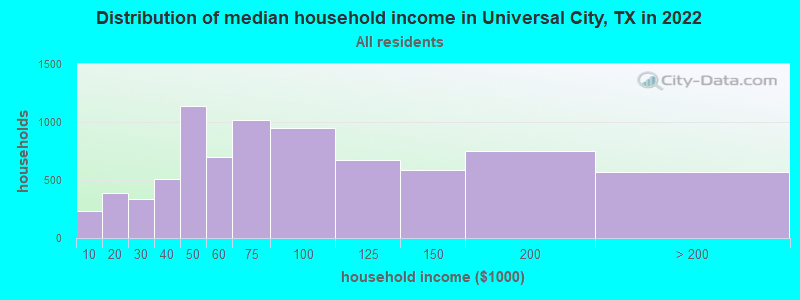
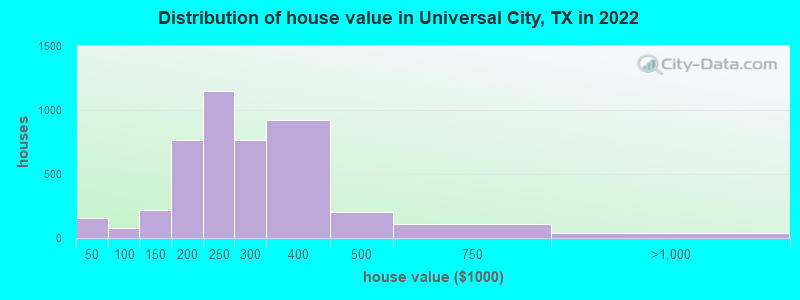
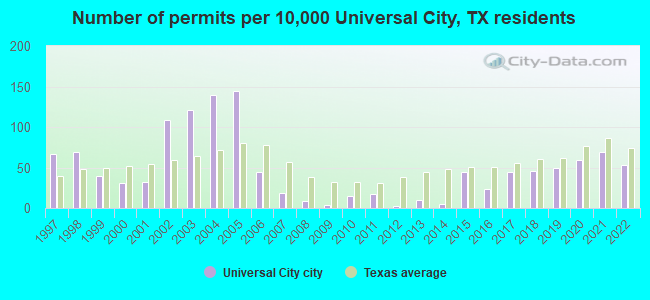
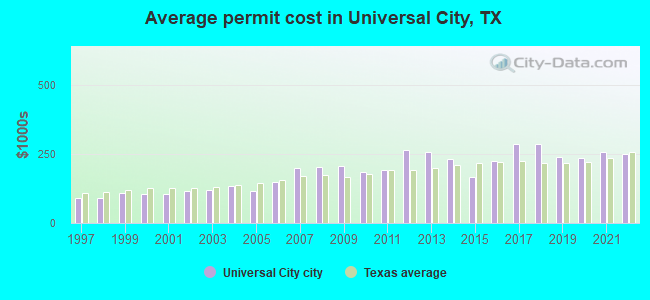
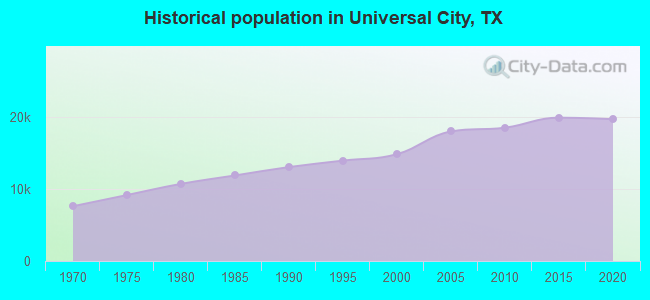
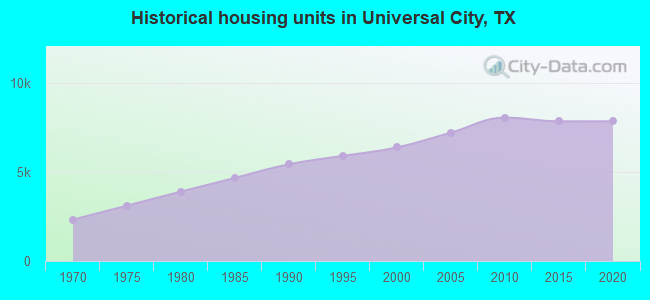
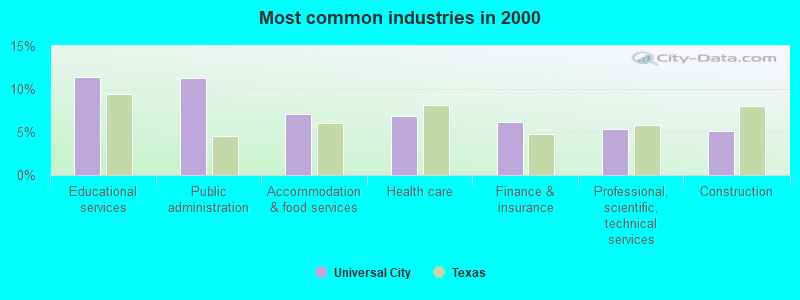
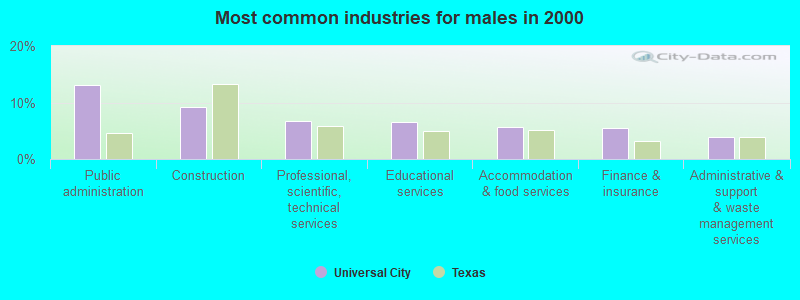
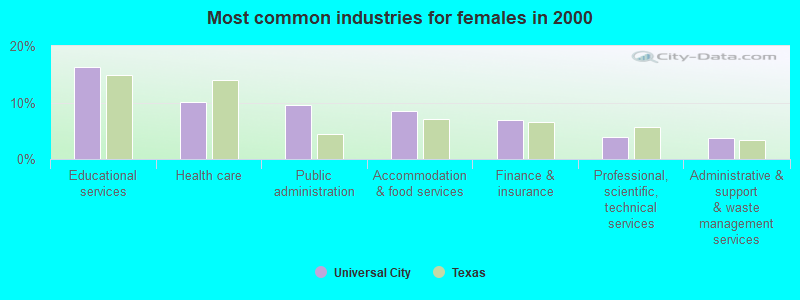
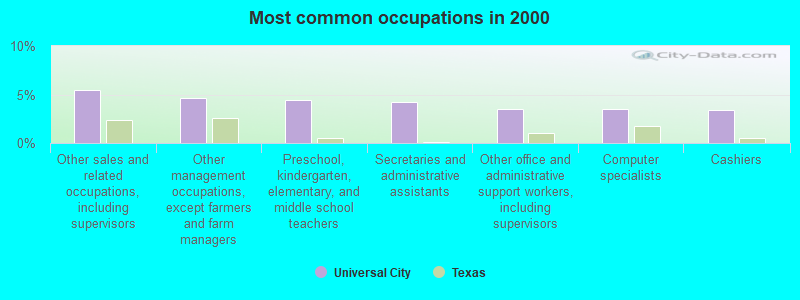
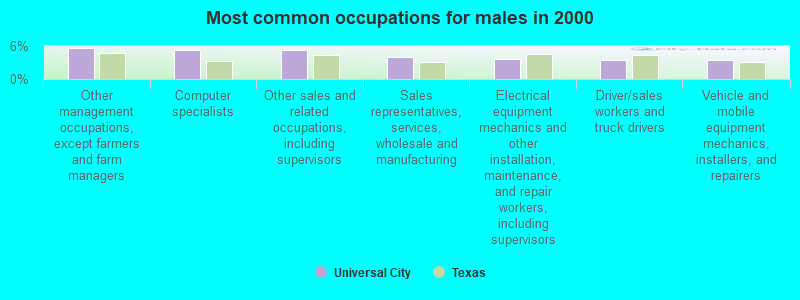
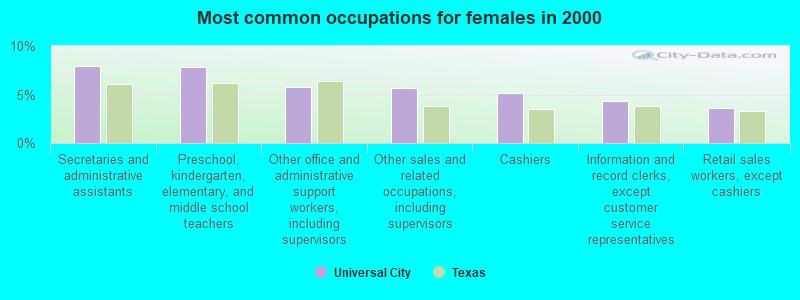
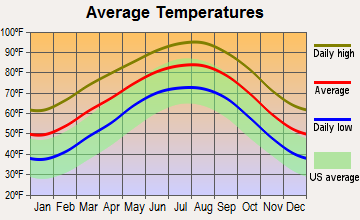
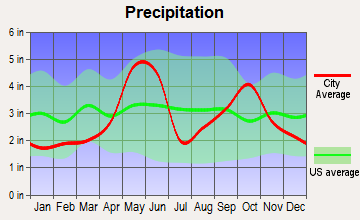
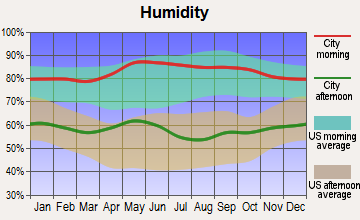
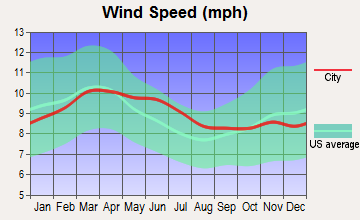
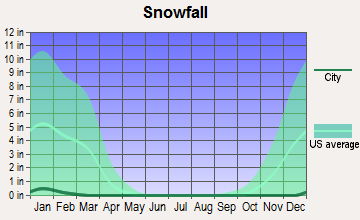
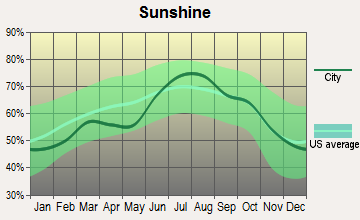
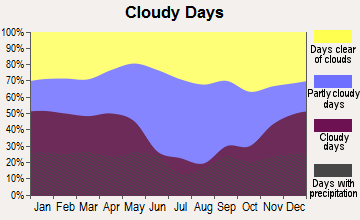
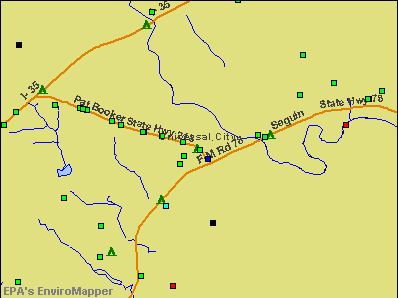

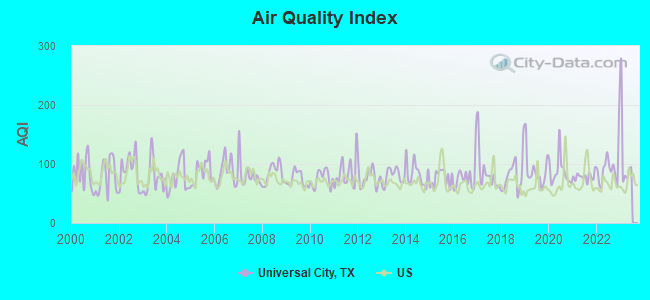
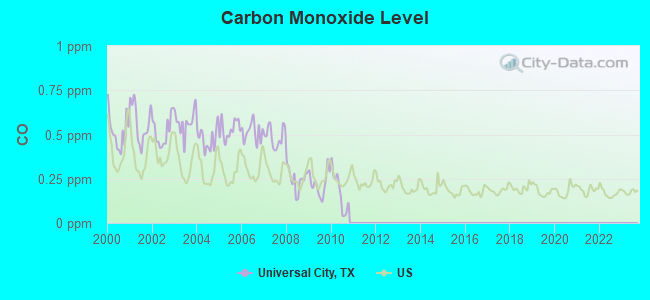
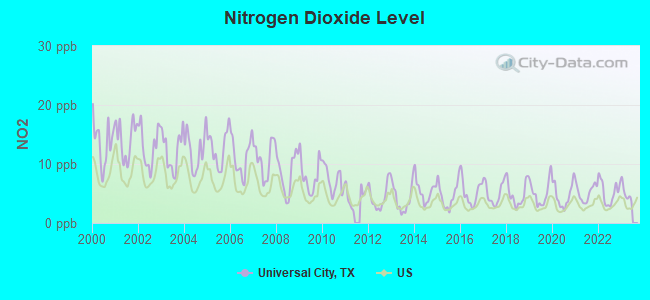

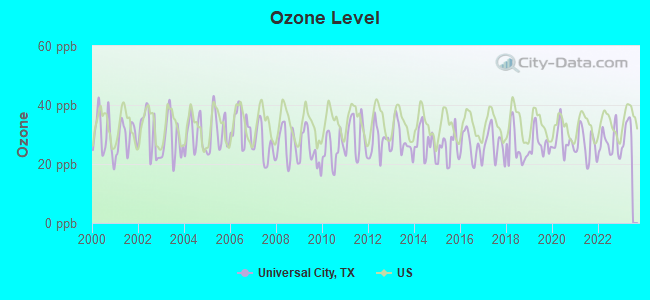
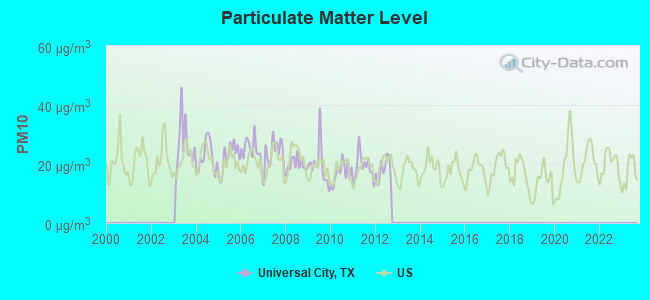
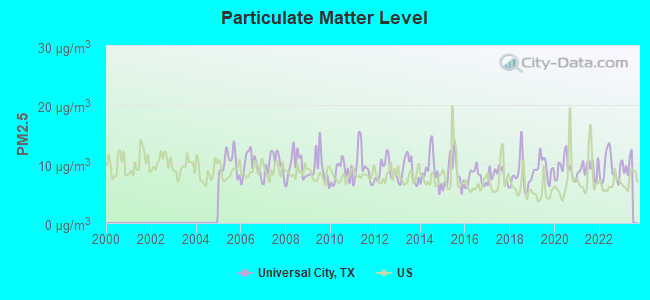
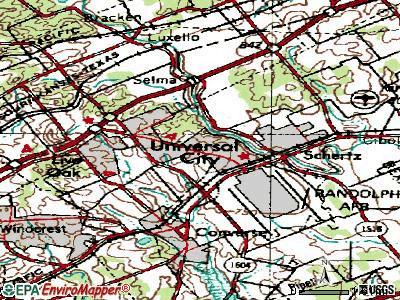
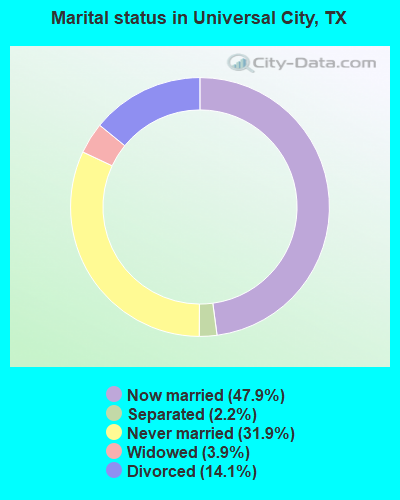
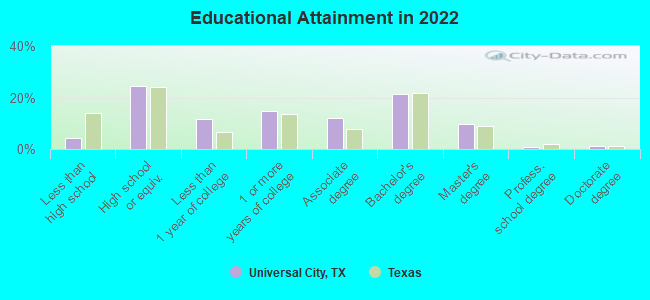
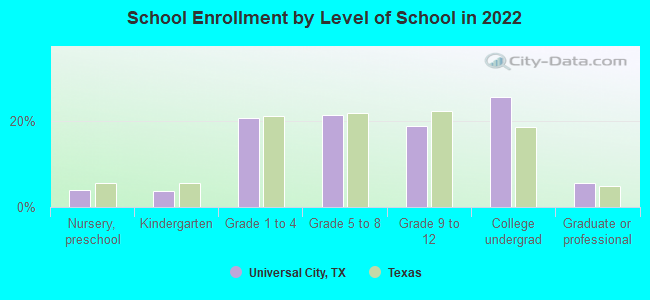
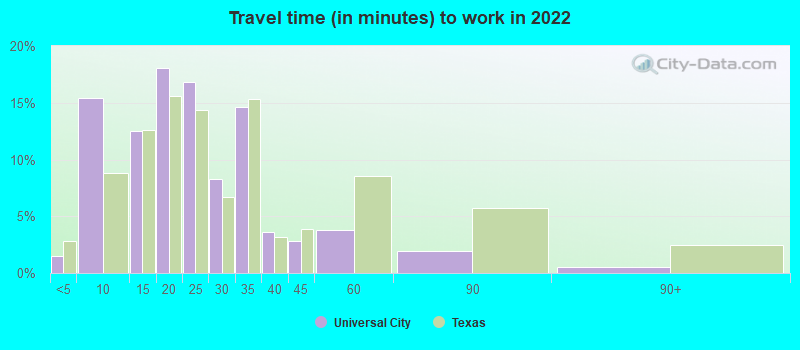
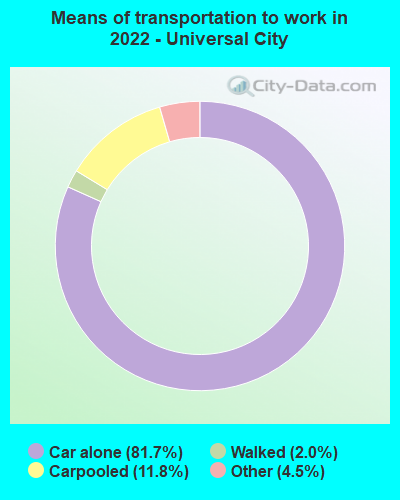
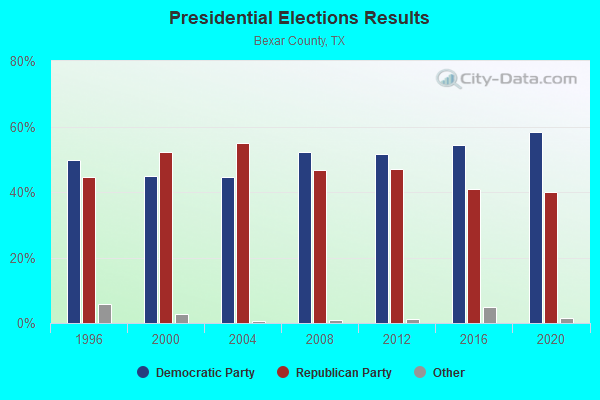
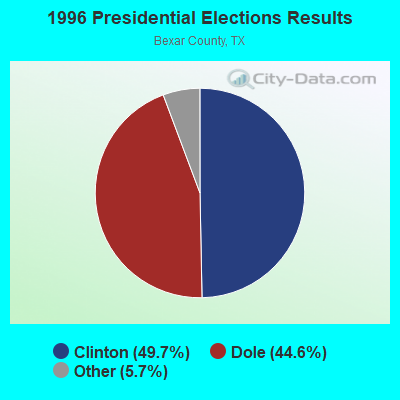
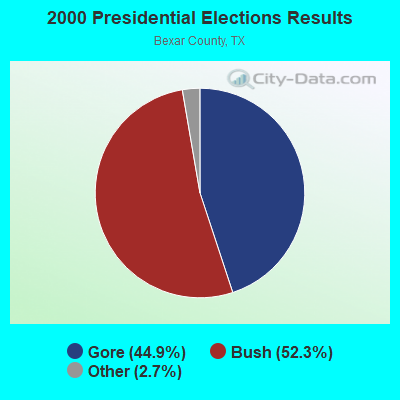
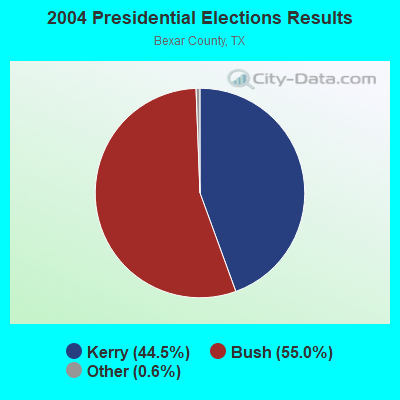
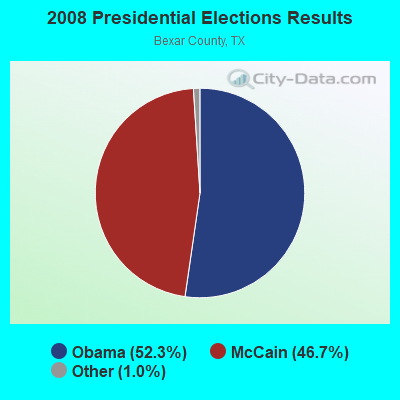

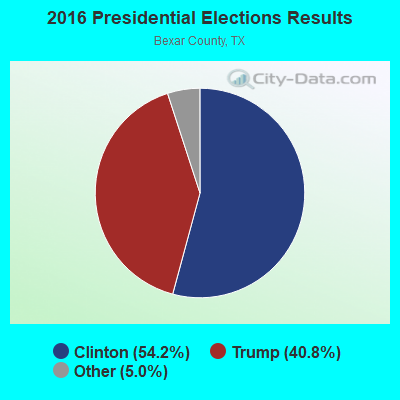
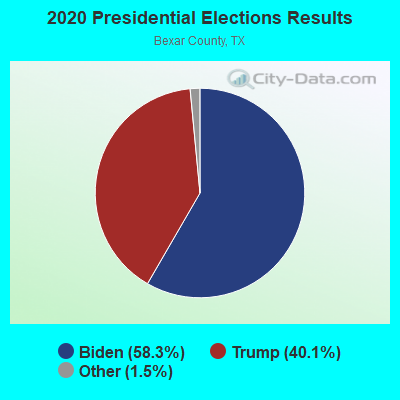
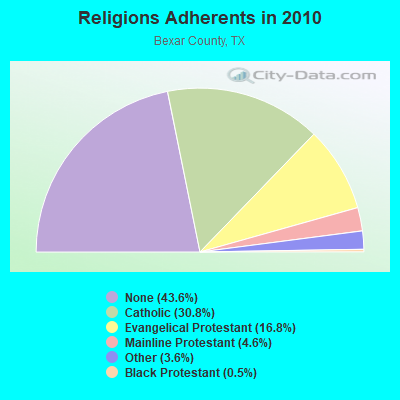
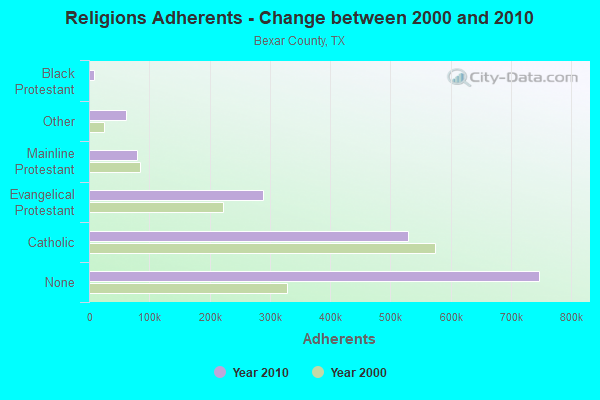
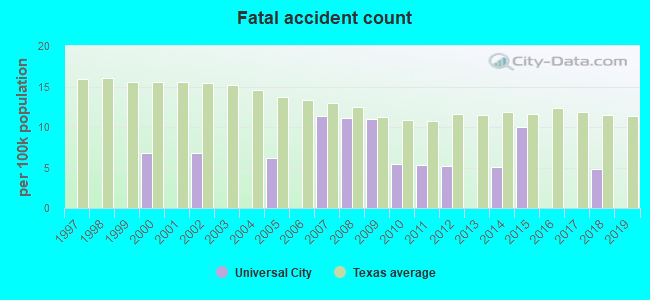
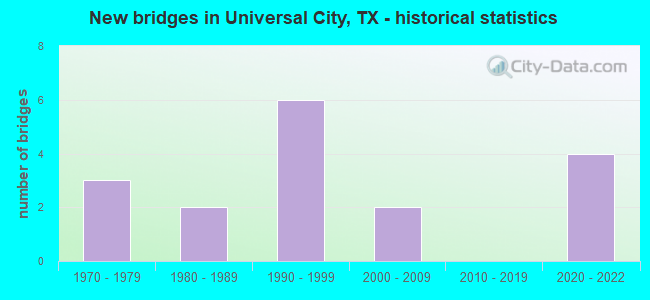
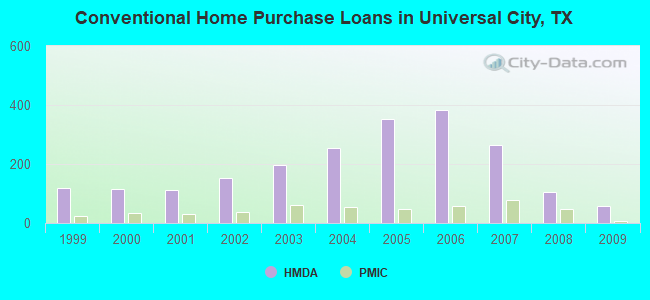
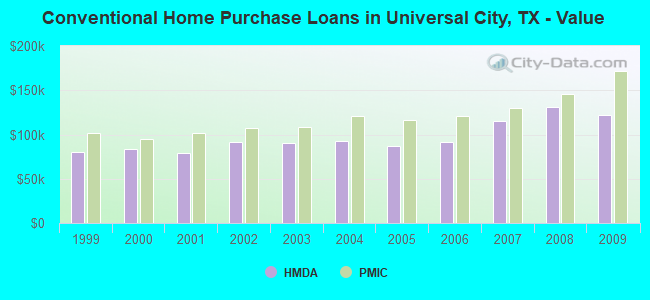
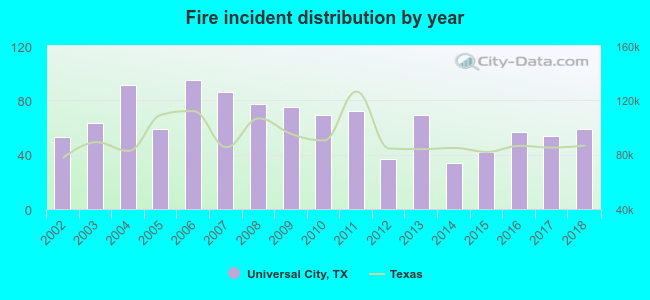 Based on the data from the years 2002 - 2018 the average number of fire incidents per year is 64. The highest number of reported fire incidents - 95 took place in 2006, and the least - 34 in 2014. The data has a rising trend.
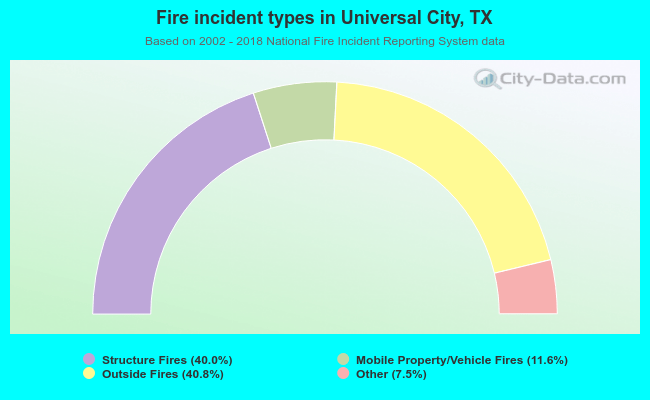 When looking into fire subcategories, the most incidents belonged to: Outside Fires (40.8%), and Structure Fires (40.0%).