Vallejo, California Submit your own pictures of this city and show them to the world
OSM Map
General Map
Google Map
MSN Map
OSM Map
General Map
Google Map
MSN Map
OSM Map
General Map
Google Map
MSN Map
OSM Map
General Map
Google Map
MSN Map
Please wait while loading the map...
Population in 2022: 123,564 (100% urban, 0% rural). Population change since 2000: +5.8%Males: 60,544 Females: 63,020
March 2022 cost of living index in Vallejo: 113.2 (more than average, U.S. average is 100) Percentage of residents living in poverty in 2022: 11.2%for White Non-Hispanic residents , 20.6% for Black residents , 11.6% for Hispanic or Latino residents , 8.8% for American Indian residents , 13.8% for Native Hawaiian and other Pacific Islander residents , 12.4% for other race residents , 10.8% for two or more races residents )
Profiles of local businesses
Business Search - 14 Million verified businesses
Data:
Median household income ($)
Median household income (% change since 2000)
Household income diversity
Ratio of average income to average house value (%)
Ratio of average income to average rent
Median household income ($) - White
Median household income ($) - Black or African American
Median household income ($) - Asian
Median household income ($) - Hispanic or Latino
Median household income ($) - American Indian and Alaska Native
Median household income ($) - Multirace
Median household income ($) - Other Race
Median household income for houses/condos with a mortgage ($)
Median household income for apartments without a mortgage ($)
Races - White alone (%)
Races - White alone (% change since 2000)
Races - Black alone (%)
Races - Black alone (% change since 2000)
Races - American Indian alone (%)
Races - American Indian alone (% change since 2000)
Races - Asian alone (%)
Races - Asian alone (% change since 2000)
Races - Hispanic (%)
Races - Hispanic (% change since 2000)
Races - Native Hawaiian and Other Pacific Islander alone (%)
Races - Native Hawaiian and Other Pacific Islander alone (% change since 2000)
Races - Two or more races (%)
Races - Two or more races (% change since 2000)
Races - Other race alone (%)
Races - Other race alone (% change since 2000)
Racial diversity
Unemployment (%)
Unemployment (% change since 2000)
Unemployment (%) - White
Unemployment (%) - Black or African American
Unemployment (%) - Asian
Unemployment (%) - Hispanic or Latino
Unemployment (%) - American Indian and Alaska Native
Unemployment (%) - Multirace
Unemployment (%) - Other Race
Population density (people per square mile)
Population - Males (%)
Population - Females (%)
Population - Males (%) - White
Population - Males (%) - Black or African American
Population - Males (%) - Asian
Population - Males (%) - Hispanic or Latino
Population - Males (%) - American Indian and Alaska Native
Population - Males (%) - Multirace
Population - Males (%) - Other Race
Population - Females (%) - White
Population - Females (%) - Black or African American
Population - Females (%) - Asian
Population - Females (%) - Hispanic or Latino
Population - Females (%) - American Indian and Alaska Native
Population - Females (%) - Multirace
Population - Females (%) - Other Race
Coronavirus confirmed cases (Apr 25, 2024)
Deaths caused by coronavirus (Apr 25, 2024)
Coronavirus confirmed cases (per 100k population) (Apr 25, 2024)
Deaths caused by coronavirus (per 100k population) (Apr 25, 2024)
Daily increase in number of cases (Apr 25, 2024)
Weekly increase in number of cases (Apr 25, 2024)
Cases doubled (in days) (Apr 25, 2024)
Hospitalized patients (Apr 18, 2022)
Negative test results (Apr 18, 2022)
Total test results (Apr 18, 2022)
COVID Vaccine doses distributed (per 100k population) (Sep 19, 2023)
COVID Vaccine doses administered (per 100k population) (Sep 19, 2023)
COVID Vaccine doses distributed (Sep 19, 2023)
COVID Vaccine doses administered (Sep 19, 2023)
Likely homosexual households (%)
Likely homosexual households (% change since 2000)
Likely homosexual households - Lesbian couples (%)
Likely homosexual households - Lesbian couples (% change since 2000)
Likely homosexual households - Gay men (%)
Likely homosexual households - Gay men (% change since 2000)
Cost of living index
Median gross rent ($)
Median contract rent ($)
Median monthly housing costs ($)
Median house or condo value ($)
Median house or condo value ($ change since 2000)
Mean house or condo value by units in structure - 1, detached ($)
Mean house or condo value by units in structure - 1, attached ($)
Mean house or condo value by units in structure - 2 ($)
Mean house or condo value by units in structure by units in structure - 3 or 4 ($)
Mean house or condo value by units in structure - 5 or more ($)
Mean house or condo value by units in structure - Boat, RV, van, etc. ($)
Mean house or condo value by units in structure - Mobile home ($)
Median house or condo value ($) - White
Median house or condo value ($) - Black or African American
Median house or condo value ($) - Asian
Median house or condo value ($) - Hispanic or Latino
Median house or condo value ($) - American Indian and Alaska Native
Median house or condo value ($) - Multirace
Median house or condo value ($) - Other Race
Median resident age
Resident age diversity
Median resident age - Males
Median resident age - Females
Median resident age - White
Median resident age - Black or African American
Median resident age - Asian
Median resident age - Hispanic or Latino
Median resident age - American Indian and Alaska Native
Median resident age - Multirace
Median resident age - Other Race
Median resident age - Males - White
Median resident age - Males - Black or African American
Median resident age - Males - Asian
Median resident age - Males - Hispanic or Latino
Median resident age - Males - American Indian and Alaska Native
Median resident age - Males - Multirace
Median resident age - Males - Other Race
Median resident age - Females - White
Median resident age - Females - Black or African American
Median resident age - Females - Asian
Median resident age - Females - Hispanic or Latino
Median resident age - Females - American Indian and Alaska Native
Median resident age - Females - Multirace
Median resident age - Females - Other Race
Commute - mean travel time to work (minutes)
Travel time to work - Less than 5 minutes (%)
Travel time to work - Less than 5 minutes (% change since 2000)
Travel time to work - 5 to 9 minutes (%)
Travel time to work - 5 to 9 minutes (% change since 2000)
Travel time to work - 10 to 19 minutes (%)
Travel time to work - 10 to 19 minutes (% change since 2000)
Travel time to work - 20 to 29 minutes (%)
Travel time to work - 20 to 29 minutes (% change since 2000)
Travel time to work - 30 to 39 minutes (%)
Travel time to work - 30 to 39 minutes (% change since 2000)
Travel time to work - 40 to 59 minutes (%)
Travel time to work - 40 to 59 minutes (% change since 2000)
Travel time to work - 60 to 89 minutes (%)
Travel time to work - 60 to 89 minutes (% change since 2000)
Travel time to work - 90 or more minutes (%)
Travel time to work - 90 or more minutes (% change since 2000)
Marital status - Never married (%)
Marital status - Now married (%)
Marital status - Separated (%)
Marital status - Widowed (%)
Marital status - Divorced (%)
Median family income ($)
Median family income (% change since 2000)
Median non-family income ($)
Median non-family income (% change since 2000)
Median per capita income ($)
Median per capita income (% change since 2000)
Median family income ($) - White
Median family income ($) - Black or African American
Median family income ($) - Asian
Median family income ($) - Hispanic or Latino
Median family income ($) - American Indian and Alaska Native
Median family income ($) - Multirace
Median family income ($) - Other Race
Median year house/condo built
Median year apartment built
Year house built - Built 2005 or later (%)
Year house built - Built 2000 to 2004 (%)
Year house built - Built 1990 to 1999 (%)
Year house built - Built 1980 to 1989 (%)
Year house built - Built 1970 to 1979 (%)
Year house built - Built 1960 to 1969 (%)
Year house built - Built 1950 to 1959 (%)
Year house built - Built 1940 to 1949 (%)
Year house built - Built 1939 or earlier (%)
Average household size
Household density (households per square mile)
Average household size - White
Average household size - Black or African American
Average household size - Asian
Average household size - Hispanic or Latino
Average household size - American Indian and Alaska Native
Average household size - Multirace
Average household size - Other Race
Occupied housing units (%)
Vacant housing units (%)
Owner occupied housing units (%)
Renter occupied housing units (%)
Vacancy status - For rent (%)
Vacancy status - For sale only (%)
Vacancy status - Rented or sold, not occupied (%)
Vacancy status - For seasonal, recreational, or occasional use (%)
Vacancy status - For migrant workers (%)
Vacancy status - Other vacant (%)
Residents with income below the poverty level (%)
Residents with income below 50% of the poverty level (%)
Children below poverty level (%)
Poor families by family type - Married-couple family (%)
Poor families by family type - Male, no wife present (%)
Poor families by family type - Female, no husband present (%)
Poverty status for native-born residents (%)
Poverty status for foreign-born residents (%)
Poverty among high school graduates not in families (%)
Poverty among people who did not graduate high school not in families (%)
Residents with income below the poverty level (%) - White
Residents with income below the poverty level (%) - Black or African American
Residents with income below the poverty level (%) - Asian
Residents with income below the poverty level (%) - Hispanic or Latino
Residents with income below the poverty level (%) - American Indian and Alaska Native
Residents with income below the poverty level (%) - Multirace
Residents with income below the poverty level (%) - Other Race
Air pollution - Air Quality Index (AQI)
Air pollution - CO
Air pollution - NO2
Air pollution - SO2
Air pollution - Ozone
Air pollution - PM10
Air pollution - PM25
Air pollution - Pb
Crime - Murders per 100,000 population
Crime - Rapes per 100,000 population
Crime - Robberies per 100,000 population
Crime - Assaults per 100,000 population
Crime - Burglaries per 100,000 population
Crime - Thefts per 100,000 population
Crime - Auto thefts per 100,000 population
Crime - Arson per 100,000 population
Crime - City-data.com crime index
Crime - Violent crime index
Crime - Property crime index
Crime - Murders per 100,000 population (5 year average)
Crime - Rapes per 100,000 population (5 year average)
Crime - Robberies per 100,000 population (5 year average)
Crime - Assaults per 100,000 population (5 year average)
Crime - Burglaries per 100,000 population (5 year average)
Crime - Thefts per 100,000 population (5 year average)
Crime - Auto thefts per 100,000 population (5 year average)
Crime - Arson per 100,000 population (5 year average)
Crime - City-data.com crime index (5 year average)
Crime - Violent crime index (5 year average)
Crime - Property crime index (5 year average)
1996 Presidential Elections Results (%) - Democratic Party (Clinton)
1996 Presidential Elections Results (%) - Republican Party (Dole)
1996 Presidential Elections Results (%) - Other
2000 Presidential Elections Results (%) - Democratic Party (Gore)
2000 Presidential Elections Results (%) - Republican Party (Bush)
2000 Presidential Elections Results (%) - Other
2004 Presidential Elections Results (%) - Democratic Party (Kerry)
2004 Presidential Elections Results (%) - Republican Party (Bush)
2004 Presidential Elections Results (%) - Other
2008 Presidential Elections Results (%) - Democratic Party (Obama)
2008 Presidential Elections Results (%) - Republican Party (McCain)
2008 Presidential Elections Results (%) - Other
2012 Presidential Elections Results (%) - Democratic Party (Obama)
2012 Presidential Elections Results (%) - Republican Party (Romney)
2012 Presidential Elections Results (%) - Other
2016 Presidential Elections Results (%) - Democratic Party (Clinton)
2016 Presidential Elections Results (%) - Republican Party (Trump)
2016 Presidential Elections Results (%) - Other
2020 Presidential Elections Results (%) - Democratic Party (Biden)
2020 Presidential Elections Results (%) - Republican Party (Trump)
2020 Presidential Elections Results (%) - Other
Ancestries Reported - Arab (%)
Ancestries Reported - Czech (%)
Ancestries Reported - Danish (%)
Ancestries Reported - Dutch (%)
Ancestries Reported - English (%)
Ancestries Reported - French (%)
Ancestries Reported - French Canadian (%)
Ancestries Reported - German (%)
Ancestries Reported - Greek (%)
Ancestries Reported - Hungarian (%)
Ancestries Reported - Irish (%)
Ancestries Reported - Italian (%)
Ancestries Reported - Lithuanian (%)
Ancestries Reported - Norwegian (%)
Ancestries Reported - Polish (%)
Ancestries Reported - Portuguese (%)
Ancestries Reported - Russian (%)
Ancestries Reported - Scotch-Irish (%)
Ancestries Reported - Scottish (%)
Ancestries Reported - Slovak (%)
Ancestries Reported - Subsaharan African (%)
Ancestries Reported - Swedish (%)
Ancestries Reported - Swiss (%)
Ancestries Reported - Ukrainian (%)
Ancestries Reported - United States (%)
Ancestries Reported - Welsh (%)
Ancestries Reported - West Indian (%)
Ancestries Reported - Other (%)
Educational Attainment - No schooling completed (%)
Educational Attainment - Less than high school (%)
Educational Attainment - High school or equivalent (%)
Educational Attainment - Less than 1 year of college (%)
Educational Attainment - 1 or more years of college (%)
Educational Attainment - Associate degree (%)
Educational Attainment - Bachelor's degree (%)
Educational Attainment - Master's degree (%)
Educational Attainment - Professional school degree (%)
Educational Attainment - Doctorate degree (%)
School Enrollment - Nursery, preschool (%)
School Enrollment - Kindergarten (%)
School Enrollment - Grade 1 to 4 (%)
School Enrollment - Grade 5 to 8 (%)
School Enrollment - Grade 9 to 12 (%)
School Enrollment - College undergrad (%)
School Enrollment - Graduate or professional (%)
School Enrollment - Not enrolled in school (%)
School enrollment - Public schools (%)
School enrollment - Private schools (%)
School enrollment - Not enrolled (%)
Median number of rooms in houses and condos
Median number of rooms in apartments
Housing units lacking complete plumbing facilities (%)
Housing units lacking complete kitchen facilities (%)
Density of houses
Urban houses (%)
Rural houses (%)
Households with people 60 years and over (%)
Households with people 65 years and over (%)
Households with people 75 years and over (%)
Households with one or more nonrelatives (%)
Households with no nonrelatives (%)
Population in households (%)
Family households (%)
Nonfamily households (%)
Population in families (%)
Family households with own children (%)
Median number of bedrooms in owner occupied houses
Mean number of bedrooms in owner occupied houses
Median number of bedrooms in renter occupied houses
Mean number of bedrooms in renter occupied houses
Median number of vehichles in owner occupied houses
Mean number of vehichles in owner occupied houses
Median number of vehichles in renter occupied houses
Mean number of vehichles in renter occupied houses
Mortgage status - with mortgage (%)
Mortgage status - with second mortgage (%)
Mortgage status - with home equity loan (%)
Mortgage status - with both second mortgage and home equity loan (%)
Mortgage status - without a mortgage (%)
Average family size
Average family size - White
Average family size - Black or African American
Average family size - Asian
Average family size - Hispanic or Latino
Average family size - American Indian and Alaska Native
Average family size - Multirace
Average family size - Other Race
Geographical mobility - Same house 1 year ago (%)
Geographical mobility - Moved within same county (%)
Geographical mobility - Moved from different county within same state (%)
Geographical mobility - Moved from different state (%)
Geographical mobility - Moved from abroad (%)
Place of birth - Born in state of residence (%)
Place of birth - Born in other state (%)
Place of birth - Native, outside of US (%)
Place of birth - Foreign born (%)
Housing units in structures - 1, detached (%)
Housing units in structures - 1, attached (%)
Housing units in structures - 2 (%)
Housing units in structures - 3 or 4 (%)
Housing units in structures - 5 to 9 (%)
Housing units in structures - 10 to 19 (%)
Housing units in structures - 20 to 49 (%)
Housing units in structures - 50 or more (%)
Housing units in structures - Mobile home (%)
Housing units in structures - Boat, RV, van, etc. (%)
House/condo owner moved in on average (years ago)
Renter moved in on average (years ago)
Year householder moved into unit - Moved in 1999 to March 2000 (%)
Year householder moved into unit - Moved in 1995 to 1998 (%)
Year householder moved into unit - Moved in 1990 to 1994 (%)
Year householder moved into unit - Moved in 1980 to 1989 (%)
Year householder moved into unit - Moved in 1970 to 1979 (%)
Year householder moved into unit - Moved in 1969 or earlier (%)
Means of transportation to work - Drove car alone (%)
Means of transportation to work - Carpooled (%)
Means of transportation to work - Public transportation (%)
Means of transportation to work - Bus or trolley bus (%)
Means of transportation to work - Streetcar or trolley car (%)
Means of transportation to work - Subway or elevated (%)
Means of transportation to work - Railroad (%)
Means of transportation to work - Ferryboat (%)
Means of transportation to work - Taxicab (%)
Means of transportation to work - Motorcycle (%)
Means of transportation to work - Bicycle (%)
Means of transportation to work - Walked (%)
Means of transportation to work - Other means (%)
Working at home (%)
Industry diversity
Most Common Industries - Agriculture, forestry, fishing and hunting, and mining (%)
Most Common Industries - Agriculture, forestry, fishing and hunting (%)
Most Common Industries - Mining, quarrying, and oil and gas extraction (%)
Most Common Industries - Construction (%)
Most Common Industries - Manufacturing (%)
Most Common Industries - Wholesale trade (%)
Most Common Industries - Retail trade (%)
Most Common Industries - Transportation and warehousing, and utilities (%)
Most Common Industries - Transportation and warehousing (%)
Most Common Industries - Utilities (%)
Most Common Industries - Information (%)
Most Common Industries - Finance and insurance, and real estate and rental and leasing (%)
Most Common Industries - Finance and insurance (%)
Most Common Industries - Real estate and rental and leasing (%)
Most Common Industries - Professional, scientific, and management, and administrative and waste management services (%)
Most Common Industries - Professional, scientific, and technical services (%)
Most Common Industries - Management of companies and enterprises (%)
Most Common Industries - Administrative and support and waste management services (%)
Most Common Industries - Educational services, and health care and social assistance (%)
Most Common Industries - Educational services (%)
Most Common Industries - Health care and social assistance (%)
Most Common Industries - Arts, entertainment, and recreation, and accommodation and food services (%)
Most Common Industries - Arts, entertainment, and recreation (%)
Most Common Industries - Accommodation and food services (%)
Most Common Industries - Other services, except public administration (%)
Most Common Industries - Public administration (%)
Occupation diversity
Most Common Occupations - Management, business, science, and arts occupations (%)
Most Common Occupations - Management, business, and financial occupations (%)
Most Common Occupations - Management occupations (%)
Most Common Occupations - Business and financial operations occupations (%)
Most Common Occupations - Computer, engineering, and science occupations (%)
Most Common Occupations - Computer and mathematical occupations (%)
Most Common Occupations - Architecture and engineering occupations (%)
Most Common Occupations - Life, physical, and social science occupations (%)
Most Common Occupations - Education, legal, community service, arts, and media occupations (%)
Most Common Occupations - Community and social service occupations (%)
Most Common Occupations - Legal occupations (%)
Most Common Occupations - Education, training, and library occupations (%)
Most Common Occupations - Arts, design, entertainment, sports, and media occupations (%)
Most Common Occupations - Healthcare practitioners and technical occupations (%)
Most Common Occupations - Health diagnosing and treating practitioners and other technical occupations (%)
Most Common Occupations - Health technologists and technicians (%)
Most Common Occupations - Service occupations (%)
Most Common Occupations - Healthcare support occupations (%)
Most Common Occupations - Protective service occupations (%)
Most Common Occupations - Fire fighting and prevention, and other protective service workers including supervisors (%)
Most Common Occupations - Law enforcement workers including supervisors (%)
Most Common Occupations - Food preparation and serving related occupations (%)
Most Common Occupations - Building and grounds cleaning and maintenance occupations (%)
Most Common Occupations - Personal care and service occupations (%)
Most Common Occupations - Sales and office occupations (%)
Most Common Occupations - Sales and related occupations (%)
Most Common Occupations - Office and administrative support occupations (%)
Most Common Occupations - Natural resources, construction, and maintenance occupations (%)
Most Common Occupations - Farming, fishing, and forestry occupations (%)
Most Common Occupations - Construction and extraction occupations (%)
Most Common Occupations - Installation, maintenance, and repair occupations (%)
Most Common Occupations - Production, transportation, and material moving occupations (%)
Most Common Occupations - Production occupations (%)
Most Common Occupations - Transportation occupations (%)
Most Common Occupations - Material moving occupations (%)
People in Group quarters - Institutionalized population (%)
People in Group quarters - Correctional institutions (%)
People in Group quarters - Federal prisons and detention centers (%)
People in Group quarters - Halfway houses (%)
People in Group quarters - Local jails and other confinement facilities (including police lockups) (%)
People in Group quarters - Military disciplinary barracks (%)
People in Group quarters - State prisons (%)
People in Group quarters - Other types of correctional institutions (%)
People in Group quarters - Nursing homes (%)
People in Group quarters - Hospitals/wards, hospices, and schools for the handicapped (%)
People in Group quarters - Hospitals/wards and hospices for chronically ill (%)
People in Group quarters - Hospices or homes for chronically ill (%)
People in Group quarters - Military hospitals or wards for chronically ill (%)
People in Group quarters - Other hospitals or wards for chronically ill (%)
People in Group quarters - Hospitals or wards for drug/alcohol abuse (%)
People in Group quarters - Mental (Psychiatric) hospitals or wards (%)
People in Group quarters - Schools, hospitals, or wards for the mentally retarded (%)
People in Group quarters - Schools, hospitals, or wards for the physically handicapped (%)
People in Group quarters - Institutions for the deaf (%)
People in Group quarters - Institutions for the blind (%)
People in Group quarters - Orthopedic wards and institutions for the physically handicapped (%)
People in Group quarters - Wards in general hospitals for patients who have no usual home elsewhere (%)
People in Group quarters - Wards in military hospitals for patients who have no usual home elsewhere (%)
People in Group quarters - Juvenile institutions (%)
People in Group quarters - Long-term care (%)
People in Group quarters - Homes for abused, dependent, and neglected children (%)
People in Group quarters - Residential treatment centers for emotionally disturbed children (%)
People in Group quarters - Training schools for juvenile delinquents (%)
People in Group quarters - Short-term care, detention or diagnostic centers for delinquent children (%)
People in Group quarters - Type of juvenile institution unknown (%)
People in Group quarters - Noninstitutionalized population (%)
People in Group quarters - College dormitories (includes college quarters off campus) (%)
People in Group quarters - Military quarters (%)
People in Group quarters - On base (%)
People in Group quarters - Barracks, unaccompanied personnel housing (UPH), (Enlisted/Officer), ;and similar group living quarters for military personnel (%)
People in Group quarters - Transient quarters for temporary residents (%)
People in Group quarters - Military ships (%)
People in Group quarters - Group homes (%)
People in Group quarters - Homes or halfway houses for drug/alcohol abuse (%)
People in Group quarters - Homes for the mentally ill (%)
People in Group quarters - Homes for the mentally retarded (%)
People in Group quarters - Homes for the physically handicapped (%)
People in Group quarters - Other group homes (%)
People in Group quarters - Religious group quarters (%)
People in Group quarters - Dormitories (%)
People in Group quarters - Agriculture workers' dormitories on farms (%)
People in Group quarters - Job Corps and vocational training facilities (%)
People in Group quarters - Other workers' dormitories (%)
People in Group quarters - Crews of maritime vessels (%)
People in Group quarters - Other nonhousehold living situations (%)
People in Group quarters - Other noninstitutional group quarters (%)
Residents speaking English at home (%)
Residents speaking English at home - Born in the United States (%)
Residents speaking English at home - Native, born elsewhere (%)
Residents speaking English at home - Foreign born (%)
Residents speaking Spanish at home (%)
Residents speaking Spanish at home - Born in the United States (%)
Residents speaking Spanish at home - Native, born elsewhere (%)
Residents speaking Spanish at home - Foreign born (%)
Residents speaking other language at home (%)
Residents speaking other language at home - Born in the United States (%)
Residents speaking other language at home - Native, born elsewhere (%)
Residents speaking other language at home - Foreign born (%)
Class of Workers - Employee of private company (%)
Class of Workers - Self-employed in own incorporated business (%)
Class of Workers - Private not-for-profit wage and salary workers (%)
Class of Workers - Local government workers (%)
Class of Workers - State government workers (%)
Class of Workers - Federal government workers (%)
Class of Workers - Self-employed workers in own not incorporated business and Unpaid family workers (%)
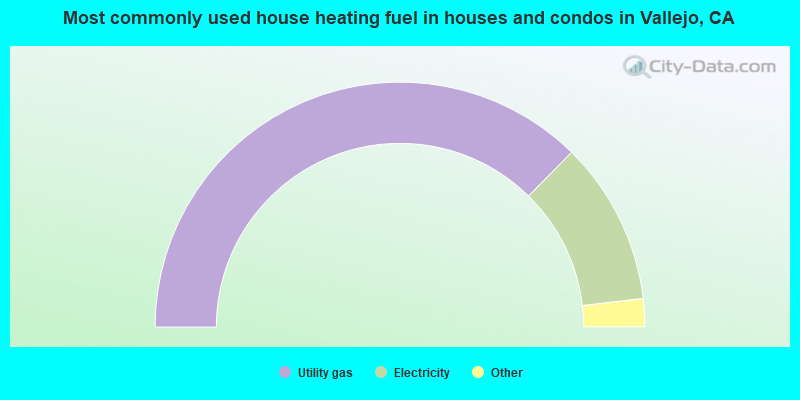
House heating fuel used in houses and condos - Utility gas (%)
House heating fuel used in houses and condos - Bottled, tank, or LP gas (%)
House heating fuel used in houses and condos - Electricity (%)
House heating fuel used in houses and condos - Fuel oil, kerosene, etc. (%)
House heating fuel used in houses and condos - Coal or coke (%)
House heating fuel used in houses and condos - Wood (%)
House heating fuel used in houses and condos - Solar energy (%)
House heating fuel used in houses and condos - Other fuel (%)
House heating fuel used in houses and condos - No fuel used (%)
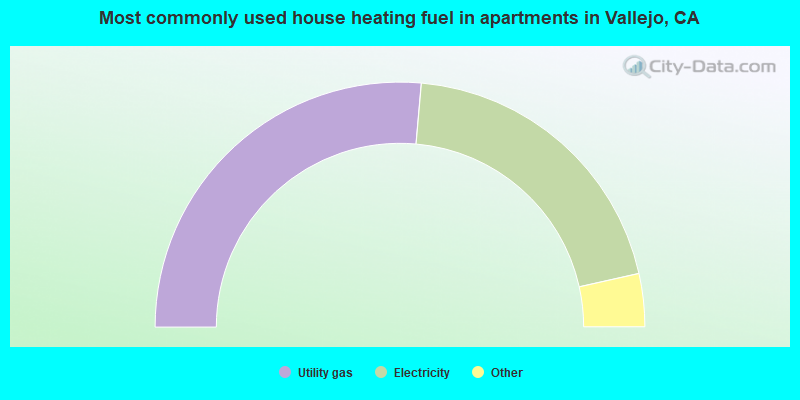
House heating fuel used in apartments - Utility gas (%)
House heating fuel used in apartments - Bottled, tank, or LP gas (%)
House heating fuel used in apartments - Electricity (%)
House heating fuel used in apartments - Fuel oil, kerosene, etc. (%)
House heating fuel used in apartments - Coal or coke (%)
House heating fuel used in apartments - Wood (%)
House heating fuel used in apartments - Solar energy (%)
House heating fuel used in apartments - Other fuel (%)
House heating fuel used in apartments - No fuel used (%)
Armed forces status - In Armed Forces (%)
Armed forces status - Civilian (%)
Armed forces status - Civilian - Veteran (%)
Armed forces status - Civilian - Nonveteran (%)
Fatal accidents locations in years 2005-2021
Fatal accidents locations in 2005
Fatal accidents locations in 2006
Fatal accidents locations in 2007
Fatal accidents locations in 2008
Fatal accidents locations in 2009
Fatal accidents locations in 2010
Fatal accidents locations in 2011
Fatal accidents locations in 2012
Fatal accidents locations in 2013
Fatal accidents locations in 2014
Fatal accidents locations in 2015
Fatal accidents locations in 2016
Fatal accidents locations in 2017
Fatal accidents locations in 2018
Fatal accidents locations in 2019
Fatal accidents locations in 2020
Fatal accidents locations in 2021
Alcohol use - People drinking some alcohol every month (%)
Alcohol use - People not drinking at all (%)
Alcohol use - Average days/month drinking alcohol
Alcohol use - Average drinks/week
Alcohol use - Average days/year people drink much
Audiometry - Average condition of hearing (%)
Audiometry - People that can hear a whisper from across a quiet room (%)
Audiometry - People that can hear normal voice from across a quiet room (%)
Audiometry - Ears ringing, roaring, buzzing (%)
Audiometry - Had a job exposure to loud noise (%)
Audiometry - Had off-work exposure to loud noise (%)
Blood Pressure & Cholesterol - Has high blood pressure (%)
Blood Pressure & Cholesterol - Checking blood pressure at home (%)
Blood Pressure & Cholesterol - Frequently checking blood cholesterol (%)
Blood Pressure & Cholesterol - Has high cholesterol level (%)
Consumer Behavior - Money monthly spent on food at supermarket/grocery store
Consumer Behavior - Money monthly spent on food at other stores
Consumer Behavior - Money monthly spent on eating out
Consumer Behavior - Money monthly spent on carryout/delivered foods
Consumer Behavior - Income spent on food at supermarket/grocery store (%)
Consumer Behavior - Income spent on food at other stores (%)
Consumer Behavior - Income spent on eating out (%)
Consumer Behavior - Income spent on carryout/delivered foods (%)
Current Health Status - General health condition (%)
Current Health Status - Blood donors (%)
Current Health Status - Has blood ever tested for HIV virus (%)
Current Health Status - Left-handed people (%)
Dermatology - People using sunscreen (%)
Diabetes - Diabetics (%)
Diabetes - Had a blood test for high blood sugar (%)
Diabetes - People taking insulin (%)
Diet Behavior & Nutrition - Diet health (%)
Diet Behavior & Nutrition - Milk product consumption (# of products/month)
Diet Behavior & Nutrition - Meals not home prepared (#/week)
Diet Behavior & Nutrition - Meals from fast food or pizza place (#/week)
Diet Behavior & Nutrition - Ready-to-eat foods (#/month)
Diet Behavior & Nutrition - Frozen meals/pizza (#/month)
Drug Use - People that ever used marijuana or hashish (%)
Drug Use - Ever used hard drugs (%)
Drug Use - Ever used any form of cocaine (%)
Drug Use - Ever used heroin (%)
Drug Use - Ever used methamphetamine (%)
Health Insurance - People covered by health insurance (%)
Kidney Conditions-Urology - Avg. # of times urinating at night
Medical Conditions - People with asthma (%)
Medical Conditions - People with anemia (%)
Medical Conditions - People with psoriasis (%)
Medical Conditions - People with overweight (%)
Medical Conditions - Elderly people having difficulties in thinking or remembering (%)
Medical Conditions - People who ever received blood transfusion (%)
Medical Conditions - People having trouble seeing even with glass/contacts (%)
Medical Conditions - People with arthritis (%)
Medical Conditions - People with gout (%)
Medical Conditions - People with congestive heart failure (%)
Medical Conditions - People with coronary heart disease (%)
Medical Conditions - People with angina pectoris (%)
Medical Conditions - People who ever had heart attack (%)
Medical Conditions - People who ever had stroke (%)
Medical Conditions - People with emphysema (%)
Medical Conditions - People with thyroid problem (%)
Medical Conditions - People with chronic bronchitis (%)
Medical Conditions - People with any liver condition (%)
Medical Conditions - People who ever had cancer or malignancy (%)
Mental Health - People who have little interest in doing things (%)
Mental Health - People feeling down, depressed, or hopeless (%)
Mental Health - People who have trouble sleeping or sleeping too much (%)
Mental Health - People feeling tired or having little energy (%)
Mental Health - People with poor appetite or overeating (%)
Mental Health - People feeling bad about themself (%)
Mental Health - People who have trouble concentrating on things (%)
Mental Health - People moving or speaking slowly or too fast (%)
Mental Health - People having thoughts they would be better off dead (%)
Oral Health - Average years since last visit a dentist
Oral Health - People embarrassed because of mouth (%)
Oral Health - People with gum disease (%)
Oral Health - General health of teeth and gums (%)
Oral Health - Average days a week using dental floss/device
Oral Health - Average days a week using mouthwash for dental problem
Oral Health - Average number of teeth
Pesticide Use - Households using pesticides to control insects (%)
Pesticide Use - Households using pesticides to kill weeds (%)
Physical Activity - People doing vigorous-intensity work activities (%)
Physical Activity - People doing moderate-intensity work activities (%)
Physical Activity - People walking or bicycling (%)
Physical Activity - People doing vigorous-intensity recreational activities (%)
Physical Activity - People doing moderate-intensity recreational activities (%)
Physical Activity - Average hours a day doing sedentary activities
Physical Activity - Average hours a day watching TV or videos
Physical Activity - Average hours a day using computer
Physical Functioning - People having limitations keeping them from working (%)
Physical Functioning - People limited in amount of work they can do (%)
Physical Functioning - People that need special equipment to walk (%)
Physical Functioning - People experiencing confusion/memory problems (%)
Physical Functioning - People requiring special healthcare equipment (%)
Prescription Medications - Average number of prescription medicines taking
Preventive Aspirin Use - Adults 40+ taking low-dose aspirin (%)
Reproductive Health - Vaginal deliveries (%)
Reproductive Health - Cesarean deliveries (%)
Reproductive Health - Deliveries resulted in a live birth (%)
Reproductive Health - Pregnancies resulted in a delivery (%)
Reproductive Health - Women breastfeeding newborns (%)
Reproductive Health - Women that had a hysterectomy (%)
Reproductive Health - Women that had both ovaries removed (%)
Reproductive Health - Women that have ever taken birth control pills (%)
Reproductive Health - Women taking birth control pills (%)
Reproductive Health - Women that have ever used Depo-Provera or injectables (%)
Reproductive Health - Women that have ever used female hormones (%)
Sexual Behavior - People 18+ that ever had sex (vaginal, anal, or oral) (%)
Sexual Behavior - Males 18+ that ever had vaginal sex with a woman (%)
Sexual Behavior - Males 18+ that ever performed oral sex on a woman (%)
Sexual Behavior - Males 18+ that ever had anal sex with a woman (%)
Sexual Behavior - Males 18+ that ever had any sex with a man (%)
Sexual Behavior - Females 18+ that ever had vaginal sex with a man (%)
Sexual Behavior - Females 18+ that ever performed oral sex on a man (%)
Sexual Behavior - Females 18+ that ever had anal sex with a man (%)
Sexual Behavior - Females 18+ that ever had any kind of sex with a woman (%)
Sexual Behavior - Average age people first had sex
Sexual Behavior - Average number of female sex partners in lifetime (males 18+)
Sexual Behavior - Average number of female vaginal sex partners in lifetime (males 18+)
Sexual Behavior - Average age people first performed oral sex on a woman (18+)
Sexual Behavior - Average number of woman performed oral sex on in lifetime (18+)
Sexual Behavior - Average number of male sex partners in lifetime (males 18+)
Sexual Behavior - Average number of male anal sex partners in lifetime (males 18+)
Sexual Behavior - Average age people first performed oral sex on a man (18+)
Sexual Behavior - Average number of male oral sex partners in lifetime (18+)
Sexual Behavior - People using protection when performing oral sex (%)
Sexual Behavior - Average number of times people have vaginal or anal sex a year
Sexual Behavior - People having sex without condom (%)
Sexual Behavior - Average number of male sex partners in lifetime (females 18+)
Sexual Behavior - Average number of male vaginal sex partners in lifetime (females 18+)
Sexual Behavior - Average number of female sex partners in lifetime (females 18+)
Sexual Behavior - Circumcised males 18+ (%)
Sleep Disorders - Average hours sleeping at night
Sleep Disorders - People that has trouble sleeping (%)
Smoking-Cigarette Use - People smoking cigarettes (%)
Taste & Smell - People 40+ having problems with smell (%)
Taste & Smell - People 40+ having problems with taste (%)
Taste & Smell - People 40+ that ever had wisdom teeth removed (%)
Taste & Smell - People 40+ that ever had tonsils teeth removed (%)
Taste & Smell - People 40+ that ever had a loss of consciousness because of a head injury (%)
Taste & Smell - People 40+ that ever had a broken nose or other serious injury to face or skull (%)
Taste & Smell - People 40+ that ever had two or more sinus infections (%)
Weight - Average height (inches)
Weight - Average weight (pounds)
Weight - Average BMI
Weight - People that are obese (%)
Weight - People that ever were obese (%)
Weight - People trying to lose weight (%)
34,652 28.0% Hispanic 29,258 23.7% Asian alone 25,047 20.3% Black alone 23,487 19.0% White alone 7,687 6.2% Two or more races 1,613 1.3% Other race alone 1,499 1.2% Native Hawaiian and Other 340 0.3% American Indian alone
The City-Data.com crime index weighs serious crimes and violent crimes more heavily. Higher means more crime, U.S. average is 246.1. It adjusts for the number of visitors and daily workers commuting into cities.
- means the value is smaller than the state average.
- means the value is about the same as the state average.
- means the value is bigger than the state average.
- means the value is much bigger than the state average.
Crime rate in Vallejo detailed stats: murders, rapes, robberies, assaults, burglaries, thefts, arson Officers per 1,000 residents here:
0.81California average:
2.30
Latest news from Vallejo, CA collected exclusively by city-data.com from local newspapers, TV, and radio stations
Ancestries: German (2.1%), American (2.0%), African (1.7%), Irish (1.5%), Italian (1.3%), English (1.1%).
Current Local Time:
Land area: 30.2 square miles.
Population density: 4,093 people per square mile (average).
33,117 residents are foreign born (14.3% Asia , 9.9% Latin America ).
This city:
26.6%California:
26.5%
Median real estate property taxes paid for housing units with mortgages in 2022: $5,059 (0.8%)Median real estate property taxes paid for housing units with no mortgage in 2022: $3,613 (0.7%)
Nearest city with pop. 200,000+: West Contra Costa, CA (11.8 miles
Nearest city with pop. 1,000,000+: Los Angeles, CA
Nearest cities:
Creston, CA (2.6 miles),
Latitude: 38.11 N, Longitude: 122.24 W
Daytime population change due to commuting: -25,290 (-20.5%)Workers who live and work in this city: 19,134 (33.1%)
Vallejo tourist attractions:
Single-family new house construction building permits:
2022: 17 buildings , average cost: $278,1002021: 30 buildings , average cost: $224,7002020: 27 buildings , average cost: $105,8002019: 54 buildings , average cost: $273,9002018: 51 buildings , average cost: $271,3002017: 43 buildings , average cost: $273,9002016: 39 buildings , average cost: $271,1002015: 27 buildings , average cost: $266,5002014: 17 buildings , average cost: $256,8002012: 27 buildings , average cost: $244,1002011: 25 buildings , average cost: $223,1002010: 38 buildings , average cost: $221,4002009: 45 buildings , average cost: $226,7002008: 9 buildings , average cost: $208,5002007: 70 buildings , average cost: $272,2002006: 85 buildings , average cost: $201,1002005: 331 buildings , average cost: $194,3002004: 475 buildings , average cost: $178,9002003: 236 buildings , average cost: $183,7002002: 459 buildings , average cost: $200,9002001: 363 buildings , average cost: $210,0002000: 487 buildings , average cost: $211,0001999: 438 buildings , average cost: $193,6001998: 398 buildings , average cost: $185,0001997: 146 buildings , average cost: $177,200Unemployment in December 2023:
Population change in the 1990s: +4,602 (+4.1%).
Most common occupations in Vallejo, CA (%)
Both Males Females
Other management occupations, except farmers and farm managers (5.5%)
Cooks and food preparation workers (5.0%)
Building and grounds cleaning and maintenance occupations (4.1%)
Material recording, scheduling, dispatching, and distributing workers (3.3%)
Cashiers (3.2%)
Registered nurses (3.2%)
Health technologists and technicians (3.2%)
Building and grounds cleaning and maintenance occupations (6.0%)
Other management occupations, except farmers and farm managers (5.1%)
Material recording, scheduling, dispatching, and distributing workers (4.7%)
Cooks and food preparation workers (4.7%)
Driver/sales workers and truck drivers (4.7%)
Electrical equipment mechanics and other installation, maintenance, and repair workers, including supervisors (3.8%)
Other production occupations, including supervisors (3.7%)
Other management occupations, except farmers and farm managers (5.9%)
Registered nurses (5.4%)
Cooks and food preparation workers (5.3%)
Cashiers (4.8%)
Supervisors and other personal care and service workers, except child care workers (4.5%)
Secretaries and administrative assistants (4.4%)
Health technologists and technicians (4.3%)
Earthquake activity:
Vallejo-area historical earthquake activity is significantly above California state average. It is 7598% greater than the overall U.S. average. On 4/18/1906 at 13:12:21, a magnitude 7.9 (7.9 UK, Class: Major, Intensity: VIII - XII) earthquake occurred 42.3 miles away from Vallejo center, causing $524,000,000 total damage On 10/18/1989 at 00:04:15, a magnitude 7.1 (6.5 MB, 7.1 MS, 6.9 MW, 7.0 ML) earthquake occurred 73.9 miles away from the city center, causing 62 deaths ( 62 shaking deaths) and 3757 injuries, causing $1,305,032,704 total damage On 1/31/1922 at 13:17:28, a magnitude 7.6 (7.6 UK) earthquake occurred 251.8 miles away from Vallejo center On 11/4/1927 at 13:51:53, a magnitude 7.5 (7.5 UK) earthquake occurred 231.1 miles away from the city center On 7/21/1952 at 11:52:14, a magnitude 7.7 (7.7 UK) earthquake occurred 280.5 miles away from Vallejo center, causing $50,000,000 total damage On 4/25/1992 at 18:06:04, a magnitude 7.2 (6.3 MB, 7.1 MS, 7.2 MW, 7.1 MW, Depth: 9.4 mi) earthquake occurred 183.2 miles away from the city center, causing $75,000,000 total damage Magnitude types: body-wave magnitude (MB), local magnitude (ML), surface-wave magnitude (MS), moment magnitude (MW) Natural disasters: The number of natural disasters in Solano County (23) is greater than the US average (15).Major Disasters (Presidential) Declared: 15Emergencies Declared: 2Floods: 13, Storms: 7, Winter Storms: 5, Fires: 4, Mudslides: 4, Landslides: 3, Earthquakes: 2, Drought: 1, Freeze: 1, Heavy Rain: 1, Hurricane: 1, Tornado: 1, Other: 1 (Note: some incidents may be assigned to more than one category). Hospitals in Vallejo: GREENFIELDS I ICF-DDN (219 TORREY PINES COURT) GREENFIELDS III ICF-DDN (100 MORGAN STREET) KAISER FOUNDATION HOSPITAL AND REHAB CENTER (Voluntary non-profit - Other, provides emergency services, 975 SERENO DR) KAISER FOUNDATION HOSPITAL HOSPICE - VALLEJO (975 SERENO DRIVE) PARADISE HOME DONCASTER (312 DONCASTER STREET) SANTA LUCIA (11 MARSHALL WAY) ST. HELENA HOSPITAL CENTER FOR BEHAVIORAL HEALTH (525 OREGON ST) SUTTER SOLANO MEDICAL CENTER (Voluntary non-profit - Private, 300 HOSPITAL DR) TWIN RESIDENTIAL (101 HAWKESBURY CT) TYSON HOME (624 MINI DRIVE) Amtrak station: VALLEJO-MARINE WORLD (1000 FAIRGROUNDS DR.) - Bus Station
.
Services: fully wheelchair accessible, public restrooms, public payphones, snack bar, free short-term parking, free long-term parking, call for taxi service.
Colleges/Universities in Vallejo: California Maritime Academy Full-time enrollment: 1,209; Location: 200 Maritime Academy Dr; Public; Website: www.csum.edu)
Touro University California Full-time enrollment: 360; Location: 1310 Club Drive; Private, not-for-profit; Website: www.tu.edu/; Offers Doctor's degree )
Hinton Barber College Full-time enrollment: 30; Location: 1029-A Tennessee St; Private, for-profit; Website: hintonbarber.com)
Colleges/universities with over 2000 students nearest to Vallejo:
Solano Community College (about 11 miles; Fairfield, CA ; Full-time enrollment: 5,790)
Napa Valley College (about 12 miles; Napa, CA ; FT enrollment: 3,780)
Contra Costa College (about 12 miles; San Pablo, CA ; FT enrollment: 4,249)
Diablo Valley College (about 14 miles; Pleasant Hill, CA ; FT enrollment: 13,015)
University of California-Berkeley (about 17 miles; Berkeley, CA ; FT enrollment: 37,127)
Berkeley City College (about 17 miles; Berkeley, CA ; FT enrollment: 3,146)
Saint Mary's College of California (about 21 miles; Moraga, CA ; FT enrollment: 4,200)
Public high schools in Vallejo: VALLEJO HIGH Students: 1,029, Location: 840 NEBRASKA ST., Grades: 9-12)JESSE M. BETHEL HIGH Students: 910, Location: 1800 ASCOT PKWY., Grades: 9-12)MIT ACADEMY Students: 202, Location: 2 POSITIVE PL., Grades: 9-12, Charter school )VALLEJO EDUCATION ACADEMY Students: 13, Location: 301 FARRAGUT AVE., Grades: 7-12)JOHN FINNEY HIGH (CONTINUATION) Location: 233 HOBBS AVE., Grades: 9-12)
Private high schools in Vallejo: ST PATRICK-ST VINCENT HIGH SCHOOL Students: 534, Location: 1500 BENICIA RD, Grades: 9-12)
NORTH HILLS CHRISTIAN SCHOOL Students: 304, Location: 200 ADMIRAL CALLAGHAN LN, Grades: PK-12)
STARTING GATE SCHOOL Students: 167, Location: 579 COUCH ST, Grades: UG-12)
JESUS IS ALIVE CHRISTIAN ACADEMY Students: 20, Location: 414 TENNESSEE ST, Grades: 1-12)
ASPIRE 2 ACHIEVE Students: 12, Location: 1350 AMADOR ST, Grades: 7-12)
Biggest public elementary/middle schools in Vallejo: HOGAN MIDDLE Students: 832, Location: 850 ROSEWOOD AVE., Grades: 6-8)FRANKLIN MIDDLE Students: 680, Location: 501 STARR AVE., Grades: 6-8)SOLANO MIDDLE Students: 594, Location: 1025 CORCORAN AVE., Grades: 6-8)JOSEPH H. WARDLAW ELEMENTARY Students: 513, Location: 1698 OAKWOOD AVE., Grades: KG-5)DAN MINI ELEMENTARY Students: 400, Location: 1530 LORENZO DR., Grades: KG-5)STEFFAN MANOR ELEMENTARY Students: 352, Location: 815 CEDAR ST., Grades: KG-5)ANNIE PENNYCOOK ELEMENTARY Students: 351, Location: 3620 FERNWOOD DR., Grades: KG-5)GLEN COVE ELEMENTARY Students: 351, Location: 501 GLEN COVE PKWY., Grades: KG-5)ELSA WIDENMANN ELEMENTARY Students: 332, Location: 100 WHITNEY DR., Grades: KG-5)JOHNSTON COOPER ELEMENTARY Students: 292, Location: 612 DEL MAR ST., Grades: KG-5)Private elementary/middle schools in Vallejo: ST BASIL ELEMENTARY SCHOOL Students: 371, Location: 1230 NEBRASKA ST, Grades: PK-8)
ST VINCENT FERRER SCHOOL Students: 342, Location: 420 FLORIDA ST, Grades: PK-8)
ST CATHERINE OF SIENA SCHOOL Students: 329, Location: 3460 TENNESSEE ST, Grades: PK-8)
SPECIAL TOUCH LEARNING ACADEMY Students: 13, Location: 902 NEBRASKA ST, Grades: PK-1)
See full list of schools located in Vallejo User-submitted facts and corrections:
Vallejo is a nice state with good people. Full of adventure and excitement, you don't know what you can find here! added by Blu-J
Notable locations in Vallejo: (A) , Glen Cove Marina (B) , Joe Mortara Municipal Golf Course (C) , Vallejo Marina (D) , Vallejo Boat Launch Ramp (E) , Pier 23 (F) , Pier 22 (G) , Pier 21 (H) , Mare Island Golf Course (I) , Vallejo Municipal Golf Course (J) , King-South Vallejo Community Center (K) , California Maritime Academy Library (L) , Veterans Memorial Building (M) , Vallejo Naval and Historical Museum (N) , Vallejo City Hall (O) , Solano County Jail (P) , Saint Vincents Memorial Building (Q) , John F Kennedy Branch Solano County Public Library (R) , Vallejo Fire Department Station 6 (S) , Vallejo Fire Department Station 2 (T) . Display/hide their locations on the map
Shopping Centers: (1) , Redwood Square Shopping Center (2) , Flemingtowne Shopping Center (3) , Sereno Square Shopping Center (4) . Display/hide their locations on the map
Churches in Vallejo include: (A) , Church of God in Christ (B) , Church of the Nazarene (C) , Fellowship Methodist Church (D) , First Assembly of God Church (E) , First Baptist Church (F) , First Christian Church (G) , First Church of Christ (H) , First Church of Christ Scientist (I) . Display/hide their locations on the map
Cemeteries: (1) , Sunrise Memorial Cemetery (2) , Carquinez Cemetery (3) , Old Hillside Cemetery (4) , Saint Vincent Cemetery (5) . Display/hide their locations on the map
Reservoirs: (A) , Lake Dalwigk (B) , Swanzy Reservoir (C) , Lake Chabot (D) . Display/hide their locations on the map
Creeks: (A) , Austin Creek (B) , Rindler Creek (C) . Display/hide their locations on the map
Parks in Vallejo include: (1) , Wilson Park (2) , Independence Park (3) , River Park (4) , Terrace Park (5) , Africa USA Park (6) , Borges Ranch Park (7) , Crest Ranch Park (8) , Dan Foley Park (9) . Display/hide their locations on the map
Tourist attraction: (1) . Display/hide its approximate location on the map
Hotels: (1) , A White Cottage Motel (103 Lincoln Road West) (2) , Bays Inn (446 Lincoln Road East) (3) , Budget Inn (816 Magazine Street) (4) . Display/hide their approximate locations on the map
Courts: (1) , Solano County - Courts-Solano County- Vallejo-Benicia Branch Court- Criminal Divi (321 Tuolumne) (2) , Solano County - Courts-Solano County- Vallejo-Benicia Branch Court- Jury Informa (321 Tuolumne) (3) , Solano County - Courts-Solano County- Vallejo-Benicia Branch Court- Superior Court Commissio (321 Tuolumne) (4) , Solano County - Courts-Solano County- Vallejo-Benicia Branch Court- Traffic Divi (321 Tuolumne) (5) . Display/hide their approximate locations on the map
Birthplace of: Bill Buckner - Baseball player and coach, Richie Anderson (BMX rider) - Bicycle motocross rider, Jahvid Best - Football player, Natalie Coughlin - College swimmer, Johnny Otis - Musician, Boone Kirkman - Boxer, Droop-E - Musician, E-40 - Rapper, Turf Talk - Rapper, Mac Mall - Rapper.
Solano County has a predicted average indoor radon screening level less than 2 pCi/L (pico curies per liter) - Low Potential Drinking water stations with addresses in Vallejo and their reported violations in the past:
HOLLAND RIVERSIDE MARINA (Population served: 45, Groundwater):
Past monitoring violations:
Monitoring, Repeat Major (TCR) - In JUN-2005, Contaminant: Coliform (TCR). Follow-up actions: St Formal NOV issued (JUL-11-2005)
Monitoring, Repeat Major (TCR) - In JUN-2005, Contaminant: Coliform (TCR). Follow-up actions: St Formal NOV issued (JUL-11-2005)
Average household size: This city:
2.8 peopleCalifornia:
2.9 people
Percentage of family households: This city:
68.5%Whole state:
68.7%
Percentage of households with unmarried partners: This city:
8.1%Whole state:
7.2%
Likely homosexual households (counted as self-reported same-sex unmarried-partner households)
Lesbian couples: 0.6% of all households Gay men: 0.6% of all households
People in group quarters in Vallejo in 2010:
483 people in nursing facilities/skilled-nursing facilities
439 people in college/university student housing
207 people in other noninstitutional facilities
177 people in group homes intended for adults
129 people in residential treatment centers for adults
125 people in workers' group living quarters and job corps centers
53 people in emergency and transitional shelters (with sleeping facilities) for people experiencing homelessness
31 people in group homes for juveniles (non-correctional)
15 people in in-patient hospice facilities
4 people in correctional residential facilities
People in group quarters in Vallejo in 2000:
644 people in nursing homes
295 people in other noninstitutional group quarters
221 people in other nonhousehold living situations
171 people in homes or halfway houses for drug/alcohol abuse
141 people in mental (psychiatric) hospitals or wards
111 people in homes for the mentally retarded
67 people in job corps and vocational training facilities
46 people in homes for the mentally ill
19 people in hospitals/wards and hospices for chronically ill
19 people in hospices or homes for chronically ill
9 people in wards in general hospitals for patients who have no usual home elsewhere
9 people in other group homes
6 people in unknown juvenile institutions
3 people in military barracks, etc.
3 people in religious group quarters
Banks with most branches in Vallejo (2011 data):
Wells Fargo Bank, National Association: Glen Cove Branch, Vallejo Raley's Branch, Vallejo Branch, Redwood Plaza Branch. Info updated 2011/04/05: Bank assets: $1,161,490.0 mil, Deposits: $905,653.0 mil, headquarters in Sioux Falls, SD, positive income , 6395 total offices , Holding Company: Wells Fargo & Company
Bank of America, National Association: Vallejo Plaza Branch at 3445 Sonoma Boulevard, branch established on 1904/10/17; Springstowne Branch at 21 Springstowne Shopping Center, branch established on 1956/12/04. Info updated 2009/11/18: Bank assets: $1,451,969.3 mil, Deposits: $1,077,176.8 mil, headquarters in Charlotte, NC, positive income , 5782 total offices , Holding Company: Bank Of America Corporation
Bank of the West: Vallejo Downtown Branch at 303 Sacramento Street, branch established on 1968/03/22; Park Place Branch at 4300 Sonoma Boulevard Suite 300, branch established on 1990/08/14. Info updated 2009/11/16: Bank assets: $62,408.3 mil, Deposits: $43,995.2 mil, headquarters in San Francisco, CA, positive income , 647 total offices , Holding Company: Bnp Paribas
JPMorgan Chase Bank, National Association: Tennessee Street Branch at 901 Tennessee Street, branch established on 1988/12/27; Admiral Callaghan Branch at 972a Admiral Callaghan Lane, branch established on 2006/10/02. Info updated 2011/11/10: Bank assets: $1,811,678.0 mil, Deposits: $1,190,738.0 mil, headquarters in Columbus, OH, positive income , International Specialization, 5577 total offices , Holding Company: Jpmorgan Chase & Co.
U.S. Bank National Association: Vallejo Branch at 1200 Tennessee Street, branch established on 1985/06/30; Lincoln Road Safeway Branch at 702 Lincoln Road West, branch established on 2003/11/10. Info updated 2012/01/30: Bank assets: $330,470.8 mil, Deposits: $236,091.5 mil, headquarters in Cincinnati, OH, positive income , 3121 total offices , Holding Company: U.S. Bancorp
First Bank: Vallejo Branch at 116 Springstowne Center, branch established on 1981/10/14. Info updated 2007/12/04: Bank assets: $6,579.8 mil, Deposits: $5,800.6 mil, headquarters in Creve Coeur, MO, negative income in the last year , Commercial Lending Specialization, 148 total offices , Holding Company: First Banks, Inc.
Umpqua Bank: Vallejo Branch at 976 A Admiral Callaghan Lane, branch established on 2002/01/16. Info updated 2011/09/02: Bank assets: $11,556.7 mil, Deposits: $9,325.3 mil, headquarters in Roseburg, OR, positive income , Commercial Lending Specialization, 193 total offices , Holding Company: Umpqua Holdings Corporation
Union Bank, National Association: Vallejo Branch at 1178 Admiral Callaghan Lane, branch established on 1993/11/26. Info updated 2011/09/01: Bank assets: $88,967.5 mil, Deposits: $65,286.4 mil, headquarters in San Francisco, CA, positive income , Commercial Lending Specialization, 403 total offices , Holding Company: Mitsubishi Ufj Financial Group, Inc.
Westamerica Bank: Vallejo Branch at 1660 Tennessee Street, branch established on 1988/05/02. Info updated 2011/06/21: Bank assets: $4,998.1 mil, Deposits: $4,253.2 mil, headquarters in San Rafael, CA, positive income , Commercial Lending Specialization, 98 total offices , Holding Company: Westamerica Bancorporation
For population 15 years and over in Vallejo:
Never married: 37.4%Now married: 44.4%Separated: 2.0%Widowed: 4.7%Divorced: 11.4% For population 25 years and over in Vallejo:
High school or higher: 85.0%Bachelor's degree or higher: 27.7%Graduate or professional degree: 7.6%Unemployed: 7.6%Mean travel time to work (commute): 30.0 minutes
Education Gini index (Inequality in education) Here:
13.4California average:
15.5
Religion statistics for Vallejo, CA (based on Solano County data)
Religion Adherents Congregations Catholic 81,158 10 Evangelical Protestant 47,081 181 Other 15,086 45 Mainline Protestant 8,849 40 Black Protestant 2,567 16 Orthodox 566 2 None 258,037 -
Source: Clifford Grammich, Kirk Hadaway, Richard Houseal, Dale E.Jones, Alexei Krindatch, Richie Stanley and Richard H.Taylor. 2012. 2010 U.S.Religion Census: Religious Congregations & Membership Study. Association of Statisticians of American Religious Bodies. Jones, Dale E., et al. 2002. Congregations and Membership in the United States 2000. Nashville, TN: Glenmary Research Center. Graphs represent county-level data
Food Environment Statistics: Number of grocery stores : 78Here :
1.92 / 10,000 pop.California :
2.14 / 10,000 pop.
Number of supercenters and club stores : 4Solano County :
0.10 / 10,000 pop.California :
0.04 / 10,000 pop.
Number of convenience stores (no gas) : 21This county :
0.52 / 10,000 pop.California :
0.62 / 10,000 pop.
Number of convenience stores (with gas) : 91Solano County :
2.24 / 10,000 pop.California :
1.49 / 10,000 pop.
Number of full-service restaurants : 221Here :
5.43 / 10,000 pop.California :
7.42 / 10,000 pop.
Adult diabetes rate : Solano County :
9.8%California :
7.3%
Adult obesity rate : This county :
25.1%California :
21.3%
Low-income preschool obesity rate : Solano County :
17.4%California :
17.9%
Health and Nutrition: Healthy diet rate : Here:
51.3%California:
49.4%
Average overall health of teeth and gums : People feeling badly about themselves : This city:
18.6%California:
20.2%
People not drinking alcohol at all : Vallejo:
15.2%California:
11.2%
Average hours sleeping at night : Vallejo:
6.7California:
6.8
Overweight people : This city:
30.8%California:
31.5%
General health condition : Here:
56.1%California:
56.4%
Average condition of hearing : This city:
81.7%California:
80.9%
More about Health and Nutrition of Vallejo, CA Residents
Local government employment and payroll (March 2022)
Function
Full-time employees
Monthly full-time payroll
Average yearly full-time wage
Part-time employees
Monthly part-time payroll
Police Protection - Officers
203 $3,202,145 $189,289 0 $0 Natural Resources
87 $956,549 $131,938 0 $0 Water Supply
84 $691,491 $98,784 0 $0 Firefighters
80 $1,157,456 $173,618 0 $0 Streets and Highways
75 $535,138 $85,622 0 $0 Police - Other
75 $582,562 $93,210 16 $41,044 Other Government Administration
36 $371,728 $123,909 6 $12,790 Financial Administration
28 $242,377 $103,876 0 $0 Judicial and Legal
12 $132,217 $132,217 0 $0 Housing and Community Development (Local)
10 $73,684 $88,421 0 $0 Fire - Other
5 $44,466 $106,718 0 $0 Parks and Recreation
3 $18,147 $72,588 0 $0
Totals for Government
698 $8,007,960 $137,673 22 $53,834
Vallejo government finances - Expenditure in 2017 (per resident):
Construction - Transit Utilities: $6,407,000 ($51.85)
Regular Highways: $5,927,000 ($47.97)Central Staff Services: $893,000 ($7.23)Water Utilities: $741,000 ($6.00)Parks and Recreation: $428,000 ($3.46)Housing and Community Development: $401,000 ($3.25)Current Operations - Police Protection: $41,241,000 ($333.76)
Water Utilities: $27,675,000 ($223.97)Housing and Community Development: $26,386,000 ($213.54)Local Fire Protection: $23,259,000 ($188.23)Sewerage: $21,573,000 ($174.59)Central Staff Services: $15,117,000 ($122.34)Regular Highways: $13,062,000 ($105.71)Health - Other: $3,255,000 ($26.34)Parks and Recreation: $2,816,000 ($22.79)Sea and Inland Port Facilities: $1,747,000 ($14.14)Solid Waste Management: $1,428,000 ($11.56)Protective Inspection and Regulation - Other: $1,358,000 ($10.99)Financial Administration: $982,000 ($7.95)Parking Facilities: $779,000 ($6.30)Libraries: $151,000 ($1.22)General - Other: $16,000 ($0.13)General - Interest on Debt: $3,259,000 ($26.37)
Other Capital Outlay - General - Other: $6,238,000 ($50.48)
Parks and Recreation: $1,367,000 ($11.06)General Public Building: $215,000 ($1.74)Protective Inspection and Regulation - Other: $111,000 ($0.90)Local Fire Protection: $19,000 ($0.15)Total Salaries and Wages: $12,775,000 ($103.39)
Water Utilities - Interest on Debt: $2,455,000 ($19.87)
Vallejo government finances - Revenue in 2017 (per resident):
Charges - Sewerage: $29,128,000 ($235.73)
Other: $14,504,000 ($117.38)Parks and Recreation: $2,565,000 ($20.76)Solid Waste Management: $1,409,000 ($11.40)Sea and Inland Port Facilities: $1,327,000 ($10.74)Parking Facilities: $781,000 ($6.32)Housing and Community Development: $54,000 ($0.44)Federal Intergovernmental - Other: $24,146,000 ($195.41)
Housing and Community Development: $1,496,000 ($12.11)Local Intergovernmental - Other: $156,000 ($1.26)
Miscellaneous - General Revenue - Other: $10,132,000 ($82.00)
Special Assessments: $3,398,000 ($27.50)Interest Earnings: $1,835,000 ($14.85)Rents: $1,453,000 ($11.76)Fines and Forfeits: $1,197,000 ($9.69)Donations From Private Sources: $216,000 ($1.75)Sale of Property: $110,000 ($0.89)Revenue - Water Utilities: $28,471,000 ($230.42)
State Intergovernmental - Other: $5,067,000 ($41.01)
Highways: $2,446,000 ($19.80)General Local Government Support: $195,000 ($1.58)Sewerage: $4,000 ($0.03)Tax - Property: $30,127,000 ($243.82)
Other License: $18,896,000 ($152.92)Public Utilities Sales: $18,017,000 ($145.81)General Sales and Gross Receipts: $14,340,000 ($116.05)Occupation and Business License - Other: $3,815,000 ($30.87)Documentary and Stock Transfer: $2,652,000 ($21.46)Other Selective Sales: $2,483,000 ($20.09)
Vallejo government finances - Debt in 2017 (per resident):
Long Term Debt - Beginning Outstanding - Unspecified Public Purpose: $107,195,000 ($867.53)
Outstanding Unspecified Public Purpose: $99,789,000 ($807.59)Beginning Outstanding - Public Debt for Private Purpose: $27,234,000 ($220.40)Outstanding Nonguaranteed - Industrial Revenue: $26,339,000 ($213.16)Retired Unspecified Public Purpose: $7,786,000 ($63.01)Retired Nonguaranteed - Public Debt for Private Purpose: $895,000 ($7.24)Issue, Unspecified Public Purpose: $380,000 ($3.08)
Vallejo government finances - Cash and Securities in 2017 (per resident):
Bond Funds - Cash and Securities: $37,402,000 ($302.69)
Other Funds - Cash and Securities: $153,578,000 ($1242.90)
Sinking Funds - Cash and Securities: $29,040,000 ($235.02)
6.92% of this county's 2021 resident taxpayers lived in other counties in 2020 ($66,832 average adjusted gross income )
Here:
6.92%California average:
5.19%
0.10% of residents moved from foreign countries ($924 average AGI )Solano County:
0.10%California average:
0.03%
Top counties from which taxpayers relocated into this county between 2020 and 2021:
7.45% of this county's 2020 resident taxpayers moved to other counties in 2021 ($71,700 average adjusted gross income )
Here:
7.45%California average:
6.14%
0.08% of residents moved to foreign countries ($756 average AGI )Solano County:
0.08%California average:
0.02%
Top counties to which taxpayers relocated from this county between 2020 and 2021:
Businesses in Vallejo, CA
Name Count Name Count
24 Hour Fitness 1 Kroger 1 7-Eleven 4 La-Z-Boy 1 99 Cents Only Stores 1 Lane Furniture 1 AT&T 2 Little Caesars Pizza 1 Ace Hardware 1 Long John Silver's 1 Applebee's 1 Lowe's 1 Arby's 1 Marriott 1 AutoZone 1 Marshalls 1 Avenue 1 MasterBrand Cabinets 5 Baskin-Robbins 3 Mazda 1 Bed Bath & Beyond 1 McDonald's 6 Ben & Jerry's 3 Motel 6 3 Best Western 1 Nike 2 Budget Car Rental 1 Nissan 1 Burger King 2 OfficeMax 1 CVS 2 Olive Garden 1 Carl\s Jr. 2 Panda Express 2 Chevrolet 1 Payless 2 Church's Chicken 1 Penske 1 Cold Stone Creamery 3 Pier 1 Imports 1 Comfort Inn 1 Pizza Hut 2 Costco 1 Popeyes 2 Curves 1 Quiznos 1 DHL 1 RadioShack 2 Dairy Queen 1 Ramada 1 Dennys 2 Red Lobster 1 Domino's Pizza 2 Rite Aid 1 FedEx 8 Safeway 3 GNC 2 Sprint Nextel 1 GameStop 1 Starbucks 6 H&R Block 2 T-Mobile 5 Home Depot 1 Taco Bell 3 Honda 1 Target 1 Howard Johnson 1 Toyota 1 IHOP 1 Toys"R"Us 1 Jack In The Box 3 U-Haul 5 Jamba Juice 1 UPS 9 Johnny Rockets 1 Vons 3 KFC 2 Walgreens 2 Kohl's 1 Wendy's 2
Strongest AM radio stations in Vallejo:
KDYA (1190 AM; 10 kW; VALLEJO, CA; Owner: BAYBRIDGE COMMUNICATIONS, L.L.C.)
KDIA (1640 AM; 10 kW; VALLEJO, CA; Owner: BAYBRIDGE COMMUNICATIONS, L.L.C.)
KCBS (740 AM; 50 kW; SAN FRANCISCO, CA; Owner: INFINITY BROADCASTING OPERATIONS, INC.)
KTRB (860 AM; 50 kW; MODESTO, CA; Owner: PAPPAS RADIO OF CALIFORNIA, A CALIFORNIA LIMITED PARTNERSHIP)
KNEW (910 AM; 20 kW; OAKLAND, CA; Owner: AMFM RADIO LICENSES, L.L.C.)
KIQI (1010 AM; 35 kW; SAN FRANCISCO, CA; Owner: RADIO UNICA OF SAN FRANCISCO LICENSE CORP.)
KNBR (680 AM; 50 kW; SAN FRANCISCO, CA; Owner: KNBR LICO, INC.)
KTCT (1050 AM; 50 kW; SAN MATEO, CA; Owner: SUSQUEHANNA RADIO CORP.)
KFAX (1100 AM; 50 kW; SAN FRANCISCO, CA; Owner: GOLDEN GATE BROADCASTING CO, INC.)
KGO (810 AM; 50 kW; SAN FRANCISCO, CA; Owner: KGO-AM RADIO, INC.)
KVON (1440 AM; 5 kW; NAPA, CA; Owner: CBM NAPA, LLC)
KFRC (610 AM; 5 kW; SAN FRANCISCO, CA; Owner: INFINITY BROADCASTING CORPORATION OF LOS ANGELES)
KATD (990 AM; 10 kW; PITTSBURG, CA; Owner: RADIO UNICA OF SACRAMENTO LICENSE CORP.)
Strongest FM radio stations in Vallejo:
KUIC-FM2 (95.3 FM; VALLEJO, CA; Owner: QUICK BROADCASTING CORPORATION)
KKSF-FM1 (103.7 FM; PLEASANTON, ETC., CA; Owner: AMFM RADIO LICENSES, L.L.C.)
KBLX-FM2 (102.9 FM; PLEASANTON, CA; Owner: ICBC BROADCAST HOLDINGS -CA, INC.)
KSOL-FM3 (98.9 FM; PLEASANTON, CA; Owner: TMS LICENSE CALIFORNIA, INC)
KFRC-FM3 (99.7 FM; WALNUT CREEK, CA; Owner: INFINITY KFRC-FM, INC.)
KZBR-FM1 (95.7 FM; WALNUT CREEK, CA; Owner: BONNEVILLE HOLDING COMPANY)
KISQ-FM3 (98.1 FM; CONCORD, CA; Owner: AMFM RADIO LICENSES, L.L.C.)
KSFB-FM (100.7 FM; SAN RAFAEL, CA; Owner: GOLDEN GATE BROADCASTING COMPANY, INC.)
KMEL-FM1 (106.1 FM; CONCORD, CA; Owner: AMFM RADIO LICENSES, L.L.C.)
KUIC (95.3 FM; VACAVILLE, CA; Owner: KUIC, INC.)
KDFC-FM1 (102.1 FM; LAFAYETTE, CA; Owner: BONNEVILLE HOLDING COMPANY)
KOIT-FM2 (96.5 FM; MARTINEZ, ETC., CA; Owner: BONNEVILLE HOLDING CO. C/O KOIT(FM))
KIOI-FM1 (101.3 FM; WALNUT CREEK, CA; Owner: AMFM RADIO LICENSES, L.L.C.)
KLLC (97.3 FM; SAN FRANCISCO, CA; Owner: INFINITY BROADCASTING OPERATIONS, INC.)
KFJO (92.1 FM; WALNUT CREEK, CA; Owner: CHASE RADIO PROPERTIES, L.L.C.)
KDFC-FM (102.1 FM; SAN FRANCISCO, CA; Owner: BONNEVILLE HOLDING COMPANY)
KNDL (89.9 FM; ANGWIN, CA; Owner: HOWELL MOUNTAIN BROADCASTING COMPANY)
KLVR (91.9 FM; SANTA ROSA, CA; Owner: EDUCATIONAL MEDIA FOUNDATION)
KOIT-FM (96.5 FM; SAN FRANCISCO, CA; Owner: BONNEVILLE HOLDING COMPANY)
KXTS (100.9 FM; CALISTOGA, CA; Owner: SINCLAIR TELECABLE, INC.)
TV broadcast stations around Vallejo:
KQED (Channel 9; SAN FRANCISCO, CA; Owner: KQED, INC.)
KGO-TV (Channel 7; SAN FRANCISCO, CA; Owner: KGO TELEVISION, INC.)
KPIX-TV (Channel 5; SAN FRANCISCO, CA; Owner: CBS BROADCASTING INC.)
KSPX (Channel 29; SACRAMENTO, CA; Owner: PAXSON SACRAMENTO LICENSE, INC.)
KOVR (Channel 13; STOCKTON, CA; Owner: SCI - SACRAMENTO LICENSEE, LLC)
KXTV (Channel 10; SACRAMENTO, CA; Owner: KXTV, INC.)
KCRA-TV (Channel 3; SACRAMENTO, CA; Owner: KCRA HEARST-ARGYLE TELEVISION, INC.)
KTNC-TV (Channel 42; CONCORD, CA; Owner: KTNC LICENSE, LLC)
KTXL (Channel 40; SACRAMENTO, CA; Owner: CHANNEL 40, INC.)
KTVU (Channel 2; OAKLAND, CA; Owner: KTVU PARTNERSHIP)
KUVS (Channel 19; MODESTO, CA; Owner: KUVS LICENSE PARTNERSHIP, G.P.)
KQCA (Channel 58; STOCKTON, CA; Owner: KCRA HEARST-ARGYLE TELEVISION, INC.)
KVIE (Channel 6; SACRAMENTO, CA; Owner: KVIE, INC.)
KMAX-TV (Channel 31; SACRAMENTO, CA; Owner: UPN STATIONS GROUP INC.)
KRON-TV (Channel 4; SAN FRANCISCO, CA; Owner: YOUNG BROADCASTING OF SAN FRANCISCO, INC.)
KMTP-TV (Channel 32; SAN FRANCISCO, CA; Owner: MINORITY TELEVISION PROJECT)
KBHK-TV (Channel 44; SAN FRANCISCO, CA; Owner: VIACOM TELEVISION STATIONS GROUP OF SAN FRANCISCO INC.)
KBWB (Channel 20; SAN FRANCISCO, CA; Owner: KBWB LICENSE, INC.)
KFSF (Channel 66; VALLEJO, CA; Owner: TELEFUTURA SAN FRANCISCO LLC)
KCNS (Channel 38; SAN FRANCISCO, CA; Owner: WRAY, INC.)
KCSM-TV (Channel 60; SAN MATEO, CA; Owner: SAN MATEO COUNTY COMMUNITY COLLEGE DISTRICT)
Medal of Honor Recipients
Medal of Honor Recipient born in Vallejo: Anund C. Roark.
National Bridge Inventory (NBI) Statistics 92 Number of bridges2,753ft / 839m Total length $41,537,000 Total costs3,707,556 Total average daily traffic234,750 Total average daily truck traffic
New bridges - historical statistics
1 1910-1919 1 1930-1939 4 1940-1949 17 1950-1959 12 1960-1969 23 1970-1979 5 1980-1989 7 1990-1999 22 2000-2009
See full National Bridge Inventory statistics for Vallejo, CA
Home Mortgage Disclosure Act Aggregated Statistics For Year 2009(Based on 21 full and 10 partial tracts) A) FHA, FSA/RHS & VA B) Conventional C) Refinancings D) Home Improvement Loans E) Loans on Dwellings For 5+ Families F) Non-occupant Loans on G) Loans On Manufactured Number Average Value Number Average Value Number Average Value Number Average Value Number Average Value Number Average Value Number Average Value
LOANS ORIGINATED 780 $198,127 648 $146,555 713 $202,926 38 $108,062 3 $12,865,207 355 $123,134 4 $100,560 APPLICATIONS APPROVED, NOT ACCEPTED 89 $192,589 114 $142,994 107 $202,009 15 $27,345 0 $0 62 $130,280 1 $72,000 APPLICATIONS DENIED 153 $190,075 231 $130,199 674 $238,504 64 $80,986 2 $930,000 159 $128,680 1 $77,500 APPLICATIONS WITHDRAWN 116 $196,634 96 $149,476 225 $215,655 15 $119,603 0 $0 62 $147,698 0 $0 FILES CLOSED FOR INCOMPLETENESS 42 $205,707 32 $154,915 111 $237,376 9 $135,077 0 $0 22 $171,697 0 $0
Aggregated Statistics For Year 2008(Based on 21 full and 10 partial tracts) A) FHA, FSA/RHS & VA B) Conventional C) Refinancings D) Home Improvement Loans E) Loans on Dwellings For 5+ Families F) Non-occupant Loans on G) Loans On Manufactured Number Average Value Number Average Value Number Average Value Number Average Value Number Average Value Number Average Value Number Average Value
LOANS ORIGINATED 439 $241,181 677 $206,225 698 $233,373 103 $117,837 6 $2,281,333 336 $181,570 6 $53,395 APPLICATIONS APPROVED, NOT ACCEPTED 50 $222,037 162 $213,364 244 $263,067 29 $100,539 0 $0 56 $213,035 20 $59,260 APPLICATIONS DENIED 127 $245,733 313 $220,881 1,249 $298,251 183 $138,243 5 $444,600 232 $237,554 23 $121,626 APPLICATIONS WITHDRAWN 54 $230,616 138 $203,733 308 $290,686 24 $152,945 1 $300,000 83 $205,558 1 $413,000 FILES CLOSED FOR INCOMPLETENESS 21 $230,961 48 $221,133 111 $301,757 14 $165,044 0 $0 31 $260,345 0 $0
Aggregated Statistics For Year 2007(Based on 21 full and 10 partial tracts) A) FHA, FSA/RHS & VA B) Conventional C) Refinancings D) Home Improvement Loans E) Loans on Dwellings For 5+ Families F) Non-occupant Loans on G) Loans On Manufactured Number Average Value Number Average Value Number Average Value Number Average Value Number Average Value Number Average Value Number Average Value
LOANS ORIGINATED 1 $270,570 973 $280,369 2,898 $296,542 483 $195,571 18 $1,093,525 578 $281,906 27 $88,197 APPLICATIONS APPROVED, NOT ACCEPTED 0 $0 298 $284,395 908 $310,432 115 $183,004 0 $0 160 $303,588 18 $78,212 APPLICATIONS DENIED 1 $343,670 804 $296,354 3,180 $338,068 497 $173,188 2 $430,000 483 $307,834 38 $70,509 APPLICATIONS WITHDRAWN 2 $422,500 199 $294,763 1,090 $333,397 133 $225,182 1 $404,000 146 $320,162 2 $216,500 FILES CLOSED FOR INCOMPLETENESS 0 $0 62 $308,350 389 $339,664 34 $223,498 0 $0 46 $269,509 0 $0
Aggregated Statistics For Year 2006(Based on 21 full and 10 partial tracts) A) FHA, FSA/RHS & VA B) Conventional C) Refinancings D) Home Improvement Loans E) Loans on Dwellings For 5+ Families F) Non-occupant Loans on G) Loans On Manufactured Number Average Value Number Average Value Number Average Value Number Average Value Number Average Value Number Average Value Number Average Value
LOANS ORIGINATED 1 $379,000 2,535 $270,934 5,318 $310,708 880 $217,365 21 $1,030,896 913 $290,183 24 $125,816 APPLICATIONS APPROVED, NOT ACCEPTED 0 $0 654 $257,069 1,265 $308,681 186 $218,264 2 $287,500 228 $295,350 23 $66,010 APPLICATIONS DENIED 1 $180,000 1,335 $282,302 3,203 $326,616 582 $196,072 4 $300,500 466 $308,040 29 $105,441 APPLICATIONS WITHDRAWN 1 $276,000 425 $290,827 1,951 $318,327 203 $223,002 1 $390,000 199 $296,901 2 $230,000 FILES CLOSED FOR INCOMPLETENESS 0 $0 160 $291,385 489 $326,987 42 $258,663 0 $0 73 $295,694 1 $264,000
Aggregated Statistics For Year 2005(Based on 21 full and 10 partial tracts) A) FHA, FSA/RHS & VA B) Conventional C) Refinancings D) Home Improvement Loans E) Loans on Dwellings For 5+ Families F) Non-occupant Loans on G) Loans On Manufactured Number Average Value Number Average Value Number Average Value Number Average Value Number Average Value Number Average Value Number Average Value
LOANS ORIGINATED 6 $286,167 4,298 $260,469 6,294 $294,575 848 $221,681 18 $1,304,652 1,335 $264,113 25 $136,286 APPLICATIONS APPROVED, NOT ACCEPTED 0 $0 871 $247,148 1,172 $288,128 139 $174,996 3 $828,333 235 $252,103 35 $75,382 APPLICATIONS DENIED 1 $357,000 1,568 $245,420 2,903 $295,953 600 $172,519 3 $292,030 467 $277,878 37 $124,223 APPLICATIONS WITHDRAWN 0 $0 702 $269,827 2,203 $281,816 272 $226,891 3 $295,183 271 $264,652 12 $191,278 FILES CLOSED FOR INCOMPLETENESS 0 $0 207 $287,128 627 $302,192 47 $210,728 2 $788,000 51 $277,740 1 $257,000
Aggregated Statistics For Year 2004(Based on 21 full and 10 partial tracts) A) FHA, FSA/RHS & VA B) Conventional C) Refinancings D) Home Improvement Loans E) Loans on Dwellings For 5+ Families F) Non-occupant Loans on G) Loans On Manufactured Number Average Value Number Average Value Number Average Value Number Average Value Number Average Value Number Average Value Number Average Value
LOANS ORIGINATED 13 $241,859 3,458 $231,945 6,218 $240,352 717 $177,261 28 $1,273,296 1,153 $225,927 26 $101,884 APPLICATIONS APPROVED, NOT ACCEPTED 2 $137,500 613 $227,330 1,246 $241,189 96 $126,797 4 $490,022 181 $221,744 15 $88,572 APPLICATIONS DENIED 4 $226,868 1,130 $225,710 2,731 $244,583 458 $117,497 3 $322,333 354 $224,445 35 $97,013 APPLICATIONS WITHDRAWN 5 $241,564 576 $240,201 2,288 $237,580 174 $149,425 7 $421,749 202 $239,266 4 $123,750 FILES CLOSED FOR INCOMPLETENESS 0 $0 143 $255,165 636 $255,790 44 $143,398 1 $438,000 63 $248,910 1 $256,000
Aggregated Statistics For Year 2003(Based on 21 full and 10 partial tracts) A) FHA, FSA/RHS & VA B) Conventional C) Refinancings D) Home Improvement Loans E) Loans on Dwellings For 5+ Families F) Non-occupant Loans on Number Average Value Number Average Value Number Average Value Number Average Value Number Average Value Number Average Value
LOANS ORIGINATED 70 $220,169 2,721 $209,283 9,887 $197,597 360 $61,985 20 $759,858 1,318 $184,836 APPLICATIONS APPROVED, NOT ACCEPTED 11 $126,789 475 $216,730 1,651 $201,714 76 $73,682 4 $1,338,500 220 $189,795 APPLICATIONS DENIED 9 $211,747 739 $195,343 3,023 $203,718 366 $46,903 1 $450,030 322 $187,273 APPLICATIONS WITHDRAWN 11 $185,776 485 $210,232 2,902 $198,963 87 $60,642 4 $1,024,658 189 $202,718 FILES CLOSED FOR INCOMPLETENESS 1 $141,690 125 $234,301 415 $212,572 29 $56,266 0 $0 79 $202,194
Aggregated Statistics For Year 2002(Based on 20 full and 7 partial tracts) A) FHA, FSA/RHS & VA B) Conventional C) Refinancings D) Home Improvement Loans E) Loans on Dwellings For 5+ Families F) Non-occupant Loans on Number Average Value Number Average Value Number Average Value Number Average Value Number Average Value Number Average Value
LOANS ORIGINATED 173 $201,409 2,219 $196,014 6,162 $179,279 278 $54,356 26 $4,574,472 903 $162,811 APPLICATIONS APPROVED, NOT ACCEPTED 18 $128,499 350 $214,239 1,136 $186,004 78 $55,067 1 $310,000 103 $167,370 APPLICATIONS DENIED 27 $193,466 548 $185,378 1,856 $173,583 280 $36,214 7 $568,514 210 $171,330 APPLICATIONS WITHDRAWN 20 $194,597 322 $188,217 1,885 $182,546 79 $56,981 2 $367,000 116 $161,575 FILES CLOSED FOR INCOMPLETENESS 6 $194,943 143 $204,169 400 $186,457 4 $34,262 1 $5,000,000 46 $175,156
Aggregated Statistics For Year 2001(Based on 20 full and 7 partial tracts) A) FHA, FSA/RHS & VA B) Conventional C) Refinancings D) Home Improvement Loans E) Loans on Dwellings For 5+ Families F) Non-occupant Loans on Number Average Value Number Average Value Number Average Value Number Average Value Number Average Value Number Average Value
LOANS ORIGINATED 242 $174,427 1,848 $176,056 5,271 $163,703 287 $41,195 17 $1,458,116 753 $148,528 APPLICATIONS APPROVED, NOT ACCEPTED 14 $172,259 277 $175,128 822 $164,191 60 $41,993 1 $1,024,000 95 $138,765 APPLICATIONS DENIED 26 $170,784 464 $162,643 1,952 $155,398 258 $33,722 4 $932,955 187 $142,274 APPLICATIONS WITHDRAWN 18 $177,940 309 $181,748 1,561 $158,157 101 $50,932 3 $265,667 114 $150,314 FILES CLOSED FOR INCOMPLETENESS 7 $183,187 73 $195,591 372 $171,426 16 $57,802 0 $0 38 $155,888
Aggregated Statistics For Year 2000(Based on 20 full and 7 partial tracts) A) FHA, FSA/RHS & VA B) Conventional C) Refinancings D) Home Improvement Loans E) Loans on Dwellings For 5+ Families F) Non-occupant Loans on Number Average Value Number Average Value Number Average Value Number Average Value Number Average Value Number Average Value
LOANS ORIGINATED 414 $145,107 2,037 $145,211 1,525 $120,547 293 $33,138 26 $384,782 471 $117,521 APPLICATIONS APPROVED, NOT ACCEPTED 57 $130,054 327 $145,825 345 $119,193 123 $32,672 0 $0 80 $108,512 APPLICATIONS DENIED 65 $144,504 690 $132,373 1,192 $110,694 315 $38,613 9 $267,222 177 $111,811 APPLICATIONS WITHDRAWN 34 $134,687 385 $147,732 706 $113,699 56 $40,278 6 $357,167 70 $110,443 FILES CLOSED FOR INCOMPLETENESS 10 $138,940 118 $153,170 294 $130,880 12 $30,727 2 $2,706,500 42 $128,542
Aggregated Statistics For Year 1999(Based on 20 full and 8 partial tracts) A) FHA, FSA/RHS & VA B) Conventional C) Refinancings D) Home Improvement Loans E) Loans on Dwellings For 5+ Families F) Non-occupant Loans on Number Average Value Number Average Value Number Average Value Number Average Value Number Average Value Number Average Value
LOANS ORIGINATED 690 $130,047 1,477 $143,398 1,844 $111,293 256 $28,068 29 $525,670 440 $88,884 APPLICATIONS APPROVED, NOT ACCEPTED 67 $109,709 191 $128,920 447 $110,520 134 $25,193 5 $154,560 70 $100,814 APPLICATIONS DENIED 94 $122,146 492 $113,118 1,288 $100,099 314 $23,835 8 $608,375 166 $92,658 APPLICATIONS WITHDRAWN 59 $118,973 362 $135,408 982 $113,984 31 $35,858 8 $129,068 118 $116,818 FILES CLOSED FOR INCOMPLETENESS 12 $122,210 88 $124,919 301 $124,831 11 $32,202 3 $3,132,803 33 $93,664
Detailed mortgage data for all 31 tracts in Vallejo, CA
Private Mortgage Insurance Companies Aggregated Statistics For Year 2009(Based on 19 full and 10 partial tracts) A) Conventional B) Refinancings C) Non-occupant Loans on Number Average Value Number Average Value Number Average Value
LOANS ORIGINATED 81 $201,085 7 $253,800 0 $0 APPLICATIONS APPROVED, NOT ACCEPTED 50 $210,033 6 $283,383 2 $160,000 APPLICATIONS DENIED 15 $181,015 4 $352,368 0 $0 APPLICATIONS WITHDRAWN 17 $226,588 4 $236,642 0 $0 FILES CLOSED FOR INCOMPLETENESS 3 $352,810 0 $0 0 $0
Aggregated Statistics For Year 2008(Based on 21 full and 10 partial tracts) A) Conventional B) Refinancings C) Non-occupant Loans on Number Average Value Number Average Value Number Average Value
LOANS ORIGINATED 227 $255,360 52 $342,485 16 $214,775 APPLICATIONS APPROVED, NOT ACCEPTED 97 $296,989 105 $360,014 12 $283,637 APPLICATIONS DENIED 31 $219,608 15 $346,641 8 $183,926 APPLICATIONS WITHDRAWN 21 $294,599 8 $341,072 4 $284,632 FILES CLOSED FOR INCOMPLETENESS 6 $416,498 5 $427,400 4 $475,748
Aggregated Statistics For Year 2007(Based on 21 full and 10 partial tracts) A) Conventional B) Refinancings C) Non-occupant Loans on Number Average Value Number Average Value Number Average Value
LOANS ORIGINATED 141 $356,241 143 $405,546 17 $313,602 APPLICATIONS APPROVED, NOT ACCEPTED 19 $388,039 56 $407,902 5 $329,782 APPLICATIONS DENIED 7 $421,540 20 $456,174 3 $503,817 APPLICATIONS WITHDRAWN 4 $284,695 20 $395,690 1 $574,600 FILES CLOSED FOR INCOMPLETENESS 0 $0 2 $439,090 0 $0
Aggregated Statistics For Year 2006(Based on 21 full and 10 partial tracts) A) Conventional B) Refinancings C) Non-occupant Loans on Number Average Value Number Average Value Number Average Value
LOANS ORIGINATED 30 $393,915 70 $397,915 3 $313,667 APPLICATIONS APPROVED, NOT ACCEPTED 4 $394,588 23 $410,273 2 $344,000 APPLICATIONS DENIED 0 $0 4 $425,375 1 $522,000 APPLICATIONS WITHDRAWN 2 $400,500 6 $313,403 0 $0 FILES CLOSED FOR INCOMPLETENESS 0 $0 2 $303,500 0 $0
Aggregated Statistics For Year 2005(Based on 20 full and 10 partial tracts) A) Conventional B) Refinancings C) Non-occupant Loans on D) Loans On Manufactured Number Average Value Number Average Value Number Average Value Number Average Value
LOANS ORIGINATED 50 $305,815 76 $364,020 13 $209,000 1 $216,000 APPLICATIONS APPROVED, NOT ACCEPTED 16 $324,526 16 $352,502 2 $180,500 0 $0 APPLICATIONS DENIED 0 $0 5 $346,266 1 $234,540 0 $0 APPLICATIONS WITHDRAWN 1 $425,390 4 $356,585 1 $424,410 0 $0 FILES CLOSED FOR INCOMPLETENESS 1 $257,000 1 $161,000 0 $0 0 $0
Aggregated Statistics For Year 2004(Based on 20 full and 9 partial tracts) A) Conventional B) Refinancings C) Non-occupant Loans on Number Average Value Number Average Value Number Average Value
LOANS ORIGINATED 86 $296,019 103 $287,603 15 $224,665 APPLICATIONS APPROVED, NOT ACCEPTED 21 $283,920 40 $273,825 9 $219,491 APPLICATIONS DENIED 5 $280,794 2 $252,500 1 $171,000 APPLICATIONS WITHDRAWN 4 $291,500 5 $237,836 1 $216,000 FILES CLOSED FOR INCOMPLETENESS 1 $250,000 0 $0 0 $0
Aggregated Statistics For Year 2003(Based on 21 full and 9 partial tracts) A) Conventional B) Refinancings C) Non-occupant Loans on Number Average Value Number Average Value Number Average Value
LOANS ORIGINATED 267 $254,667 219 $248,390 35 $232,984 APPLICATIONS APPROVED, NOT ACCEPTED 48 $262,381 92 $255,784 8 $211,704 APPLICATIONS DENIED 4 $197,468 15 $285,994 1 $221,000 APPLICATIONS WITHDRAWN 6 $204,680 13 $317,129 4 $219,750 FILES CLOSED FOR INCOMPLETENESS 0 $0 0 $0 0 $0
Aggregated Statistics For Year 2002(Based on 20 full and 7 partial tracts) A) Conventional B) Refinancings C) Non-occupant Loans on Number Average Value Number Average Value Number Average Value
LOANS ORIGINATED 329 $212,831 205 $226,952 22 $189,784 APPLICATIONS APPROVED, NOT ACCEPTED 75 $191,382 106 $221,855 4 $169,800 APPLICATIONS DENIED 12 $191,620 10 $247,115 1 $181,000 APPLICATIONS WITHDRAWN 15 $201,479 16 $205,238 7 $133,357 FILES CLOSED FOR INCOMPLETENESS 0 $0 4 $165,500 1 $101,000
Aggregated Statistics For Year 2001(Based on 20 full and 6 partial tracts) A) Conventional B) Refinancings C) Non-occupant Loans on Number Average Value Number Average Value Number Average Value
LOANS ORIGINATED 417 $204,648 232 $199,395 34 $163,567 APPLICATIONS APPROVED, NOT ACCEPTED 102 $194,996 77 $200,712 11 $152,582 APPLICATIONS DENIED 8 $202,711 16 $183,661 3 $193,667 APPLICATIONS WITHDRAWN 2 $200,630 7 $163,237 0 $0 FILES CLOSED FOR INCOMPLETENESS 6 $177,000 3 $220,087 0 $0
Aggregated Statistics For Year 2000(Based on 20 full and 6 partial tracts) A) Conventional B) Refinancings C) Non-occupant Loans on Number Average Value Number Average Value Number Average Value
LOANS ORIGINATED 471 $162,348 148 $156,193 56 $112,729 APPLICATIONS APPROVED, NOT ACCEPTED 82 $160,007 32 $146,582 13 $117,852 APPLICATIONS DENIED 29 $172,352 10 $158,661 5 $144,888 APPLICATIONS WITHDRAWN 13 $175,132 3 $199,690 1 $99,000 FILES CLOSED FOR INCOMPLETENESS 1 $113,000 2 $137,135 1 $113,000
Aggregated Statistics For Year 1999(Based on 20 full and 7 partial tracts) A) Conventional B) Refinancings C) Non-occupant Loans on Number Average Value Number Average Value Number Average Value
LOANS ORIGINATED 378 $156,687 206 $148,607 36 $111,334 APPLICATIONS APPROVED, NOT ACCEPTED 34 $164,607 44 $149,591 7 $89,423 APPLICATIONS DENIED 23 $136,479 19 $141,797 7 $101,894 APPLICATIONS WITHDRAWN 13 $136,738 7 $137,103 3 $88,793 FILES CLOSED FOR INCOMPLETENESS 7 $154,401 6 $131,712 0 $0
Fire-safe hotels and motels in Vallejo, California:
Regency Inn, 4326 Sonoma Blvd, Vallejo, California 94589 Phone: (707) 643-4150
Americas Best Value Inn - Vallejo / Napa Valley, 300 Fairgrounds Dr, Vallejo, California 94590 Phone: (707) 554-8000
Courtyard By Marriott, 1000 Fairgrounds Dr, Vallejo, California 94589 Phone: (707) 644-1200, Fax: (707) 644-1200
Super 8 Vallejo/Napa Valley, 2070 Solano Ave, Vallejo, California 94590 Phone: (707) 556-5000, Fax: (707) 556-5001
All 4 fire-safe hotels and motels in Vallejo, California
Most common first names in Vallejo, CA among deceased individuals Name Count Lived (average)
John 621 73.5 years Mary 542 78.9 years William 511 73.3 years James 441 71.1 years Robert 420 70.9 years Charles 323 73.4 years George 299 75.8 years Joseph 285 74.7 years Frank 241 75.4 years Margaret 206 78.2 years
Most common last names in Vallejo, CA among deceased individuals Last name Count Lived (average)
Smith 295 74.8 years Johnson 256 75.1 years Williams 211 73.0 years Jones 177 72.3 years Brown 167 73.5 years Davis 140 71.2 years Jackson 109 70.3 years Thomas 99 71.5 years Miller 98 73.0 years Wilson 98 73.2 years
Vallejo compared to California state average:
Unemployed percentage below state average. Black race population percentage significantly above state average. Median age above state average. Vallejo, CA compared to other similar cities:
#2 on the list of "Top 101 cities with the largest city-data.com crime index per police officer (population 50,000+)"
#8 on the list of "Top 100 most racially diverse cities (pop. 50,000+)"
#8 on the list of "Top 101 cities with the lowest number of police officers per 1000 residents (population 50,000+)"
#8 on the list of "Top 101 cities with the most local government spending on current operations of parks and recreation per resident (population 10,000+)"
#8 on the list of "Top 101 cities with the highest number of auto thefts per 100,000 residents, excludes tourist destinations and others with a lot of outsiders visiting based on city industries data (population 50,000+)"
#9 on the list of "Top 101 cities with largest percentage of females in occupations: health technologists and technicians (population 50,000+)"
#13 on the list of "Top 101 cities with the highest number of burglaries per 100,000 residents, excludes tourist destinations and others with a lot of outsiders visiting based on city industries data (population 50,000+)"
#25 on the list of "Top 101 cities with the most residents born in Born at sea (population 500+)"
#28 on the list of "Top 101 cities with largest percentage of males in occupations: health technologists and technicians (population 50,000+)"
#28 on the list of "Top 101 cities with the highest maximum monthly sunshine amount (population 50,000+)"
#37 on the list of "Top 101 cities with largest percentage of males in occupations: healthcare support occupations (population 50,000+)"
#42 on the list of "Top 101 cities with the highest average snowfall in a year (population 50,000+)"
#42 on the list of "Top 101 cities with the highest number of arson incidents per 100,000 residents, excludes tourist destinations and others with a lot of outsiders visiting based on city industries data (population 50,000+)"
#44 on the list of "Top 101 cities with the largest sunshine amount differences during a year (population 50,000+)"
#46 on the list of "Top 101 cities with the largest percentage of likely homosexual households (counted as self-reported same-sex unmarried-partner households) (population 50,000+)"
#46 on the list of "Top 101 cities with the most residents born in Philippines (population 500+)"
#53 on the list of "Top 101 cities with the highest city-data.com crime index, excludes tourist destinations and others with a lot of outsiders visiting based on city industries data (population 50,000+)"
#53 on the list of "Top 100 least-safe cities (highest city-data.com crime index) (pop. 50,000+)"
#54 on the list of "Top 101 cities with the largest differences between morning and afternoon humidity (population 50,000+)"
#54 on the list of "Top 101 cities with the largest humidity differences during a year (population 50,000+)"
#1 on the list of "Top 101 counties with the largest increase in the number of infant deaths per 1000 residents 2000-2006 to 2007-2013 (pop. 50,000+)"
#21 on the list of "Top 101 counties with the highest Nitrogen Dioxide air pollution readings in 2012 (ppm)"
#31 on the list of "Top 101 counties with the lowest Particulate Matter (PM10 ) Annual air pollution readings in 2012 (µg/m3 )"
#36 on the list of "Top 101 counties with the highest carbon monoxide air pollution readings in 2012 (ppm)"
#78 on the list of "Top 101 counties with the highest percentage of residents relocating to foreign countries in 2011 (pop. 50,000+)"
Top Patent Applicants
Joel Gamoras (18)
Crystine Lee (10)
James Tsai (10)
Candice Hellen Brown Elliott (8)
Eleni Bachlava (7)
Robert Iovanni (7)
Peter D. Gray (6)
Ying Lian (6)
Trung T. Doan (5)
Cedrick Mahieux (4)
Total of 271 patent applications in 2008-2024.


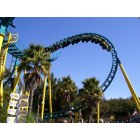


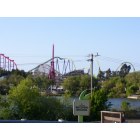


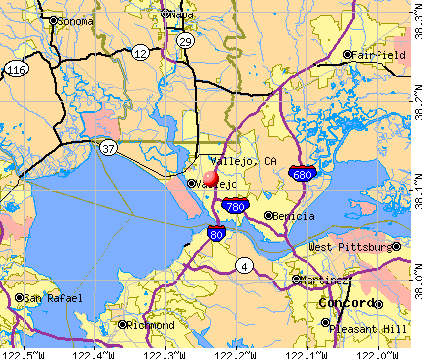


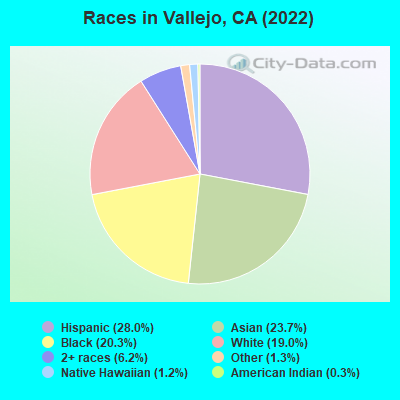
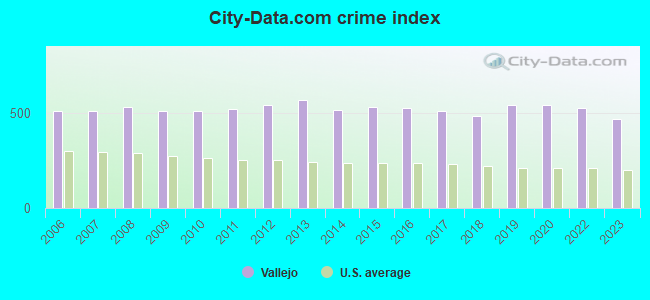
 Recent articles from our blog. Our writers, many of them Ph.D. graduates or candidates, create easy-to-read articles on a wide variety of topics.


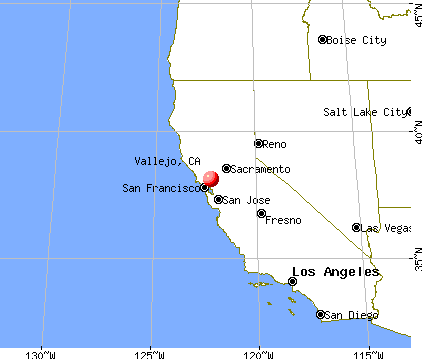
 , pop. 236,008).
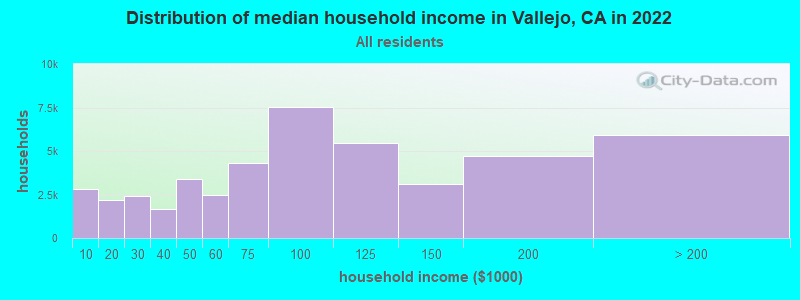
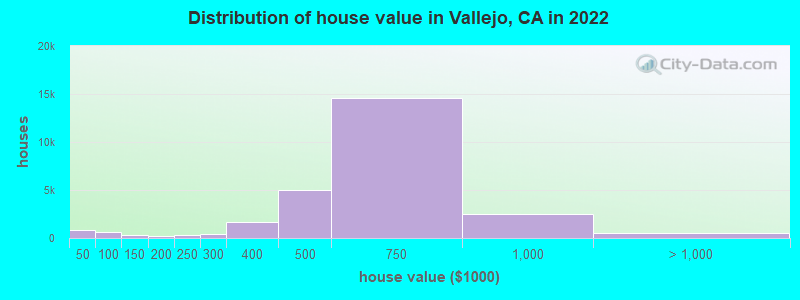

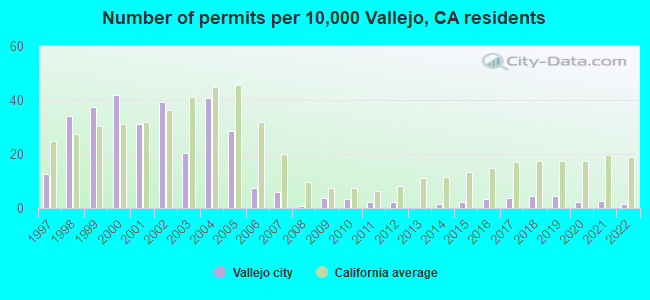
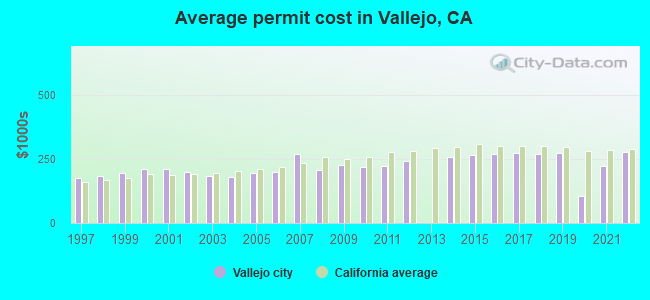

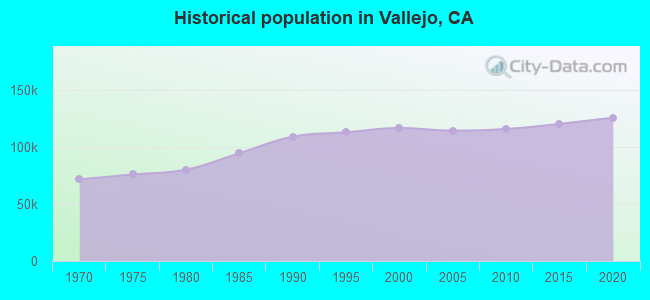
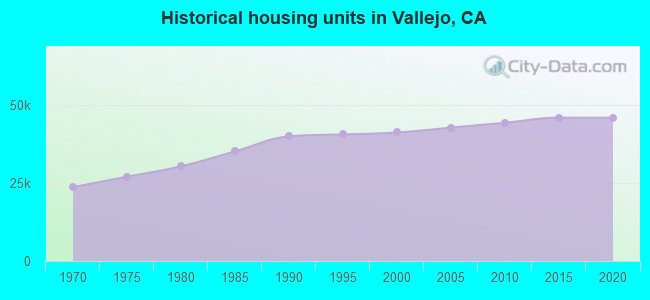
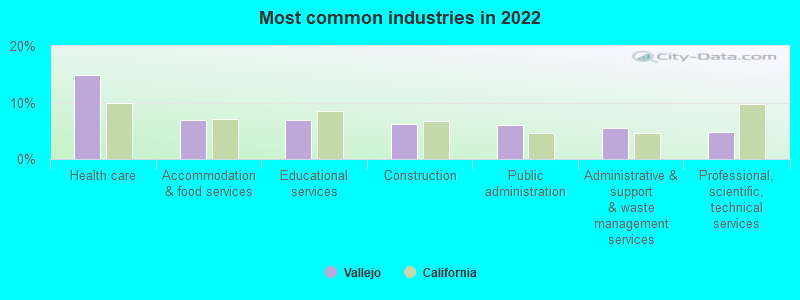
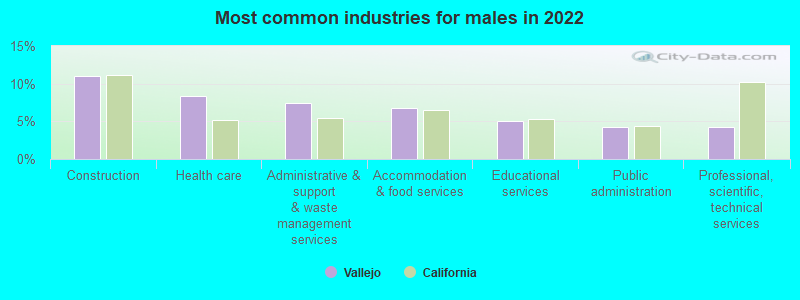
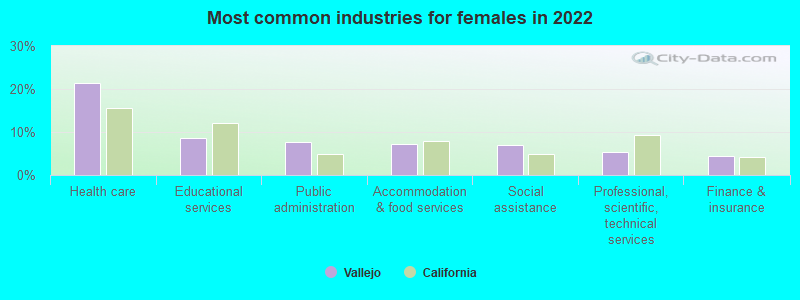
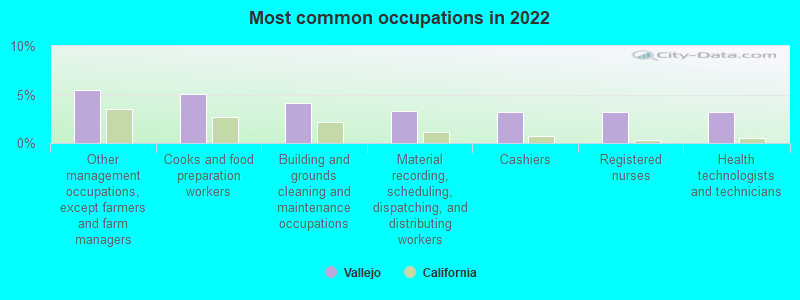
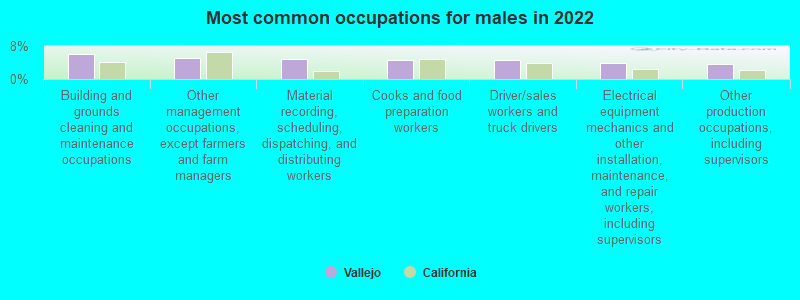
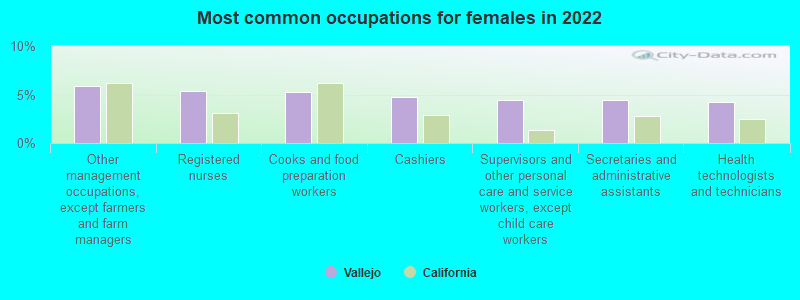

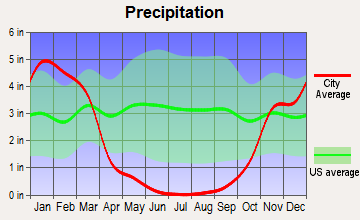
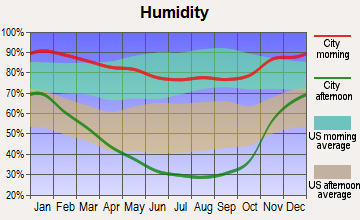

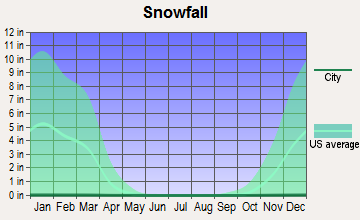
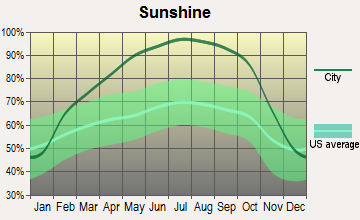
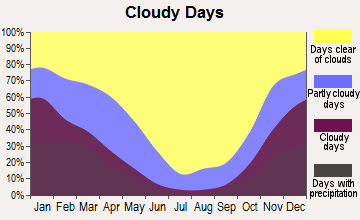
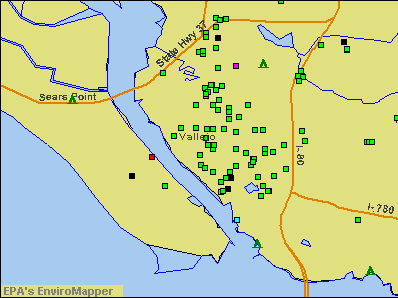

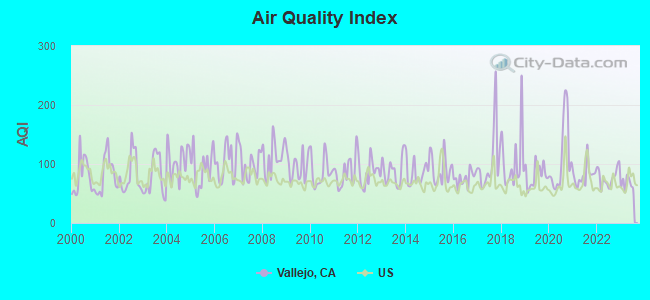
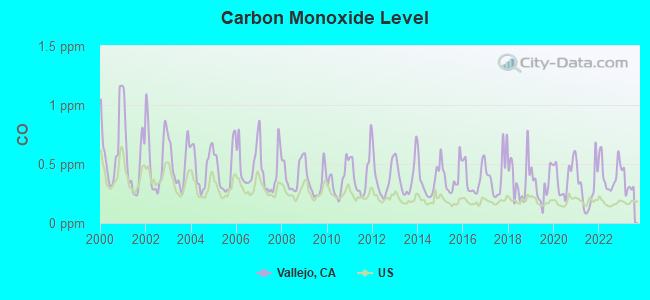
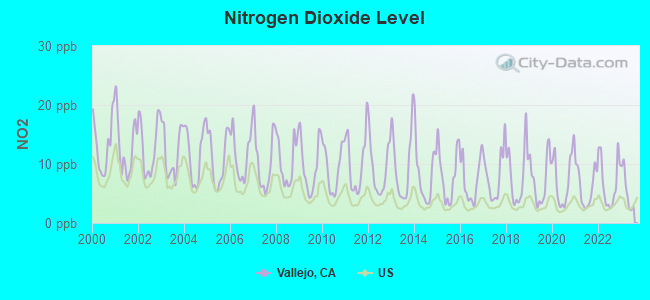
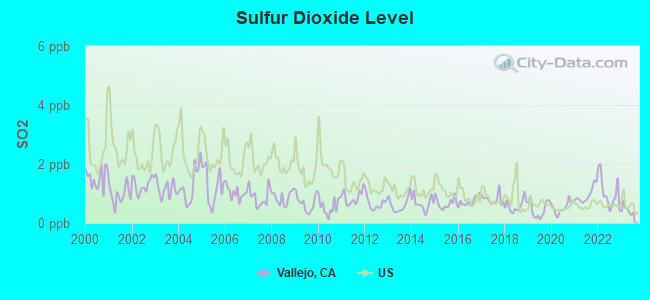
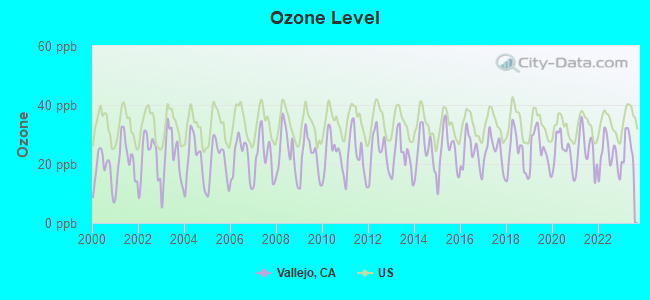
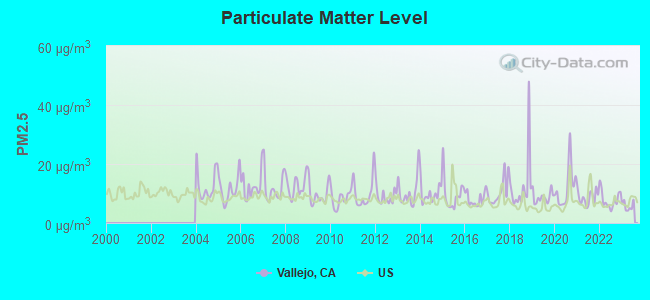
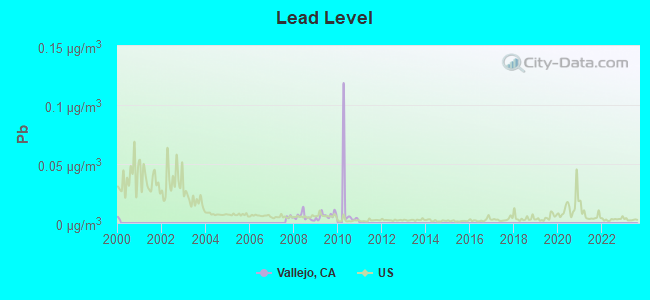

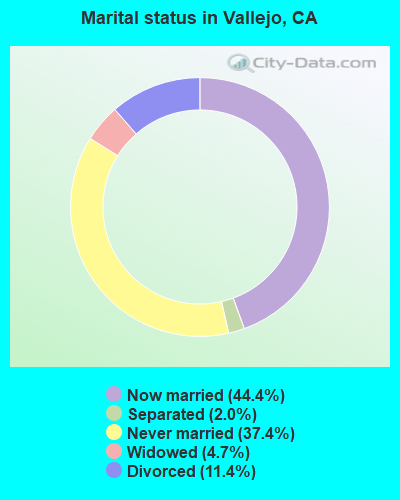
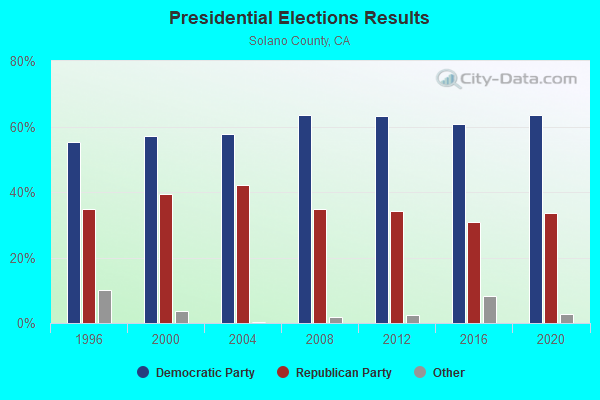
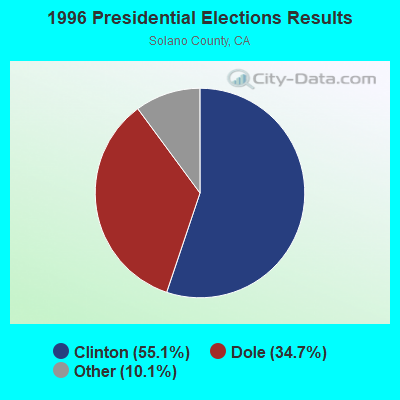
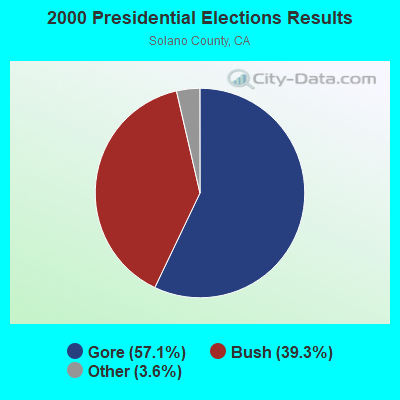
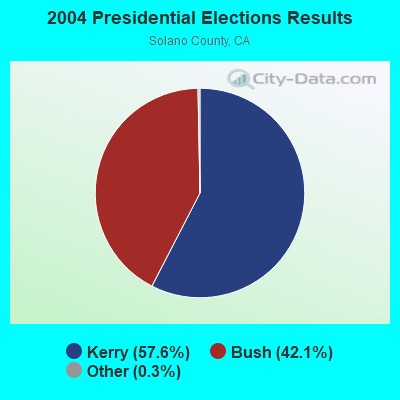
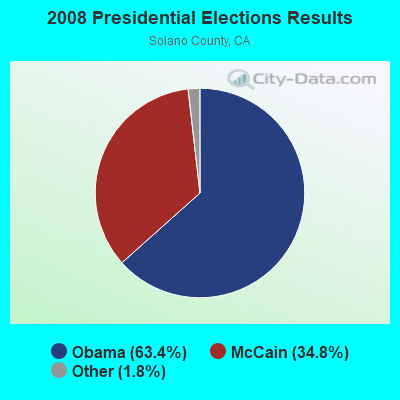
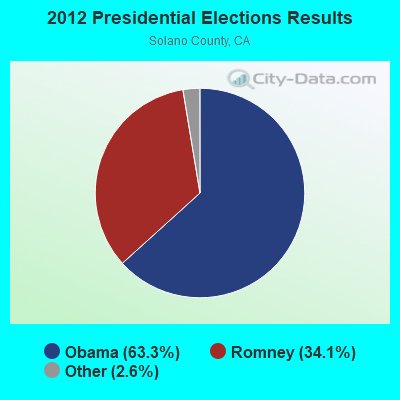
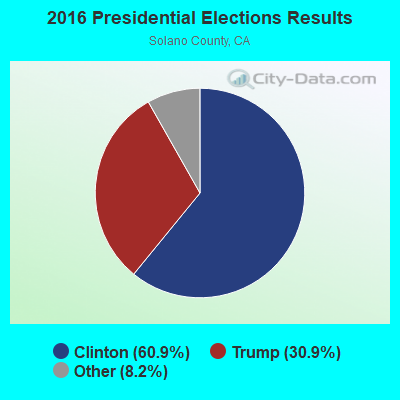
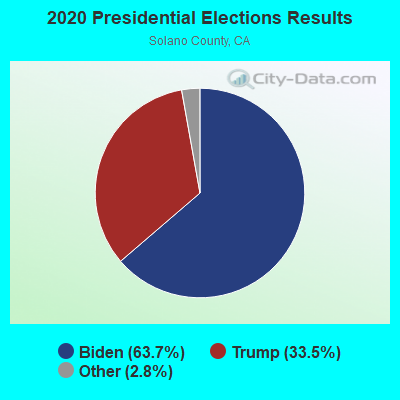
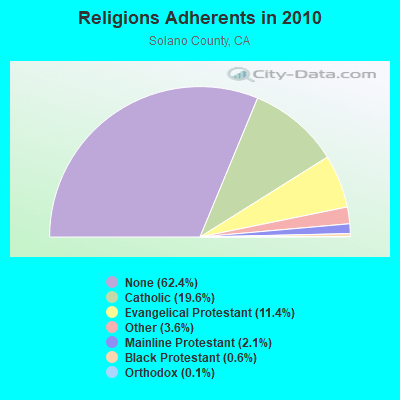
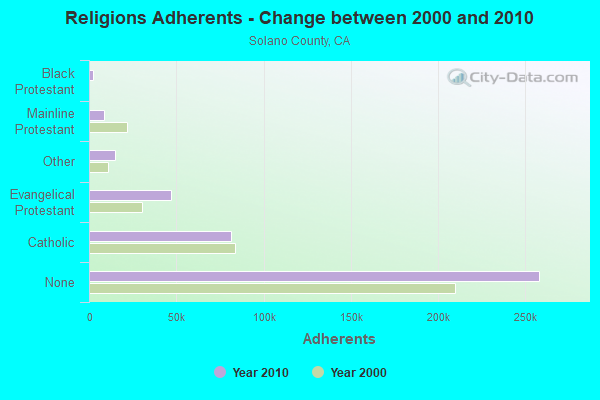
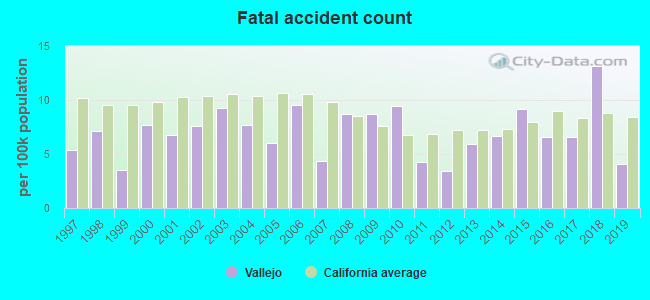
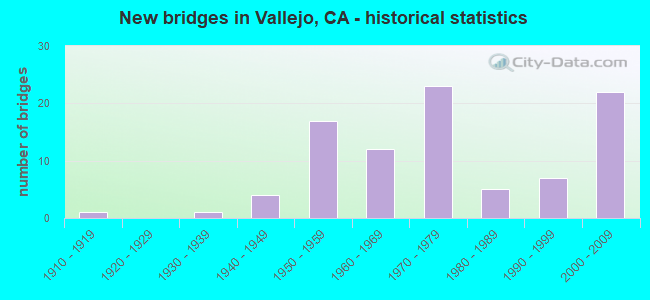
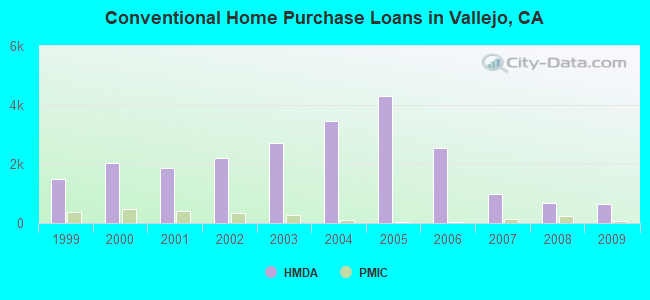
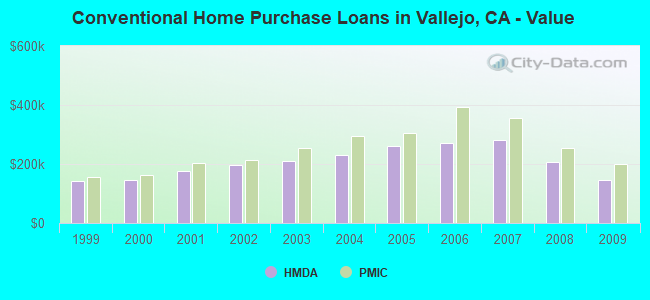
 According to the data from the years 2005 - 2018 the average number of fires per year is 101. The highest number of reported fire incidents - 555 took place in 2017, and the least - 10 in 2016. The data has a growing trend.
 When looking into fire subcategories, the most incidents belonged to: Outside Fires (41.7%), and Structure Fires (37.3%).