Washington, Utah Submit your own pictures of this city and show them to the world
OSM Map
General Map
Google Map
MSN Map
OSM Map
General Map
Google Map
MSN Map
OSM Map
General Map
Google Map
MSN Map
OSM Map
General Map
Google Map
MSN Map
Please wait while loading the map...
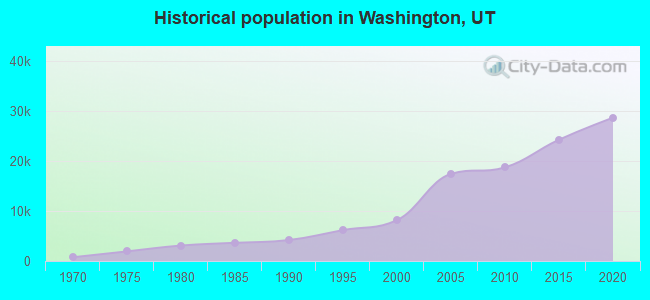
Population in 2022: 32,709 (91% urban, 9% rural). Population change since 2000: +299.6%Males: 15,929 Females: 16,780
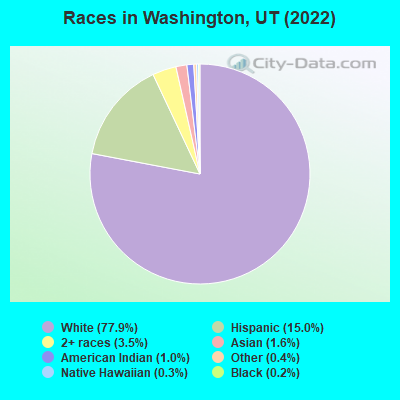
March 2022 cost of living index in Washington: 90.3 (less than average, U.S. average is 100) Percentage of residents living in poverty in 2022: 4.1%for White Non-Hispanic residents , 2.6% for Hispanic or Latino residents , 68.0% for American Indian residents , 1.8% for two or more races residents )
Profiles of local businesses
Business Search - 14 Million verified businesses
Data:
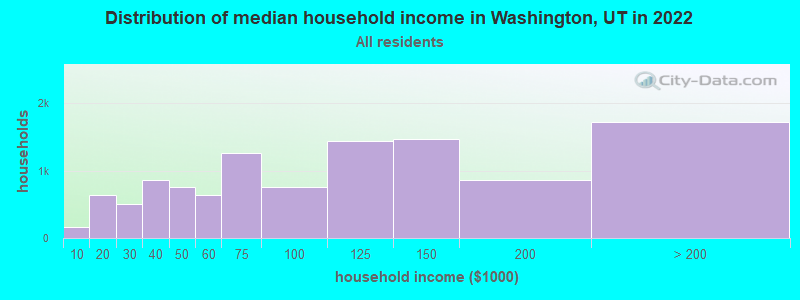
Median household income ($)
Median household income (% change since 2000)
Household income diversity
Ratio of average income to average house value (%)
Ratio of average income to average rent
Median household income ($) - White
Median household income ($) - Black or African American
Median household income ($) - Asian
Median household income ($) - Hispanic or Latino
Median household income ($) - American Indian and Alaska Native
Median household income ($) - Multirace
Median household income ($) - Other Race
Median household income for houses/condos with a mortgage ($)
Median household income for apartments without a mortgage ($)
Races - White alone (%)
Races - White alone (% change since 2000)
Races - Black alone (%)
Races - Black alone (% change since 2000)
Races - American Indian alone (%)
Races - American Indian alone (% change since 2000)
Races - Asian alone (%)
Races - Asian alone (% change since 2000)
Races - Hispanic (%)
Races - Hispanic (% change since 2000)
Races - Native Hawaiian and Other Pacific Islander alone (%)
Races - Native Hawaiian and Other Pacific Islander alone (% change since 2000)
Races - Two or more races (%)
Races - Two or more races (% change since 2000)
Races - Other race alone (%)
Races - Other race alone (% change since 2000)
Racial diversity
Unemployment (%)
Unemployment (% change since 2000)
Unemployment (%) - White
Unemployment (%) - Black or African American
Unemployment (%) - Asian
Unemployment (%) - Hispanic or Latino
Unemployment (%) - American Indian and Alaska Native
Unemployment (%) - Multirace
Unemployment (%) - Other Race
Population density (people per square mile)
Population - Males (%)
Population - Females (%)
Population - Males (%) - White
Population - Males (%) - Black or African American
Population - Males (%) - Asian
Population - Males (%) - Hispanic or Latino
Population - Males (%) - American Indian and Alaska Native
Population - Males (%) - Multirace
Population - Males (%) - Other Race
Population - Females (%) - White
Population - Females (%) - Black or African American
Population - Females (%) - Asian
Population - Females (%) - Hispanic or Latino
Population - Females (%) - American Indian and Alaska Native
Population - Females (%) - Multirace
Population - Females (%) - Other Race
Coronavirus confirmed cases (Apr 24, 2024)
Deaths caused by coronavirus (Apr 24, 2024)
Coronavirus confirmed cases (per 100k population) (Apr 24, 2024)
Deaths caused by coronavirus (per 100k population) (Apr 24, 2024)
Daily increase in number of cases (Apr 24, 2024)
Weekly increase in number of cases (Apr 24, 2024)
Cases doubled (in days) (Apr 24, 2024)
Hospitalized patients (Apr 18, 2022)
Negative test results (Apr 18, 2022)
Total test results (Apr 18, 2022)
COVID Vaccine doses distributed (per 100k population) (Sep 19, 2023)
COVID Vaccine doses administered (per 100k population) (Sep 19, 2023)
COVID Vaccine doses distributed (Sep 19, 2023)
COVID Vaccine doses administered (Sep 19, 2023)
Likely homosexual households (%)
Likely homosexual households (% change since 2000)
Likely homosexual households - Lesbian couples (%)
Likely homosexual households - Lesbian couples (% change since 2000)
Likely homosexual households - Gay men (%)
Likely homosexual households - Gay men (% change since 2000)
Cost of living index
Median gross rent ($)
Median contract rent ($)
Median monthly housing costs ($)
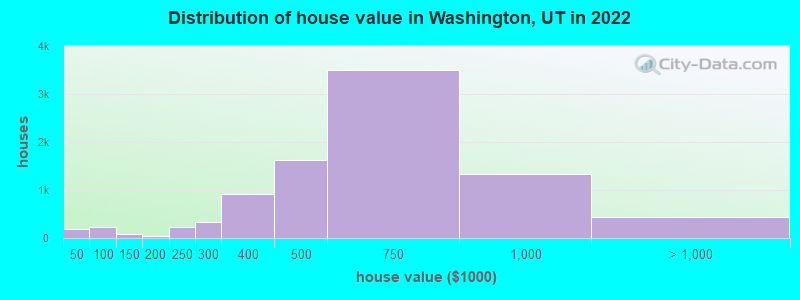
Median house or condo value ($)
Median house or condo value ($ change since 2000)
Mean house or condo value by units in structure - 1, detached ($)
Mean house or condo value by units in structure - 1, attached ($)
Mean house or condo value by units in structure - 2 ($)
Mean house or condo value by units in structure by units in structure - 3 or 4 ($)
Mean house or condo value by units in structure - 5 or more ($)
Mean house or condo value by units in structure - Boat, RV, van, etc. ($)
Mean house or condo value by units in structure - Mobile home ($)
Median house or condo value ($) - White
Median house or condo value ($) - Black or African American
Median house or condo value ($) - Asian
Median house or condo value ($) - Hispanic or Latino
Median house or condo value ($) - American Indian and Alaska Native
Median house or condo value ($) - Multirace
Median house or condo value ($) - Other Race
Median resident age
Resident age diversity
Median resident age - Males
Median resident age - Females
Median resident age - White
Median resident age - Black or African American
Median resident age - Asian
Median resident age - Hispanic or Latino
Median resident age - American Indian and Alaska Native
Median resident age - Multirace
Median resident age - Other Race
Median resident age - Males - White
Median resident age - Males - Black or African American
Median resident age - Males - Asian
Median resident age - Males - Hispanic or Latino
Median resident age - Males - American Indian and Alaska Native
Median resident age - Males - Multirace
Median resident age - Males - Other Race
Median resident age - Females - White
Median resident age - Females - Black or African American
Median resident age - Females - Asian
Median resident age - Females - Hispanic or Latino
Median resident age - Females - American Indian and Alaska Native
Median resident age - Females - Multirace
Median resident age - Females - Other Race
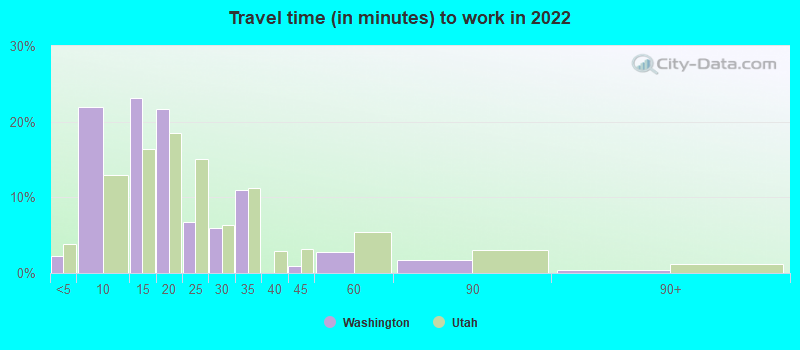
Commute - mean travel time to work (minutes)
Travel time to work - Less than 5 minutes (%)
Travel time to work - Less than 5 minutes (% change since 2000)
Travel time to work - 5 to 9 minutes (%)
Travel time to work - 5 to 9 minutes (% change since 2000)
Travel time to work - 10 to 19 minutes (%)
Travel time to work - 10 to 19 minutes (% change since 2000)
Travel time to work - 20 to 29 minutes (%)
Travel time to work - 20 to 29 minutes (% change since 2000)
Travel time to work - 30 to 39 minutes (%)
Travel time to work - 30 to 39 minutes (% change since 2000)
Travel time to work - 40 to 59 minutes (%)
Travel time to work - 40 to 59 minutes (% change since 2000)
Travel time to work - 60 to 89 minutes (%)
Travel time to work - 60 to 89 minutes (% change since 2000)
Travel time to work - 90 or more minutes (%)
Travel time to work - 90 or more minutes (% change since 2000)
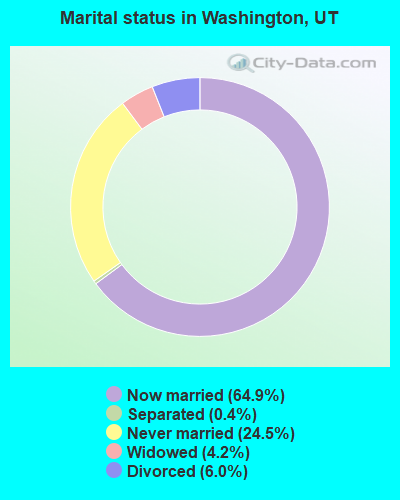
Marital status - Never married (%)
Marital status - Now married (%)
Marital status - Separated (%)
Marital status - Widowed (%)
Marital status - Divorced (%)
Median family income ($)
Median family income (% change since 2000)
Median non-family income ($)
Median non-family income (% change since 2000)
Median per capita income ($)
Median per capita income (% change since 2000)
Median family income ($) - White
Median family income ($) - Black or African American
Median family income ($) - Asian
Median family income ($) - Hispanic or Latino
Median family income ($) - American Indian and Alaska Native
Median family income ($) - Multirace
Median family income ($) - Other Race
Median year house/condo built
Median year apartment built
Year house built - Built 2005 or later (%)
Year house built - Built 2000 to 2004 (%)
Year house built - Built 1990 to 1999 (%)
Year house built - Built 1980 to 1989 (%)
Year house built - Built 1970 to 1979 (%)
Year house built - Built 1960 to 1969 (%)
Year house built - Built 1950 to 1959 (%)
Year house built - Built 1940 to 1949 (%)
Year house built - Built 1939 or earlier (%)
Average household size
Household density (households per square mile)
Average household size - White
Average household size - Black or African American
Average household size - Asian
Average household size - Hispanic or Latino
Average household size - American Indian and Alaska Native
Average household size - Multirace
Average household size - Other Race
Occupied housing units (%)
Vacant housing units (%)
Owner occupied housing units (%)
Renter occupied housing units (%)
Vacancy status - For rent (%)
Vacancy status - For sale only (%)
Vacancy status - Rented or sold, not occupied (%)
Vacancy status - For seasonal, recreational, or occasional use (%)
Vacancy status - For migrant workers (%)
Vacancy status - Other vacant (%)
Residents with income below the poverty level (%)
Residents with income below 50% of the poverty level (%)
Children below poverty level (%)
Poor families by family type - Married-couple family (%)
Poor families by family type - Male, no wife present (%)
Poor families by family type - Female, no husband present (%)
Poverty status for native-born residents (%)
Poverty status for foreign-born residents (%)
Poverty among high school graduates not in families (%)
Poverty among people who did not graduate high school not in families (%)
Residents with income below the poverty level (%) - White
Residents with income below the poverty level (%) - Black or African American
Residents with income below the poverty level (%) - Asian
Residents with income below the poverty level (%) - Hispanic or Latino
Residents with income below the poverty level (%) - American Indian and Alaska Native
Residents with income below the poverty level (%) - Multirace
Residents with income below the poverty level (%) - Other Race
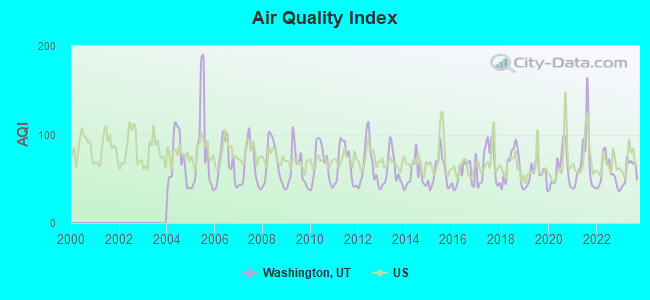
Air pollution - Air Quality Index (AQI)
Air pollution - CO
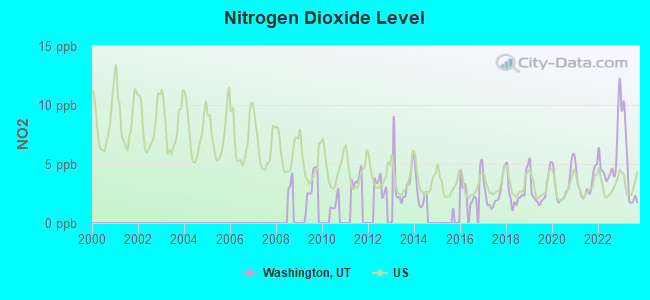
Air pollution - NO2
Air pollution - SO2
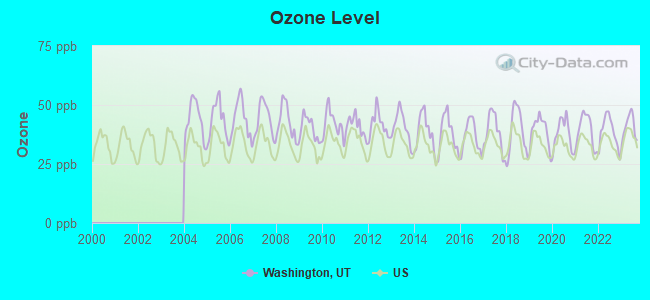
Air pollution - Ozone
Air pollution - PM10
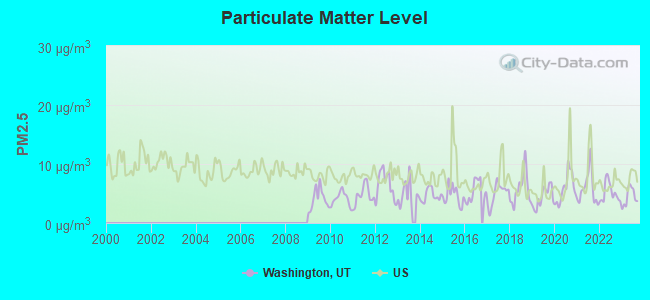
Air pollution - PM25
Air pollution - Pb
Crime - Murders per 100,000 population
Crime - Rapes per 100,000 population
Crime - Robberies per 100,000 population
Crime - Assaults per 100,000 population
Crime - Burglaries per 100,000 population
Crime - Thefts per 100,000 population
Crime - Auto thefts per 100,000 population
Crime - Arson per 100,000 population
Crime - City-data.com crime index
Crime - Violent crime index
Crime - Property crime index
Crime - Murders per 100,000 population (5 year average)
Crime - Rapes per 100,000 population (5 year average)
Crime - Robberies per 100,000 population (5 year average)
Crime - Assaults per 100,000 population (5 year average)
Crime - Burglaries per 100,000 population (5 year average)
Crime - Thefts per 100,000 population (5 year average)
Crime - Auto thefts per 100,000 population (5 year average)
Crime - Arson per 100,000 population (5 year average)
Crime - City-data.com crime index (5 year average)
Crime - Violent crime index (5 year average)
Crime - Property crime index (5 year average)
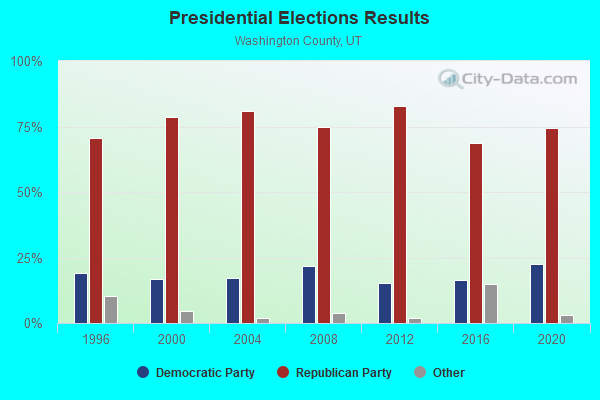
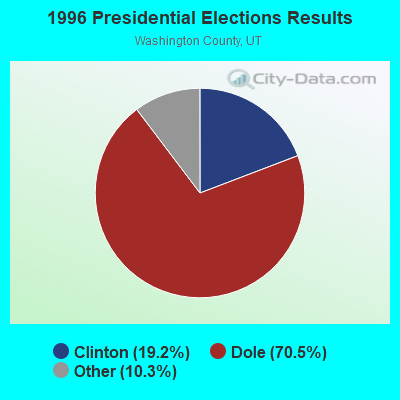
1996 Presidential Elections Results (%) - Democratic Party (Clinton)
1996 Presidential Elections Results (%) - Republican Party (Dole)
1996 Presidential Elections Results (%) - Other
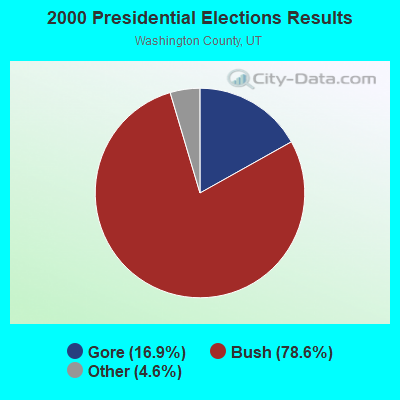
2000 Presidential Elections Results (%) - Democratic Party (Gore)
2000 Presidential Elections Results (%) - Republican Party (Bush)
2000 Presidential Elections Results (%) - Other
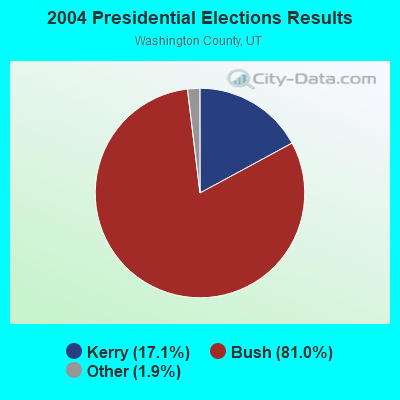
2004 Presidential Elections Results (%) - Democratic Party (Kerry)
2004 Presidential Elections Results (%) - Republican Party (Bush)
2004 Presidential Elections Results (%) - Other
2008 Presidential Elections Results (%) - Democratic Party (Obama)
2008 Presidential Elections Results (%) - Republican Party (McCain)
2008 Presidential Elections Results (%) - Other
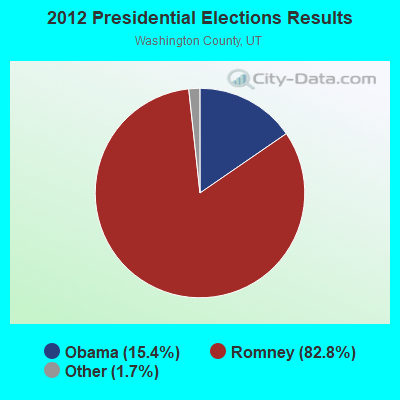
2012 Presidential Elections Results (%) - Democratic Party (Obama)
2012 Presidential Elections Results (%) - Republican Party (Romney)
2012 Presidential Elections Results (%) - Other
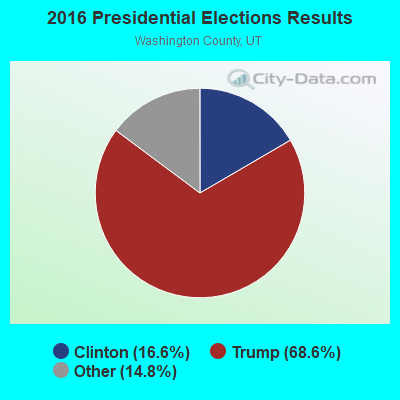
2016 Presidential Elections Results (%) - Democratic Party (Clinton)
2016 Presidential Elections Results (%) - Republican Party (Trump)
2016 Presidential Elections Results (%) - Other
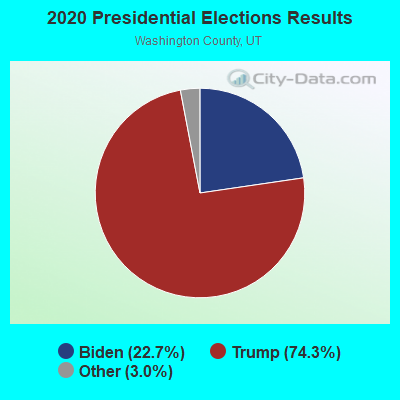
2020 Presidential Elections Results (%) - Democratic Party (Biden)
2020 Presidential Elections Results (%) - Republican Party (Trump)
2020 Presidential Elections Results (%) - Other
Ancestries Reported - Arab (%)
Ancestries Reported - Czech (%)
Ancestries Reported - Danish (%)
Ancestries Reported - Dutch (%)
Ancestries Reported - English (%)
Ancestries Reported - French (%)
Ancestries Reported - French Canadian (%)
Ancestries Reported - German (%)
Ancestries Reported - Greek (%)
Ancestries Reported - Hungarian (%)
Ancestries Reported - Irish (%)
Ancestries Reported - Italian (%)
Ancestries Reported - Lithuanian (%)
Ancestries Reported - Norwegian (%)
Ancestries Reported - Polish (%)
Ancestries Reported - Portuguese (%)
Ancestries Reported - Russian (%)
Ancestries Reported - Scotch-Irish (%)
Ancestries Reported - Scottish (%)
Ancestries Reported - Slovak (%)
Ancestries Reported - Subsaharan African (%)
Ancestries Reported - Swedish (%)
Ancestries Reported - Swiss (%)
Ancestries Reported - Ukrainian (%)
Ancestries Reported - United States (%)
Ancestries Reported - Welsh (%)
Ancestries Reported - West Indian (%)
Ancestries Reported - Other (%)
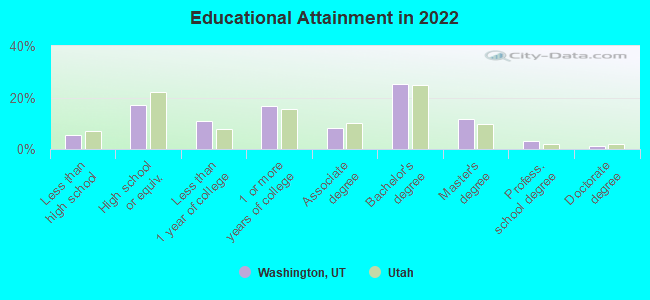
Educational Attainment - No schooling completed (%)
Educational Attainment - Less than high school (%)
Educational Attainment - High school or equivalent (%)
Educational Attainment - Less than 1 year of college (%)
Educational Attainment - 1 or more years of college (%)
Educational Attainment - Associate degree (%)
Educational Attainment - Bachelor's degree (%)
Educational Attainment - Master's degree (%)
Educational Attainment - Professional school degree (%)
Educational Attainment - Doctorate degree (%)
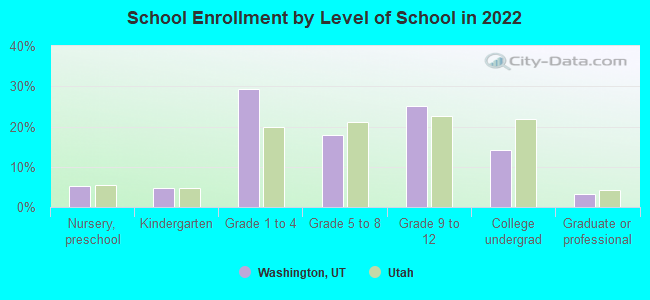
School Enrollment - Nursery, preschool (%)
School Enrollment - Kindergarten (%)
School Enrollment - Grade 1 to 4 (%)
School Enrollment - Grade 5 to 8 (%)
School Enrollment - Grade 9 to 12 (%)
School Enrollment - College undergrad (%)
School Enrollment - Graduate or professional (%)
School Enrollment - Not enrolled in school (%)
School enrollment - Public schools (%)
School enrollment - Private schools (%)
School enrollment - Not enrolled (%)
Median number of rooms in houses and condos
Median number of rooms in apartments
Housing units lacking complete plumbing facilities (%)
Housing units lacking complete kitchen facilities (%)
Density of houses
Urban houses (%)
Rural houses (%)
Households with people 60 years and over (%)
Households with people 65 years and over (%)
Households with people 75 years and over (%)
Households with one or more nonrelatives (%)
Households with no nonrelatives (%)
Population in households (%)
Family households (%)
Nonfamily households (%)
Population in families (%)
Family households with own children (%)
Median number of bedrooms in owner occupied houses
Mean number of bedrooms in owner occupied houses
Median number of bedrooms in renter occupied houses
Mean number of bedrooms in renter occupied houses
Median number of vehichles in owner occupied houses
Mean number of vehichles in owner occupied houses
Median number of vehichles in renter occupied houses
Mean number of vehichles in renter occupied houses
Mortgage status - with mortgage (%)
Mortgage status - with second mortgage (%)
Mortgage status - with home equity loan (%)
Mortgage status - with both second mortgage and home equity loan (%)
Mortgage status - without a mortgage (%)
Average family size
Average family size - White
Average family size - Black or African American
Average family size - Asian
Average family size - Hispanic or Latino
Average family size - American Indian and Alaska Native
Average family size - Multirace
Average family size - Other Race
Geographical mobility - Same house 1 year ago (%)
Geographical mobility - Moved within same county (%)
Geographical mobility - Moved from different county within same state (%)
Geographical mobility - Moved from different state (%)
Geographical mobility - Moved from abroad (%)
Place of birth - Born in state of residence (%)
Place of birth - Born in other state (%)
Place of birth - Native, outside of US (%)
Place of birth - Foreign born (%)
Housing units in structures - 1, detached (%)
Housing units in structures - 1, attached (%)
Housing units in structures - 2 (%)
Housing units in structures - 3 or 4 (%)
Housing units in structures - 5 to 9 (%)
Housing units in structures - 10 to 19 (%)
Housing units in structures - 20 to 49 (%)
Housing units in structures - 50 or more (%)
Housing units in structures - Mobile home (%)
Housing units in structures - Boat, RV, van, etc. (%)
House/condo owner moved in on average (years ago)
Renter moved in on average (years ago)
Year householder moved into unit - Moved in 1999 to March 2000 (%)
Year householder moved into unit - Moved in 1995 to 1998 (%)
Year householder moved into unit - Moved in 1990 to 1994 (%)
Year householder moved into unit - Moved in 1980 to 1989 (%)
Year householder moved into unit - Moved in 1970 to 1979 (%)
Year householder moved into unit - Moved in 1969 or earlier (%)
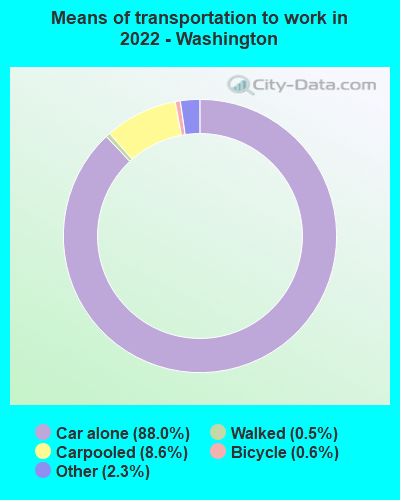
Means of transportation to work - Drove car alone (%)
Means of transportation to work - Carpooled (%)
Means of transportation to work - Public transportation (%)
Means of transportation to work - Bus or trolley bus (%)
Means of transportation to work - Streetcar or trolley car (%)
Means of transportation to work - Subway or elevated (%)
Means of transportation to work - Railroad (%)
Means of transportation to work - Ferryboat (%)
Means of transportation to work - Taxicab (%)
Means of transportation to work - Motorcycle (%)
Means of transportation to work - Bicycle (%)
Means of transportation to work - Walked (%)
Means of transportation to work - Other means (%)
Working at home (%)
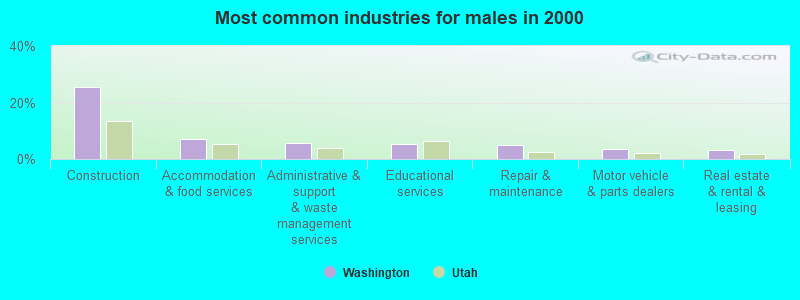
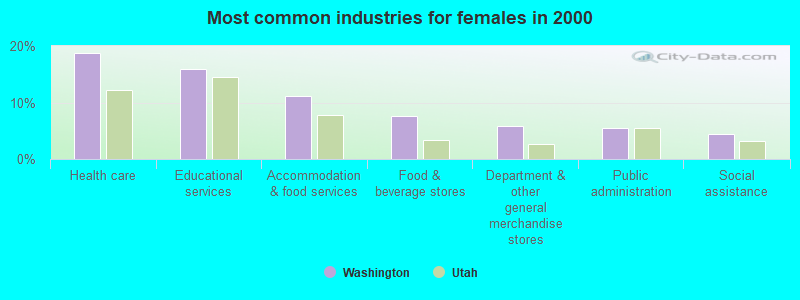
Industry diversity
Most Common Industries - Agriculture, forestry, fishing and hunting, and mining (%)
Most Common Industries - Agriculture, forestry, fishing and hunting (%)
Most Common Industries - Mining, quarrying, and oil and gas extraction (%)
Most Common Industries - Construction (%)
Most Common Industries - Manufacturing (%)
Most Common Industries - Wholesale trade (%)
Most Common Industries - Retail trade (%)
Most Common Industries - Transportation and warehousing, and utilities (%)
Most Common Industries - Transportation and warehousing (%)
Most Common Industries - Utilities (%)
Most Common Industries - Information (%)
Most Common Industries - Finance and insurance, and real estate and rental and leasing (%)
Most Common Industries - Finance and insurance (%)
Most Common Industries - Real estate and rental and leasing (%)
Most Common Industries - Professional, scientific, and management, and administrative and waste management services (%)
Most Common Industries - Professional, scientific, and technical services (%)
Most Common Industries - Management of companies and enterprises (%)
Most Common Industries - Administrative and support and waste management services (%)
Most Common Industries - Educational services, and health care and social assistance (%)
Most Common Industries - Educational services (%)
Most Common Industries - Health care and social assistance (%)
Most Common Industries - Arts, entertainment, and recreation, and accommodation and food services (%)
Most Common Industries - Arts, entertainment, and recreation (%)
Most Common Industries - Accommodation and food services (%)
Most Common Industries - Other services, except public administration (%)
Most Common Industries - Public administration (%)
Occupation diversity
Most Common Occupations - Management, business, science, and arts occupations (%)
Most Common Occupations - Management, business, and financial occupations (%)
Most Common Occupations - Management occupations (%)
Most Common Occupations - Business and financial operations occupations (%)
Most Common Occupations - Computer, engineering, and science occupations (%)
Most Common Occupations - Computer and mathematical occupations (%)
Most Common Occupations - Architecture and engineering occupations (%)
Most Common Occupations - Life, physical, and social science occupations (%)
Most Common Occupations - Education, legal, community service, arts, and media occupations (%)
Most Common Occupations - Community and social service occupations (%)
Most Common Occupations - Legal occupations (%)
Most Common Occupations - Education, training, and library occupations (%)
Most Common Occupations - Arts, design, entertainment, sports, and media occupations (%)
Most Common Occupations - Healthcare practitioners and technical occupations (%)
Most Common Occupations - Health diagnosing and treating practitioners and other technical occupations (%)
Most Common Occupations - Health technologists and technicians (%)
Most Common Occupations - Service occupations (%)
Most Common Occupations - Healthcare support occupations (%)
Most Common Occupations - Protective service occupations (%)
Most Common Occupations - Fire fighting and prevention, and other protective service workers including supervisors (%)
Most Common Occupations - Law enforcement workers including supervisors (%)
Most Common Occupations - Food preparation and serving related occupations (%)
Most Common Occupations - Building and grounds cleaning and maintenance occupations (%)
Most Common Occupations - Personal care and service occupations (%)
Most Common Occupations - Sales and office occupations (%)
Most Common Occupations - Sales and related occupations (%)
Most Common Occupations - Office and administrative support occupations (%)
Most Common Occupations - Natural resources, construction, and maintenance occupations (%)
Most Common Occupations - Farming, fishing, and forestry occupations (%)
Most Common Occupations - Construction and extraction occupations (%)
Most Common Occupations - Installation, maintenance, and repair occupations (%)
Most Common Occupations - Production, transportation, and material moving occupations (%)
Most Common Occupations - Production occupations (%)
Most Common Occupations - Transportation occupations (%)
Most Common Occupations - Material moving occupations (%)
People in Group quarters - Institutionalized population (%)
People in Group quarters - Correctional institutions (%)
People in Group quarters - Federal prisons and detention centers (%)
People in Group quarters - Halfway houses (%)
People in Group quarters - Local jails and other confinement facilities (including police lockups) (%)
People in Group quarters - Military disciplinary barracks (%)
People in Group quarters - State prisons (%)
People in Group quarters - Other types of correctional institutions (%)
People in Group quarters - Nursing homes (%)
People in Group quarters - Hospitals/wards, hospices, and schools for the handicapped (%)
People in Group quarters - Hospitals/wards and hospices for chronically ill (%)
People in Group quarters - Hospices or homes for chronically ill (%)
People in Group quarters - Military hospitals or wards for chronically ill (%)
People in Group quarters - Other hospitals or wards for chronically ill (%)
People in Group quarters - Hospitals or wards for drug/alcohol abuse (%)
People in Group quarters - Mental (Psychiatric) hospitals or wards (%)
People in Group quarters - Schools, hospitals, or wards for the mentally retarded (%)
People in Group quarters - Schools, hospitals, or wards for the physically handicapped (%)
People in Group quarters - Institutions for the deaf (%)
People in Group quarters - Institutions for the blind (%)
People in Group quarters - Orthopedic wards and institutions for the physically handicapped (%)
People in Group quarters - Wards in general hospitals for patients who have no usual home elsewhere (%)
People in Group quarters - Wards in military hospitals for patients who have no usual home elsewhere (%)
People in Group quarters - Juvenile institutions (%)
People in Group quarters - Long-term care (%)
People in Group quarters - Homes for abused, dependent, and neglected children (%)
People in Group quarters - Residential treatment centers for emotionally disturbed children (%)
People in Group quarters - Training schools for juvenile delinquents (%)
People in Group quarters - Short-term care, detention or diagnostic centers for delinquent children (%)
People in Group quarters - Type of juvenile institution unknown (%)
People in Group quarters - Noninstitutionalized population (%)
People in Group quarters - College dormitories (includes college quarters off campus) (%)
People in Group quarters - Military quarters (%)
People in Group quarters - On base (%)
People in Group quarters - Barracks, unaccompanied personnel housing (UPH), (Enlisted/Officer), ;and similar group living quarters for military personnel (%)
People in Group quarters - Transient quarters for temporary residents (%)
People in Group quarters - Military ships (%)
People in Group quarters - Group homes (%)
People in Group quarters - Homes or halfway houses for drug/alcohol abuse (%)
People in Group quarters - Homes for the mentally ill (%)
People in Group quarters - Homes for the mentally retarded (%)
People in Group quarters - Homes for the physically handicapped (%)
People in Group quarters - Other group homes (%)
People in Group quarters - Religious group quarters (%)
People in Group quarters - Dormitories (%)
People in Group quarters - Agriculture workers' dormitories on farms (%)
People in Group quarters - Job Corps and vocational training facilities (%)
People in Group quarters - Other workers' dormitories (%)
People in Group quarters - Crews of maritime vessels (%)
People in Group quarters - Other nonhousehold living situations (%)
People in Group quarters - Other noninstitutional group quarters (%)
Residents speaking English at home (%)
Residents speaking English at home - Born in the United States (%)
Residents speaking English at home - Native, born elsewhere (%)
Residents speaking English at home - Foreign born (%)
Residents speaking Spanish at home (%)
Residents speaking Spanish at home - Born in the United States (%)
Residents speaking Spanish at home - Native, born elsewhere (%)
Residents speaking Spanish at home - Foreign born (%)
Residents speaking other language at home (%)
Residents speaking other language at home - Born in the United States (%)
Residents speaking other language at home - Native, born elsewhere (%)
Residents speaking other language at home - Foreign born (%)
Class of Workers - Employee of private company (%)
Class of Workers - Self-employed in own incorporated business (%)
Class of Workers - Private not-for-profit wage and salary workers (%)
Class of Workers - Local government workers (%)
Class of Workers - State government workers (%)
Class of Workers - Federal government workers (%)
Class of Workers - Self-employed workers in own not incorporated business and Unpaid family workers (%)
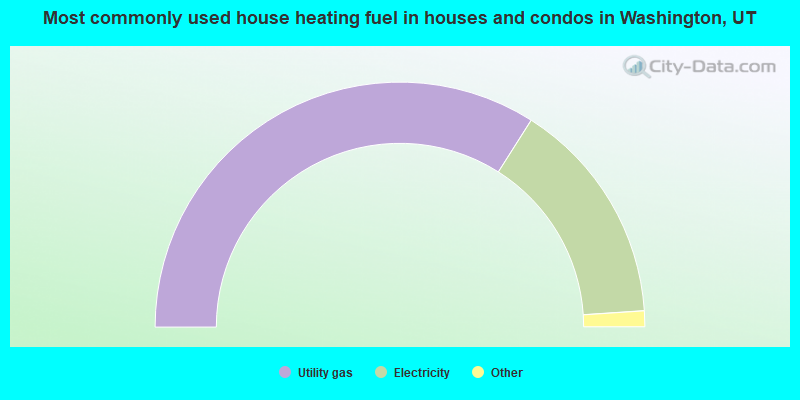
House heating fuel used in houses and condos - Utility gas (%)
House heating fuel used in houses and condos - Bottled, tank, or LP gas (%)
House heating fuel used in houses and condos - Electricity (%)
House heating fuel used in houses and condos - Fuel oil, kerosene, etc. (%)
House heating fuel used in houses and condos - Coal or coke (%)
House heating fuel used in houses and condos - Wood (%)
House heating fuel used in houses and condos - Solar energy (%)
House heating fuel used in houses and condos - Other fuel (%)
House heating fuel used in houses and condos - No fuel used (%)
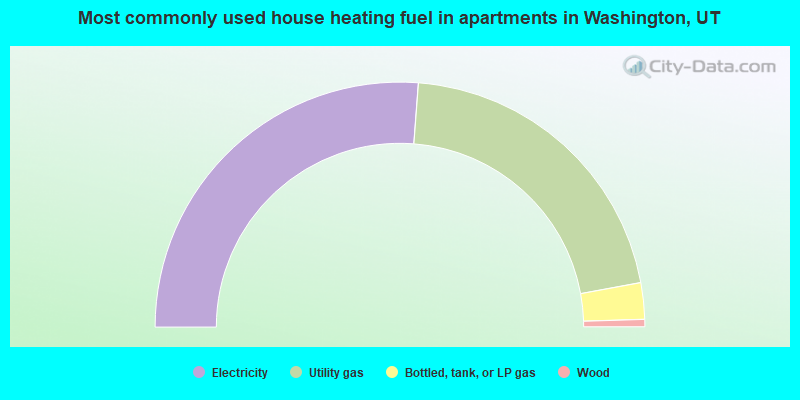
House heating fuel used in apartments - Utility gas (%)
House heating fuel used in apartments - Bottled, tank, or LP gas (%)
House heating fuel used in apartments - Electricity (%)
House heating fuel used in apartments - Fuel oil, kerosene, etc. (%)
House heating fuel used in apartments - Coal or coke (%)
House heating fuel used in apartments - Wood (%)
House heating fuel used in apartments - Solar energy (%)
House heating fuel used in apartments - Other fuel (%)
House heating fuel used in apartments - No fuel used (%)
Armed forces status - In Armed Forces (%)
Armed forces status - Civilian (%)
Armed forces status - Civilian - Veteran (%)
Armed forces status - Civilian - Nonveteran (%)
Fatal accidents locations in years 2005-2021
Fatal accidents locations in 2005
Fatal accidents locations in 2006
Fatal accidents locations in 2007
Fatal accidents locations in 2008
Fatal accidents locations in 2009
Fatal accidents locations in 2010
Fatal accidents locations in 2011
Fatal accidents locations in 2012
Fatal accidents locations in 2013
Fatal accidents locations in 2014
Fatal accidents locations in 2015
Fatal accidents locations in 2016
Fatal accidents locations in 2017
Fatal accidents locations in 2018
Fatal accidents locations in 2019
Fatal accidents locations in 2020
Fatal accidents locations in 2021
Alcohol use - People drinking some alcohol every month (%)
Alcohol use - People not drinking at all (%)
Alcohol use - Average days/month drinking alcohol
Alcohol use - Average drinks/week
Alcohol use - Average days/year people drink much
Audiometry - Average condition of hearing (%)
Audiometry - People that can hear a whisper from across a quiet room (%)
Audiometry - People that can hear normal voice from across a quiet room (%)
Audiometry - Ears ringing, roaring, buzzing (%)
Audiometry - Had a job exposure to loud noise (%)
Audiometry - Had off-work exposure to loud noise (%)
Blood Pressure & Cholesterol - Has high blood pressure (%)
Blood Pressure & Cholesterol - Checking blood pressure at home (%)
Blood Pressure & Cholesterol - Frequently checking blood cholesterol (%)
Blood Pressure & Cholesterol - Has high cholesterol level (%)
Consumer Behavior - Money monthly spent on food at supermarket/grocery store
Consumer Behavior - Money monthly spent on food at other stores
Consumer Behavior - Money monthly spent on eating out
Consumer Behavior - Money monthly spent on carryout/delivered foods
Consumer Behavior - Income spent on food at supermarket/grocery store (%)
Consumer Behavior - Income spent on food at other stores (%)
Consumer Behavior - Income spent on eating out (%)
Consumer Behavior - Income spent on carryout/delivered foods (%)
Current Health Status - General health condition (%)
Current Health Status - Blood donors (%)
Current Health Status - Has blood ever tested for HIV virus (%)
Current Health Status - Left-handed people (%)
Dermatology - People using sunscreen (%)
Diabetes - Diabetics (%)
Diabetes - Had a blood test for high blood sugar (%)
Diabetes - People taking insulin (%)
Diet Behavior & Nutrition - Diet health (%)
Diet Behavior & Nutrition - Milk product consumption (# of products/month)
Diet Behavior & Nutrition - Meals not home prepared (#/week)
Diet Behavior & Nutrition - Meals from fast food or pizza place (#/week)
Diet Behavior & Nutrition - Ready-to-eat foods (#/month)
Diet Behavior & Nutrition - Frozen meals/pizza (#/month)
Drug Use - People that ever used marijuana or hashish (%)
Drug Use - Ever used hard drugs (%)
Drug Use - Ever used any form of cocaine (%)
Drug Use - Ever used heroin (%)
Drug Use - Ever used methamphetamine (%)
Health Insurance - People covered by health insurance (%)
Kidney Conditions-Urology - Avg. # of times urinating at night
Medical Conditions - People with asthma (%)
Medical Conditions - People with anemia (%)
Medical Conditions - People with psoriasis (%)
Medical Conditions - People with overweight (%)
Medical Conditions - Elderly people having difficulties in thinking or remembering (%)
Medical Conditions - People who ever received blood transfusion (%)
Medical Conditions - People having trouble seeing even with glass/contacts (%)
Medical Conditions - People with arthritis (%)
Medical Conditions - People with gout (%)
Medical Conditions - People with congestive heart failure (%)
Medical Conditions - People with coronary heart disease (%)
Medical Conditions - People with angina pectoris (%)
Medical Conditions - People who ever had heart attack (%)
Medical Conditions - People who ever had stroke (%)
Medical Conditions - People with emphysema (%)
Medical Conditions - People with thyroid problem (%)
Medical Conditions - People with chronic bronchitis (%)
Medical Conditions - People with any liver condition (%)
Medical Conditions - People who ever had cancer or malignancy (%)
Mental Health - People who have little interest in doing things (%)
Mental Health - People feeling down, depressed, or hopeless (%)
Mental Health - People who have trouble sleeping or sleeping too much (%)
Mental Health - People feeling tired or having little energy (%)
Mental Health - People with poor appetite or overeating (%)
Mental Health - People feeling bad about themself (%)
Mental Health - People who have trouble concentrating on things (%)
Mental Health - People moving or speaking slowly or too fast (%)
Mental Health - People having thoughts they would be better off dead (%)
Oral Health - Average years since last visit a dentist
Oral Health - People embarrassed because of mouth (%)
Oral Health - People with gum disease (%)
Oral Health - General health of teeth and gums (%)
Oral Health - Average days a week using dental floss/device
Oral Health - Average days a week using mouthwash for dental problem
Oral Health - Average number of teeth
Pesticide Use - Households using pesticides to control insects (%)
Pesticide Use - Households using pesticides to kill weeds (%)
Physical Activity - People doing vigorous-intensity work activities (%)
Physical Activity - People doing moderate-intensity work activities (%)
Physical Activity - People walking or bicycling (%)
Physical Activity - People doing vigorous-intensity recreational activities (%)
Physical Activity - People doing moderate-intensity recreational activities (%)
Physical Activity - Average hours a day doing sedentary activities
Physical Activity - Average hours a day watching TV or videos
Physical Activity - Average hours a day using computer
Physical Functioning - People having limitations keeping them from working (%)
Physical Functioning - People limited in amount of work they can do (%)
Physical Functioning - People that need special equipment to walk (%)
Physical Functioning - People experiencing confusion/memory problems (%)
Physical Functioning - People requiring special healthcare equipment (%)
Prescription Medications - Average number of prescription medicines taking
Preventive Aspirin Use - Adults 40+ taking low-dose aspirin (%)
Reproductive Health - Vaginal deliveries (%)
Reproductive Health - Cesarean deliveries (%)
Reproductive Health - Deliveries resulted in a live birth (%)
Reproductive Health - Pregnancies resulted in a delivery (%)
Reproductive Health - Women breastfeeding newborns (%)
Reproductive Health - Women that had a hysterectomy (%)
Reproductive Health - Women that had both ovaries removed (%)
Reproductive Health - Women that have ever taken birth control pills (%)
Reproductive Health - Women taking birth control pills (%)
Reproductive Health - Women that have ever used Depo-Provera or injectables (%)
Reproductive Health - Women that have ever used female hormones (%)
Sexual Behavior - People 18+ that ever had sex (vaginal, anal, or oral) (%)
Sexual Behavior - Males 18+ that ever had vaginal sex with a woman (%)
Sexual Behavior - Males 18+ that ever performed oral sex on a woman (%)
Sexual Behavior - Males 18+ that ever had anal sex with a woman (%)
Sexual Behavior - Males 18+ that ever had any sex with a man (%)
Sexual Behavior - Females 18+ that ever had vaginal sex with a man (%)
Sexual Behavior - Females 18+ that ever performed oral sex on a man (%)
Sexual Behavior - Females 18+ that ever had anal sex with a man (%)
Sexual Behavior - Females 18+ that ever had any kind of sex with a woman (%)
Sexual Behavior - Average age people first had sex
Sexual Behavior - Average number of female sex partners in lifetime (males 18+)
Sexual Behavior - Average number of female vaginal sex partners in lifetime (males 18+)
Sexual Behavior - Average age people first performed oral sex on a woman (18+)
Sexual Behavior - Average number of woman performed oral sex on in lifetime (18+)
Sexual Behavior - Average number of male sex partners in lifetime (males 18+)
Sexual Behavior - Average number of male anal sex partners in lifetime (males 18+)
Sexual Behavior - Average age people first performed oral sex on a man (18+)
Sexual Behavior - Average number of male oral sex partners in lifetime (18+)
Sexual Behavior - People using protection when performing oral sex (%)
Sexual Behavior - Average number of times people have vaginal or anal sex a year
Sexual Behavior - People having sex without condom (%)
Sexual Behavior - Average number of male sex partners in lifetime (females 18+)
Sexual Behavior - Average number of male vaginal sex partners in lifetime (females 18+)
Sexual Behavior - Average number of female sex partners in lifetime (females 18+)
Sexual Behavior - Circumcised males 18+ (%)
Sleep Disorders - Average hours sleeping at night
Sleep Disorders - People that has trouble sleeping (%)
Smoking-Cigarette Use - People smoking cigarettes (%)
Taste & Smell - People 40+ having problems with smell (%)
Taste & Smell - People 40+ having problems with taste (%)
Taste & Smell - People 40+ that ever had wisdom teeth removed (%)
Taste & Smell - People 40+ that ever had tonsils teeth removed (%)
Taste & Smell - People 40+ that ever had a loss of consciousness because of a head injury (%)
Taste & Smell - People 40+ that ever had a broken nose or other serious injury to face or skull (%)
Taste & Smell - People 40+ that ever had two or more sinus infections (%)
Weight - Average height (inches)
Weight - Average weight (pounds)
Weight - Average BMI
Weight - People that are obese (%)
Weight - People that ever were obese (%)
Weight - People trying to lose weight (%)
According to our research of Utah and other state lists, there were 42 registered sex offenders living in Washington, Utah as of April 24, 2024 . The ratio of all residents to sex offenders in Washington is 581 to 1.The ratio of registered sex offenders to all residents in this city is lower than the state average.
Officers per 1,000 residents here:
0.92Utah average:
1.67
Latest news from Washington, UT collected exclusively by city-data.com from local newspapers, TV, and radio stations
Ancestries: English (20.2%), European (12.8%), American (12.1%), German (5.7%), Danish (3.2%), Norwegian (2.6%).
Current Local Time:
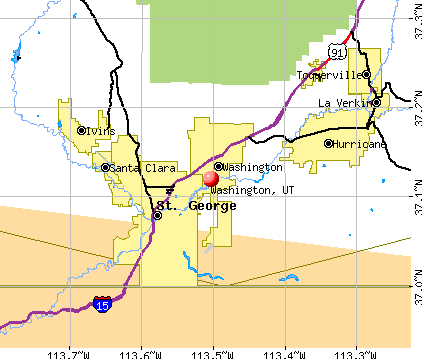
Land area: 31.5 square miles.
Population density: 1,038 people per square mile (low).
1,550 residents are foreign born (3.3% Latin America , 0.8% Asia ).
Median real estate property taxes paid for housing units with mortgages in 2022: $1,972 (0.4%)Median real estate property taxes paid for housing units with no mortgage in 2022: $2,239 (0.4%)
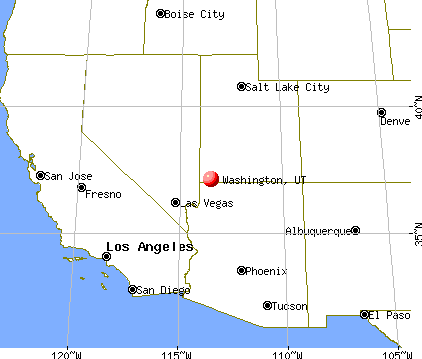
Nearest city with pop. 50,000+: Sunrise Manor, NV
Nearest city with pop. 200,000+: Las Vegas, NV
Nearest city with pop. 1,000,000+: Phoenix, AZ
Nearest cities:
Latitude: 37.12 N, Longitude: 113.50 W
Daytime population change due to commuting: -7,386 (-23.5%)Workers who live and work in this city: 4,533 (30.1%)
Area code commonly used in this area: 435
Washington tourist attractions:
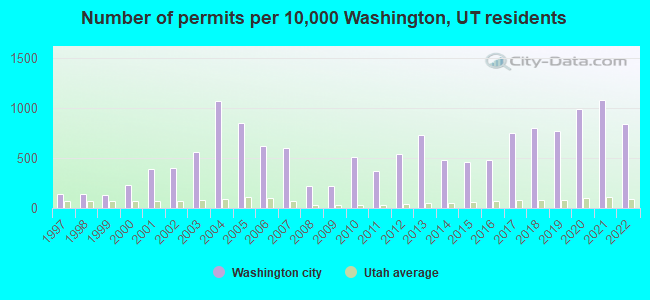
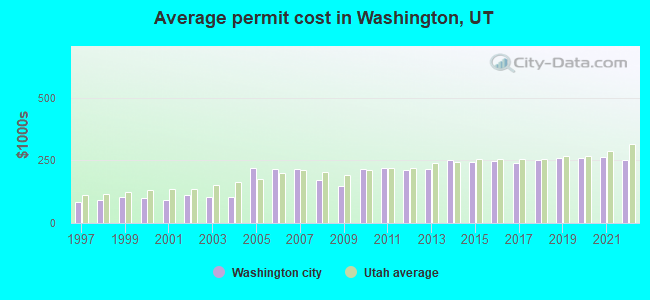
Single-family new house construction building permits:
2022: 688 buildings , average cost: $252,6002021: 886 buildings , average cost: $265,3002020: 811 buildings , average cost: $259,8002019: 632 buildings , average cost: $257,6002018: 653 buildings , average cost: $250,9002017: 619 buildings , average cost: $237,9002016: 390 buildings , average cost: $246,0002015: 373 buildings , average cost: $244,4002014: 393 buildings , average cost: $252,5002013: 602 buildings , average cost: $217,1002012: 446 buildings , average cost: $210,0002011: 303 buildings , average cost: $219,3002010: 415 buildings , average cost: $213,5002009: 180 buildings , average cost: $148,8002008: 178 buildings , average cost: $169,9002007: 496 buildings , average cost: $215,3002006: 510 buildings , average cost: $216,6002005: 694 buildings , average cost: $218,5002004: 880 buildings , average cost: $102,4002003: 461 buildings , average cost: $105,1002002: 324 buildings , average cost: $110,5002001: 321 buildings , average cost: $92,7002000: 189 buildings , average cost: $99,1001999: 104 buildings , average cost: $102,1001998: 113 buildings , average cost: $90,6001997: 116 buildings , average cost: $83,500Unemployment in December 2023:
Population change in the 1990s: +3,985 (+94.9%).
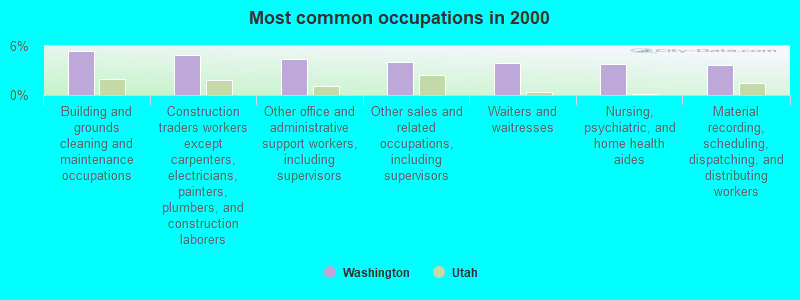
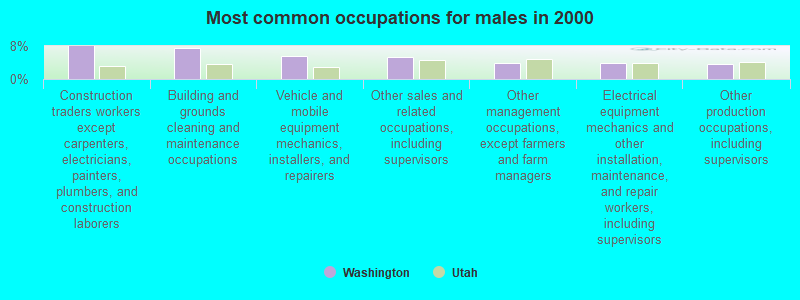
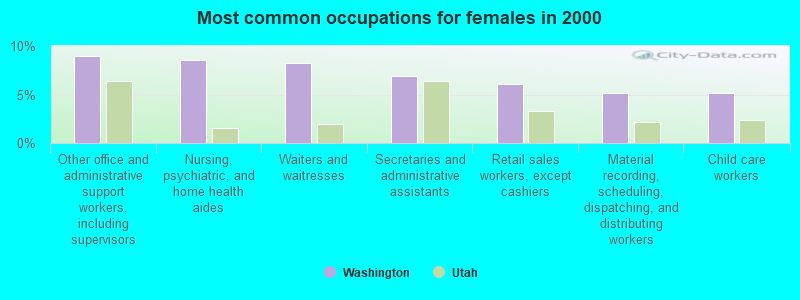
Most common occupations in Washington, UT (%)
Both Males Females
Building and grounds cleaning and maintenance occupations (5.4%)
Construction traders workers except carpenters, electricians, painters, plumbers, and construction laborers (4.9%)
Other office and administrative support workers, including supervisors (4.4%)
Other sales and related occupations, including supervisors (4.1%)
Waiters and waitresses (3.9%)
Nursing, psychiatric, and home health aides (3.7%)
Material recording, scheduling, dispatching, and distributing workers (3.7%)
Construction traders workers except carpenters, electricians, painters, plumbers, and construction laborers (7.9%)
Building and grounds cleaning and maintenance occupations (7.5%)
Vehicle and mobile equipment mechanics, installers, and repairers (5.7%)
Other sales and related occupations, including supervisors (5.4%)
Other management occupations, except farmers and farm managers (3.9%)
Electrical equipment mechanics and other installation, maintenance, and repair workers, including supervisors (3.9%)
Other production occupations, including supervisors (3.7%)
Other office and administrative support workers, including supervisors (9.0%)
Nursing, psychiatric, and home health aides (8.5%)
Waiters and waitresses (8.2%)
Secretaries and administrative assistants (6.9%)
Retail sales workers, except cashiers (6.1%)
Material recording, scheduling, dispatching, and distributing workers (5.2%)
Child care workers (5.1%)
Earthquake activity:
Washington-area historical earthquake activity is significantly above Utah state average. It is 4141% greater than the overall U.S. average. On 6/28/1992 at 11:57:34, a magnitude 7.6 (6.2 MB, 7.6 MS, 7.3 MW, Depth: 0.7 mi, Class: Major, Intensity: VIII - XII) earthquake occurred 264.9 miles away from the city center, causing 3 deaths ( 1 shaking deaths, 2 other deaths) and 400 injuries, causing $100,000,000 total damage and $40,000,000 insured lossesOn 10/16/1999 at 09:46:44, a magnitude 7.4 (6.3 MB, 7.4 MS, 7.2 MW, 7.3 ML) earthquake occurred 243.9 miles away from the city center On 10/3/1915 at 06:52:48, a magnitude 7.6 (7.6 UK) earthquake occurred 317.8 miles away from Washington center On 7/21/1952 at 11:52:14, a magnitude 7.7 (7.7 UK) earthquake occurred 340.4 miles away from the city center, causing $50,000,000 total damage On 12/21/1932 at 06:10:09, a magnitude 7.2 (7.2 UK) earthquake occurred 268.1 miles away from the city center On 5/19/1940 at 04:36:40, a magnitude 7.2 (7.2 UK) earthquake occurred 296.7 miles away from Washington center, causing $33,000,000 total damage Magnitude types: body-wave magnitude (MB), local magnitude (ML), surface-wave magnitude (MS), moment magnitude (MW) Natural disasters: The number of natural disasters in Washington County (10) is smaller than the US average (15).Major Disasters (Presidential) Declared: 4Emergencies Declared: 2Fires: 3, Floods: 3, Storms: 2, Drought: 1, Flash Flood: 1, Hurricane: 1, Winter Storm: 1, Other: 1 (Note: some incidents may be assigned to more than one category). Hospitals and medical centers near Washington: DIXIE HOME REHAB (Home Health Center, about 2 miles away; ST GEORGE, UT)
ALLIANCE HOME HEALTH OF SOUTHERN UTAH (Home Health Center, about 2 miles away; ST GEORGE, UT)
RED CLIFFS HEALTH AND REHAB (Nursing Home, about 3 miles away; ST GEORGE, UT)
ALPHA HOME HEALTH CARE LLC - SOUTHERN UTAH (Home Health Center, about 3 miles away; ST GEORGE, UT)
ROCKY MOUNTAIN HOSPICE - ST GEORGE (Hospital, about 3 miles away; ST GEORGE, UT)
KOLOB CARE AND REHABILITATION OF ST GEORGE (Nursing Home, about 4 miles away; ST GEORGE, UT)
TRI-CORP HOME HEALTH CARE INC (Home Health Center, about 4 miles away; ST GEORGE, UT)
College/University in Washington: Paul Mitchell the School-St George Full-time enrollment: 186; Location: 568 W Telegraph Rd #4; Private, for-profit; Website: stgeorge.paulmitchell.edu/)
Colleges/universities with over 2000 students nearest to Washington:
Dixie State University (about 4 miles; Saint George, UT ; Full-time enrollment: 6,485)
Southern Utah University (about 46 miles; Cedar City, UT ; FT enrollment: 6,522)
Nevada State College (about 112 miles; Henderson, NV ; FT enrollment: 2,346)
University of Nevada-Las Vegas (about 115 miles; Las Vegas, NV ; FT enrollment: 21,153)
College of Southern Nevada (about 117 miles; Las Vegas, NV ; FT enrollment: 18,996)
Mohave Community College (about 132 miles; Kingman, AZ ; FT enrollment: 3,309)
Northern Arizona University (about 170 miles; Flagstaff, AZ ; FT enrollment: 22,494)
Public elementary/middle schools in Washington: RIVERSIDE SCHOOL Students: 681, Location: 2500 S HARVEST LANE, Grades: KG-5)HORIZON SCHOOL Students: 635, Location: 1970 S ARABIAN WAY, Grades: KG-5)CORAL CANYON SCHOOL Students: 601, Location: 3435 CANYON CREST AVE, Grades: KG-5)WASHINGTON SCHOOL Students: 483, Location: 300 N 300 E, Grades: KG-5)DIXIE MONTESSORI ACADEMY Location: 1160 N. 645 W., Grades: KG-7, Charter school )
See full list of schools located in Washington Washington County has a predicted average indoor radon screening level between 2 and 4 pCi/L (pico curies per liter) - Moderate Potential Drinking water stations with addresses in Washington and their reported violations in the past:
WASHINGTON CITY (Population served: 18,000, Purch surface water):
Past health violations:
MCL, Monthly (TCR) - In SEP-2013, Contaminant: Coliform. Follow-up actions: St Formal NOV issued (NOV-24-2013), St Public Notif requested (NOV-24-2013)
MCL, Monthly (TCR) - In NOV-2005, Contaminant: Coliform. Follow-up actions: St Public Notif requested (FEB-21-2006), St Violation/Reminder Notice (FEB-21-2006), St Compliance achieved (JAN-01-2008)
MCL, Monthly (TCR) - In OCT-2005, Contaminant: Coliform. Follow-up actions: St Public Notif requested (FEB-21-2006), St Violation/Reminder Notice (FEB-21-2006), St Compliance achieved (JAN-01-2008)
Past monitoring violations:
Monitoring and Reporting (DBP) - Between OCT-2009 and DEC-2009, Contaminant: Chlorine. Follow-up actions: St Public Notif requested (FEB-15-2010), St Compliance achieved (FEB-15-2010), St Formal NOV issued (FEB-15-2010)
One regular monitoring violation
Address: 1209 E OAK GROVE DR Serves AZ, Population served: 415, Groundwater):
Past health violations:
MCL, Average - Between JUL-2011 and SEP-2011, Contaminant: Arsenic. Follow-up actions: St Compliance achieved (JUN-28-2012)
MCL, Monthly (TCR) - In AUG-2008, Contaminant: Coliform. Follow-up actions: St Compliance achieved (OCT-20-2009)
Past monitoring violations:
Monitoring and Reporting (DBP) - Between JAN-2013 and MAR-2013, Contaminant: Chlorine. Follow-up actions: St Violation/Reminder Notice (AUG-19-2013), St Formal NOV issued (JAN-10-2014), St Compliance achieved (FEB-21-2014)
Monitoring and Reporting (DBP) - Between OCT-2012 and DEC-2012, Contaminant: Chlorine. Follow-up actions: St Violation/Reminder Notice (APR-02-2013), St Formal NOV issued (JAN-10-2014), St Compliance achieved (FEB-21-2014)
Monitoring and Reporting (DBP) - Between JUL-2012 and SEP-2012, Contaminant: Chlorine. Follow-up actions: St Formal NOV issued (JAN-10-2014), St Compliance achieved (FEB-21-2014)
Monitoring and Reporting (DBP) - Between JAN-2011 and DEC-2011, Contaminant: Total Haloacetic Acids (HAA5). Follow-up actions: St Formal NOV issued (JUL-23-2012), St Compliance achieved (SEP-25-2012)
Monitoring and Reporting (DBP) - Between JAN-2011 and DEC-2011, Contaminant: TTHM. Follow-up actions: St Formal NOV issued (JUL-23-2012), St Compliance achieved (SEP-25-2012)
5 routine major monitoring violations
204 regular monitoring violations
8 other older monitoring violations
Drinking water stations with addresses in Washington that have no violations reported:
CAMP KOLOB - DEER HAVEN RANCH (Address: 82 N MAIN ST Population served: 25, Primary Water Source Type: Groundwater)
CAMP KOLOB - SPRING CREEK (Address: 82 N MAIN ST Population served: 25, Primary Water Source Type: Groundwater under infl of surface water)
Average household size: This city:
3.1 peopleUtah:
3.1 people
Percentage of family households: This city:
81.2%Whole state:
75.2%
Percentage of households with unmarried partners: This city:
3.5%Whole state:
4.6%
Likely homosexual households (counted as self-reported same-sex unmarried-partner households)
Lesbian couples: 0.3% of all households Gay men: 0.2% of all households
12 people in nursing facilities/skilled-nursing facilities in 2010people in local jails and other confinement facilities (including police lockups) in 2000people in nursing homes in 2000
Banks with branches in Washington (2011 data):
JPMorgan Chase Bank, National Association: Telegraph And 700 West Branch at 715 W Telegraph, branch established on 2010/12/10. Info updated 2011/11/10: Bank assets: $1,811,678.0 mil, Deposits: $1,190,738.0 mil, headquarters in Columbus, OH, positive income , International Specialization, 5577 total offices , Holding Company: Jpmorgan Chase & Co.
Wells Fargo Bank, National Association: Albertson's Washington Branch at 915 West Red Cliff Boulevard, branch established on 1997/07/30. Info updated 2011/04/05: Bank assets: $1,161,490.0 mil, Deposits: $905,653.0 mil, headquarters in Sioux Falls, SD, positive income , 6395 total offices , Holding Company: Wells Fargo & Company
The Village Bank: Cottonmill Branch at 650 W. Telegraph Street, branch established on 2006/11/24. Info updated 2008/10/28: Bank assets: $175.1 mil, Deposits: $159.2 mil, headquarters in Saint George, UT, negative income in the last year , Commercial Lending Specialization, 4 total offices , Holding Company: Village Bancorp
Zions First National Bank: Washington Branch at 865 West Telegraph Road, branch established on 1977/01/07. Info updated 2006/11/03: Bank assets: $17,531.3 mil, Deposits: $14,905.3 mil, headquarters in Salt Lake City, UT, positive income , Commercial Lending Specialization, 151 total offices , Holding Company: Zions Bancorporation
For population 15 years and over in Washington:
Never married: 24.5%Now married: 64.9%Separated: 0.4%Widowed: 4.2%Divorced: 6.0% For population 25 years and over in Washington:
High school or higher: 95.2%Bachelor's degree or higher: 37.1%Graduate or professional degree: 14.4%Unemployed: 4.7%Mean travel time to work (commute): 12.9 minutes
Education Gini index (Inequality in education) Here:
10.3Utah average:
10.9
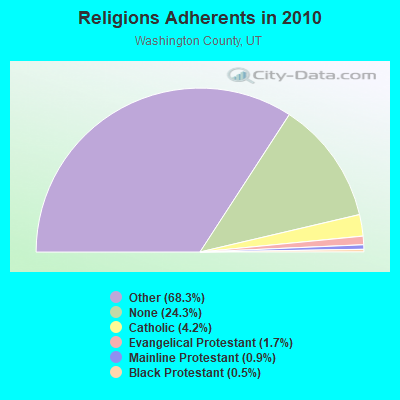
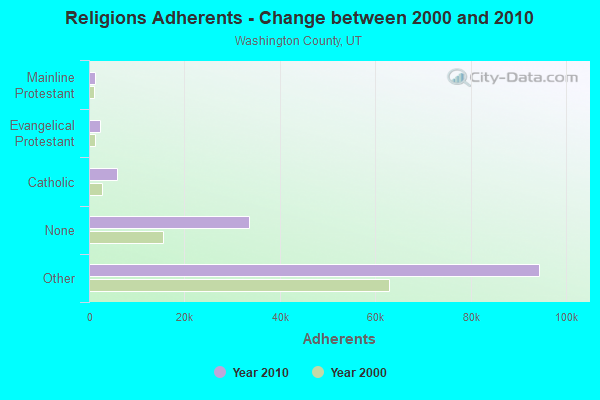
Religion statistics for Washington, UT (based on Washington County data)
Religion Adherents Congregations Other 94,366 243 Catholic 5,845 1 Evangelical Protestant 2,345 25 Mainline Protestant 1,291 5 Black Protestant 658 2 None 33,610 -
Source: Clifford Grammich, Kirk Hadaway, Richard Houseal, Dale E.Jones, Alexei Krindatch, Richie Stanley and Richard H.Taylor. 2012. 2010 U.S.Religion Census: Religious Congregations & Membership Study. Association of Statisticians of American Religious Bodies. Jones, Dale E., et al. 2002. Congregations and Membership in the United States 2000. Nashville, TN: Glenmary Research Center. Graphs represent county-level data
Food Environment Statistics: Number of grocery stores : 14Washington County :
1.05 / 10,000 pop.Utah :
1.37 / 10,000 pop.
Number of supercenters and club stores : 3Washington County :
0.22 / 10,000 pop.Utah :
0.18 / 10,000 pop.
Number of convenience stores (no gas) : 4This county :
0.30 / 10,000 pop.State :
0.41 / 10,000 pop.
Number of convenience stores (with gas) : 40This county :
3.00 / 10,000 pop.Utah :
2.82 / 10,000 pop.
Number of full-service restaurants : 73This county :
5.47 / 10,000 pop.Utah :
5.09 / 10,000 pop.
Adult diabetes rate : Washington County :
7.4%State :
6.3%
Adult obesity rate : This county :
22.6%Utah :
23.6%
Health and Nutrition: Healthy diet rate : This city:
50.9%Utah:
48.9%
Average overall health of teeth and gums : People feeling badly about themselves : Washington:
19.9%Utah:
21.0%
People not drinking alcohol at all : This city:
11.1%Utah:
10.3%
Average hours sleeping at night : Overweight people : This city:
32.8%Utah:
31.9%
General health condition : This city:
56.0%State:
57.4%
Average condition of hearing : Washington:
76.5%State:
80.1%
More about Health and Nutrition of Washington, UT Residents
Local government employment and payroll (March 2022)
Function
Full-time employees
Monthly full-time payroll
Average yearly full-time wage
Part-time employees
Monthly part-time payroll
Parks and Recreation
36 $170,321 $56,774 195 $136,449 Police Protection - Officers
29 $174,689 $72,285 0 $0 Other and Unallocable
21 $125,302 $71,601 0 $0 Other Government Administration
21 $101,339 $57,908 5 $830 Firefighters
18 $97,023 $64,682 19 $20,741 Electric Power
13 $91,760 $84,702 0 $0 Sewerage
11 $31,551 $34,419 0 $0 Financial Administration
10 $54,155 $64,986 0 $0 Streets and Highways
10 $37,891 $45,469 0 $0 Water Supply
9 $35,081 $46,775 0 $0 Police - Other
7 $32,112 $55,049 14 $9,785 Judicial and Legal
5 $33,250 $79,800 0 $0 Solid Waste Management
1 $4,305 $51,660 0 $0 Fire - Other
1 $4,601 $55,212 0 $0
Totals for Government
192 $993,380 $62,086 233 $167,805
Washington government finances - Expenditure in 2021 (per resident):
Construction - Regular Highways: $2,067,000 ($63.19)
Water Utilities: $914,000 ($27.94)Parks and Recreation: $771,000 ($23.57)General - Other: $633,000 ($19.35)Sewerage: $97,000 ($2.97)Local Fire Protection: $80,000 ($2.45)Electric Utilities: $32,000 ($0.98)Central Staff Services: $4,000 ($0.12)General Public Buildings: $2,000 ($0.06)Miscellaneous Commercial Activities - Other: $1,000 ($0.03)Current Operations - Electric Utilities: $15,398,000 ($470.76)
Parks and Recreation: $9,017,000 ($275.67)Police Protection: $8,314,000 ($254.18)Water Utilities: $6,445,000 ($197.04)Local Fire Protection: $3,744,000 ($114.46)Sewerage: $3,549,000 ($108.50)Regular Highways: $2,499,000 ($76.40)Housing and Community Development: $2,450,000 ($74.90)General - Other: $1,968,000 ($60.17)Solid Waste Management: $1,941,000 ($59.34)Central Staff Services: $1,807,000 ($55.24)General Public Buildings: $1,311,000 ($40.08)Financial Administration: $813,000 ($24.86)Judicial and Legal Services: $665,000 ($20.33)Miscellaneous Commercial Activities - Other: $255,000 ($7.80)Health - Other: $214,000 ($6.54)Natural Resources - Other: $15,000 ($0.46)Correctional Institutions: $8,000 ($0.24)Electric Utilities - Interest on Debt: $131,000 ($4.01)
General - Interest on Debt: $576,000 ($17.61)
Intergovernmental to Local - Other - General - Other: $27,000 ($0.83)
Other Capital Outlay - General - Other: $1,367,000 ($41.79)
Local Fire Protection: $1,265,000 ($38.67)Parks and Recreation: $65,000 ($1.99)Regular Highways: $62,000 ($1.90)Sewerage: $9,000 ($0.28)Police Protection: $5,000 ($0.15)Total Salaries and Wages: $22,824,000 ($697.79)
Water Utilities - Interest on Debt: $264,000 ($8.07)
Washington government finances - Revenue in 2021 (per resident):
Charges - Parks and Recreation: $7,724,000 ($236.14)
Sewerage: $2,764,000 ($84.50)Regular Highways: $2,634,000 ($80.53)Other: $2,271,000 ($69.43)Miscellaneous Commercial Activities: $174,000 ($5.32)Housing and Community Development: $2,000 ($0.06)Federal Intergovernmental - Other: $1,566,000 ($47.88)
General Local Government Support: $1,030,000 ($31.49)Local Intergovernmental - Other: $108,000 ($3.30)
Miscellaneous - General Revenue - Other: $8,874,000 ($271.30)
Special Assessments: $1,230,000 ($37.60)Interest Earnings: $497,000 ($15.19)Fines and Forfeits: $402,000 ($12.29)Sale of Property: $154,000 ($4.71)Rents: $76,000 ($2.32)Revenue - Electric Utilities: $17,605,000 ($538.23)
Water Utilities: $11,313,000 ($345.87)State Intergovernmental - Highways: $1,438,000 ($43.96)
General Local Government Support: $219,000 ($6.70)Other: $18,000 ($0.55)Tax - General Sales and Gross Receipts: $7,339,000 ($224.37)
Property: $5,288,000 ($161.67)Other Selective Sales: $3,532,000 ($107.98)Public Utilities Sales: $1,828,000 ($55.89)Other License: $1,622,000 ($49.59)Occupation and Business License - Other: $109,000 ($3.33)Alcoholic Beverage License: $8,000 ($0.24)
Washington government finances - Debt in 2021 (per resident):
Long Term Debt - Outstanding Unspecified Public Purpose: $11,698,000 ($357.64)
Beginning Outstanding - Unspecified Public Purpose: $9,531,000 ($291.39)Issue, Unspecified Public Purpose: $6,058,000 ($185.21)Retired Unspecified Public Purpose: $3,890,000 ($118.93)
Washington government finances - Cash and Securities in 2021 (per resident):
Bond Funds - Cash and Securities: $525,000 ($16.05)
Other Funds - Cash and Securities: $1,607,000 ($49.13)
Sinking Funds - Cash and Securities: $228,000 ($6.97)
Businesses in Washington, UT
Name Count Name Count
AT&T 1 Little Caesars Pizza 1 Albertsons 1 OfficeMax 1 AutoZone 1 Payless 1 Burger King 1 RadioShack 1 Discount Tire 1 Red Robin 1 El Pollo Loco 1 SONIC Drive-In 1 FedEx 3 Shoe Carnival 1 Holiday Inn 1 T-Mobile 1 Home Depot 1 U-Haul 1 IHOP 1 UPS 1 Jack In The Box 1 Walmart 1 Kohl's 1
Strongest AM radio stations in Washington:
KUNF (1210 AM; 10 kW; WASHINGTON, UT; Owner: MARATHON MEDIA GROUP, L.L.C.)
KDXU (890 AM; 10 kW; ST. GEORGE, UT; Owner: WESTERN BROADCASTING, LS, LLC)
KZNU (1450 AM; 10 kW; ST. GEORGE, UT; Owner: AM RADIO 1450, INC.)
KXNT (840 AM; 50 kW; NORTH LAS VEGAS, NV; Owner: INFINITY RADIO OPERATIONS INC.)
KDWN (720 AM; 50 kW; LAS VEGAS, NV; Owner: RADIO NEVADA CORP.)
KNNZ (940 AM; 10 kW; CEDAR CITY, UT; Owner: MB MEDIA GROUP, INC.)
KSUB (590 AM; 5 kW; CEDAR CITY, UT; Owner: MB MEDIA GROUP, INC.)
KMIA (710 AM; 50 kW; BLACK CANYON CITY, AZ; Owner: ENTRAVISION HOLDINGS, LLC)
KTNN (660 AM; 50 kW; WINDOW ROCK, AZ; Owner: THE NAVAJO NATION)
KALL (700 AM; 50 kW; NORTH SALT LAKE CITY, UT; Owner: CITICASTERS LICENSES, L.P.)
KLSQ (870 AM; 10 kW; WHITNEY, NV; Owner: KLSQ-AM LICENSE CORPORATION)
KSFN (1140 AM; 10 kW; NORTH LAS VEGAS, NV; Owner: INFINITY RADIO OPERATIONS INC.)
KLAC (570 AM; 50 kW; LOS ANGELES, CA; Owner: AMFM RADIO LICENSES, L.L.C.)
Strongest FM radio stations in Washington:
KZHK (95.9 FM; ST. GEORGE, UT; Owner: MARVIN KENT FRANDSEN)
K300AC (107.9 FM; WASHINGTON, ETC., UT; Owner: UNIVERSITY OF UTAH)
KONY (99.9 FM; ST. GEORGE, UT; Owner: FM RADIO 99.9, INC.)
KSNN (93.5 FM; ST. GEORGE, UT; Owner: WESTERN BROADCASTING, LS, LLC)
KMXM (107.1 FM; COLORADO CITY, AZ; Owner: MB MEDIA GROUP, INC.)
KREC (98.1 FM; BRIAN HEAD, UT; Owner: MARATHON MEDIA GROUP, L.L.C.)
K211BJ (90.1 FM; TOQUERVILLE, UT; Owner: UNIVERSITY OF UTAH)
K244DU (96.7 FM; ST. GEORGE, UT; Owner: MONTY C. STRATTON)
KXFF (92.5 FM; CEDAR CITY, UT; Owner: MB MEDIA GROUP, INC.)
K232CY (94.3 FM; ST. GEORGE, UT; Owner: CARL L. RIECK)
KLNR (91.7 FM; PANACA, NV; Owner: NEVADA PUBLIC RADIO CORPORATION)
KBZB (98.9 FM; PIOCHE, NV; Owner: GLA-MAR BROADCASTING, LLC)
K202AW (88.3 FM; CEDAR CITY, UT; Owner: UNIVERSITY OF UTAH)
K204BY (88.7 FM; ST. GEORGE, UT; Owner: AMERICAN FAMILY ASSOCIATION)
K252DK (98.3 FM; ST. GEORGE, UT; Owner: MARATHON MEDIA GROUP, L.L.C.)
K209AO (89.7 FM; ST. GEORGE, ETC., UT; Owner: FAITH COMMUNICATIONS CORPORATION)
K213AM (90.5 FM; ST. GEORGE, UT; Owner: UNIVERSITY OF UTAH)
K215CF (90.9 FM; ST. GEORGE, UT; Owner: UTAH STATE UNIV., AGRI & APP SCIENCE)
K272AQ (102.3 FM; ST. GEORGE, UT; Owner: B. RAY CARPENTER)
K276DJ (103.1 FM; ST. GEORGE, UT; Owner: JEFFERY M. JENNINGS)
TV broadcast stations around Washington:
K11JE (Channel 11; ST. GEORGE, UT; Owner: WASHINGTON COUNTY TELEVISION DEPARTMENT)
K46GE (Channel 46; ST. GEORGE, UT; Owner: WASHINGTON COUNTY TELEVISION DEPARTMENT)
K32FQ (Channel 32; ST. GEORGE, ETC., UT; Owner: UNIVERSITY OF UTAH)
K34FS (Channel 34; ST. GEORGE, ETC., UT; Owner: UNIVERSITY OF UTAH)
K59AG (Channel 59; BLOOMINGTON, UT; Owner: BRIGHAM YOUNG UNIVERSITY)
K02AV (Channel 2; ST. GEORGE, UT; Owner: WASHINGTON COUNTY TELEVISION DEPARTMENT)
K20GJ (Channel 20; BLOOMINGTON, UT; Owner: BONNEVILLE HOLDING COMPANY)
K63AD (Channel 63; BLOOMINGTON, UT; Owner: WASHINGTON COUNTY TELEVISION DEPT.)
K69CT (Channel 69; ST. GEORGE, UT; Owner: CLEAR CHANNEL BROADCASTING LICENSES, INC.)
KUWB-LP (Channel 65; BLOOMINGTON, UT; Owner: ACME TELEVISION LICENSES OF UTAH, LLC)
KDLQ-LP (Channel 55; ST. GEORGE, ETC., UT; Owner: MB MEDIA GROUP, INC.)
K08BN (Channel 8; ST. GEORGE, UT; Owner: WASHINGTON COUNTY TELEVISION DEPARTMENT)
K16DS (Channel 16; ST. GEORGE, UT; Owner: DANIEL MATHESON AND STEPHEN WADE d/b as BROADCAST WEST)
KDLU-LP (Channel 26; ST. GEORGE, UT; Owner: MB MEDIA GROUP, INC.)
K24CY (Channel 24; ST. GEORGE, UT; Owner: LARRY H. MILLER COMMUNICATIONS CORP.)
KUSG (Channel 12; ST. GEORGE, UT; Owner: KUTV HOLDINGS, INC.)
KCSG1 (Channel 4; ST. GEORGE, UT; Owner: DANIEL MATHESON & STEPHEN WADE d/b as BROADCAST WEST)
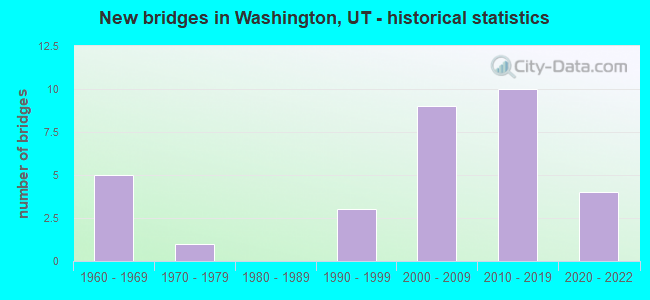
National Bridge Inventory (NBI) Statistics 32 Number of bridges249ft / 76.0m Total length669,766 Total average daily traffic127,812 Total average daily truck traffic
New bridges - historical statistics
5 1960-1969 1 1970-1979 3 1990-1999 9 2000-2009 10 2010-2019 4 2020-2022
See full National Bridge Inventory statistics for Washington, UT
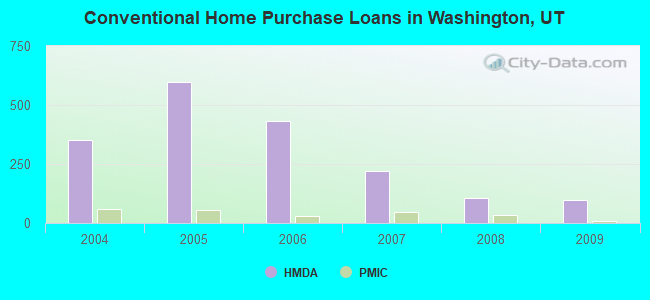
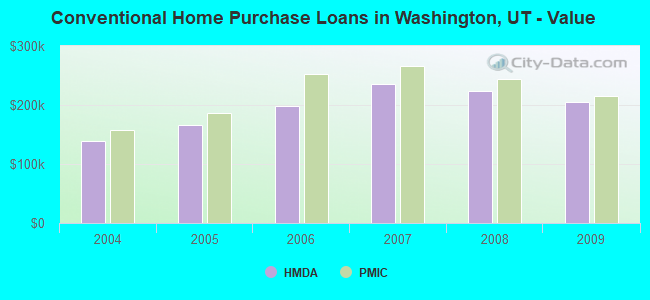
Home Mortgage Disclosure Act Aggregated Statistics For Year 2009(Based on 2 partial tracts) A) FHA, FSA/RHS & VA B) Conventional C) Refinancings D) Home Improvement Loans F) Non-occupant Loans on G) Loans On Manufactured Number Average Value Number Average Value Number Average Value Number Average Value Number Average Value Number Average Value
LOANS ORIGINATED 84 $178,577 96 $204,580 263 $202,151 3 $123,993 73 $205,241 4 $110,148 APPLICATIONS APPROVED, NOT ACCEPTED 3 $165,067 12 $375,344 33 $215,332 3 $91,710 10 $197,400 0 $0 APPLICATIONS DENIED 15 $173,055 19 $216,185 104 $219,952 5 $122,678 19 $195,804 7 $80,239 APPLICATIONS WITHDRAWN 7 $190,320 13 $255,118 53 $213,571 2 $152,660 10 $245,757 2 $69,165 FILES CLOSED FOR INCOMPLETENESS 0 $0 3 $272,440 11 $228,001 1 $91,370 3 $250,400 0 $0
Aggregated Statistics For Year 2008(Based on 2 partial tracts) A) FHA, FSA/RHS & VA B) Conventional C) Refinancings D) Home Improvement Loans F) Non-occupant Loans on G) Loans On Manufactured Number Average Value Number Average Value Number Average Value Number Average Value Number Average Value Number Average Value
LOANS ORIGINATED 61 $209,698 107 $222,978 180 $249,401 12 $125,638 55 $223,462 6 $90,880 APPLICATIONS APPROVED, NOT ACCEPTED 2 $253,540 11 $224,185 62 $242,300 2 $267,370 7 $180,817 1 $77,990 APPLICATIONS DENIED 9 $187,012 29 $405,669 139 $304,368 11 $144,500 25 $232,916 6 $93,928 APPLICATIONS WITHDRAWN 12 $208,366 12 $302,254 48 $275,094 7 $159,143 10 $220,384 1 $92,700 FILES CLOSED FOR INCOMPLETENESS 1 $130,280 3 $263,587 13 $390,824 1 $117,400 2 $233,430 0 $0
Aggregated Statistics For Year 2007(Based on 2 partial tracts) A) FHA, FSA/RHS & VA B) Conventional C) Refinancings D) Home Improvement Loans F) Non-occupant Loans on G) Loans On Manufactured Number Average Value Number Average Value Number Average Value Number Average Value Number Average Value Number Average Value
LOANS ORIGINATED 14 $185,469 219 $236,388 276 $242,580 27 $85,160 102 $236,508 11 $90,745 APPLICATIONS APPROVED, NOT ACCEPTED 2 $101,595 36 $237,383 71 $255,967 7 $125,691 15 $249,227 2 $63,525 APPLICATIONS DENIED 4 $140,818 89 $275,666 164 $287,612 18 $79,401 38 $258,817 9 $94,074 APPLICATIONS WITHDRAWN 3 $170,177 24 $273,330 50 $277,390 4 $94,105 17 $281,501 2 $107,030 FILES CLOSED FOR INCOMPLETENESS 0 $0 6 $274,982 17 $284,631 2 $191,445 2 $303,395 0 $0
Aggregated Statistics For Year 2006(Based on 2 partial tracts) A) FHA, FSA/RHS & VA B) Conventional C) Refinancings D) Home Improvement Loans F) Non-occupant Loans on G) Loans On Manufactured Number Average Value Number Average Value Number Average Value Number Average Value Number Average Value Number Average Value
LOANS ORIGINATED 9 $175,560 433 $198,131 346 $218,234 30 $95,294 164 $210,038 12 $111,928 APPLICATIONS APPROVED, NOT ACCEPTED 1 $168,380 51 $199,856 81 $222,953 7 $128,683 19 $193,146 3 $79,800 APPLICATIONS DENIED 3 $117,187 140 $204,537 142 $220,175 15 $139,667 58 $244,511 8 $113,038 APPLICATIONS WITHDRAWN 2 $179,210 52 $195,449 74 $224,667 4 $74,318 18 $216,879 4 $94,312 FILES CLOSED FOR INCOMPLETENESS 0 $0 21 $223,670 17 $210,315 3 $116,897 8 $204,622 0 $0
Aggregated Statistics For Year 2005(Based on 2 partial tracts) A) FHA, FSA/RHS & VA B) Conventional C) Refinancings D) Home Improvement Loans F) Non-occupant Loans on G) Loans On Manufactured Number Average Value Number Average Value Number Average Value Number Average Value Number Average Value Number Average Value
LOANS ORIGINATED 12 $129,492 596 $166,151 371 $171,411 27 $78,861 249 $161,257 19 $78,397 APPLICATIONS APPROVED, NOT ACCEPTED 0 $0 61 $144,997 60 $143,010 5 $82,186 16 $146,626 3 $42,503 APPLICATIONS DENIED 4 $117,615 125 $159,127 110 $170,020 16 $48,665 36 $185,100 11 $68,203 APPLICATIONS WITHDRAWN 2 $159,000 76 $148,432 79 $175,762 12 $171,688 25 $154,126 4 $106,670 FILES CLOSED FOR INCOMPLETENESS 0 $0 14 $212,091 29 $174,496 1 $38,420 2 $225,860 0 $0
Aggregated Statistics For Year 2004(Based on 2 partial tracts) A) FHA, FSA/RHS & VA B) Conventional C) Refinancings D) Home Improvement Loans F) Non-occupant Loans on G) Loans On Manufactured Number Average Value Number Average Value Number Average Value Number Average Value Number Average Value Number Average Value
LOANS ORIGINATED 30 $127,449 351 $138,495 231 $141,761 12 $77,850 127 $134,911 13 $60,192 APPLICATIONS APPROVED, NOT ACCEPTED 0 $0 39 $142,470 43 $157,082 3 $58,803 12 $115,861 2 $44,410 APPLICATIONS DENIED 5 $102,908 74 $136,228 93 $133,892 16 $49,983 22 $117,629 9 $58,753 APPLICATIONS WITHDRAWN 3 $120,320 34 $139,060 44 $132,152 3 $81,080 12 $116,467 2 $80,245 FILES CLOSED FOR INCOMPLETENESS 0 $0 9 $139,816 15 $156,039 0 $0 2 $139,645 0 $0
Detailed HMDA statistics for the following Tracts:
2708.00
, 2711.00
Private Mortgage Insurance Companies Aggregated Statistics For Year 2009(Based on 2 partial tracts) A) Conventional B) Refinancings C) Non-occupant Loans on Number Average Value Number Average Value Number Average Value
LOANS ORIGINATED 9 $215,834 6 $247,877 2 $286,460 APPLICATIONS APPROVED, NOT ACCEPTED 4 $215,672 5 $292,390 1 $189,160 APPLICATIONS DENIED 5 $318,142 3 $283,157 0 $0 APPLICATIONS WITHDRAWN 2 $144,835 2 $144,200 0 $0 FILES CLOSED FOR INCOMPLETENESS 1 $261,410 0 $0 0 $0
Aggregated Statistics For Year 2008(Based on 2 partial tracts) A) Conventional B) Refinancings C) Non-occupant Loans on Number Average Value Number Average Value Number Average Value
LOANS ORIGINATED 34 $243,687 16 $289,658 10 $239,377 APPLICATIONS APPROVED, NOT ACCEPTED 18 $252,612 12 $285,095 8 $288,982 APPLICATIONS DENIED 2 $283,960 1 $422,740 2 $198,730 APPLICATIONS WITHDRAWN 2 $151,230 0 $0 1 $177,520 FILES CLOSED FOR INCOMPLETENESS 3 $247,867 2 $254,970 2 $267,085
Aggregated Statistics For Year 2007(Based on 2 partial tracts) A) Conventional B) Refinancings C) Non-occupant Loans on Number Average Value Number Average Value Number Average Value
LOANS ORIGINATED 48 $265,869 26 $310,850 19 $264,601 APPLICATIONS APPROVED, NOT ACCEPTED 6 $252,918 6 $339,302 2 $167,295 APPLICATIONS DENIED 1 $218,360 0 $0 1 $235,670 APPLICATIONS WITHDRAWN 4 $216,995 1 $440,060 2 $303,045 FILES CLOSED FOR INCOMPLETENESS 0 $0 0 $0 0 $0
Aggregated Statistics For Year 2006(Based on 2 partial tracts) A) Conventional B) Refinancings C) Non-occupant Loans on Number Average Value Number Average Value Number Average Value
LOANS ORIGINATED 28 $251,964 10 $284,010 8 $257,659 APPLICATIONS APPROVED, NOT ACCEPTED 7 $193,683 5 $222,702 2 $158,080 APPLICATIONS DENIED 1 $270,100 1 $527,200 0 $0 APPLICATIONS WITHDRAWN 4 $217,308 2 $172,785 1 $251,990 FILES CLOSED FOR INCOMPLETENESS 0 $0 0 $0 0 $0
Aggregated Statistics For Year 2005(Based on 2 partial tracts) A) Conventional B) Refinancings C) Non-occupant Loans on D) Loans On Manufactured Number Average Value Number Average Value Number Average Value Number Average Value
LOANS ORIGINATED 56 $187,280 22 $203,691 19 $174,058 2 $92,490 APPLICATIONS APPROVED, NOT ACCEPTED 10 $209,329 9 $249,510 3 $183,253 0 $0 APPLICATIONS DENIED 1 $228,860 1 $301,330 1 $121,160 0 $0 APPLICATIONS WITHDRAWN 9 $191,804 6 $191,138 3 $206,093 0 $0 FILES CLOSED FOR INCOMPLETENESS 0 $0 0 $0 0 $0 0 $0
Aggregated Statistics For Year 2004(Based on 2 partial tracts) A) Conventional B) Refinancings C) Non-occupant Loans on D) Loans On Manufactured Number Average Value Number Average Value Number Average Value Number Average Value
LOANS ORIGINATED 60 $157,412 27 $160,814 18 $166,878 2 $78,545 APPLICATIONS APPROVED, NOT ACCEPTED 12 $179,405 14 $159,408 5 $155,962 0 $0 APPLICATIONS DENIED 1 $92,370 0 $0 0 $0 0 $0 APPLICATIONS WITHDRAWN 6 $162,297 3 $146,340 2 $189,970 0 $0 FILES CLOSED FOR INCOMPLETENESS 0 $0 0 $0 0 $0 0 $0
Detailed PMIC statistics for the following Tracts:
2708.00
, 2711.00 Fire-safe hotels and motels in Washington, Utah:
Quality Inn I-15 Red Cliffs, 912 Red Cliffs Dr, Washington, Utah 84780 Phone: (435) 673-3537, Fax: (435) 628-0145
Holiday Inn Express Hotel & Suites Washington-North St George, 2450 N Town Center Dr, Washington, Utah 84780 Phone: (435) 986-1313, Fax: (435) 986-9933
All 2 fire-safe hotels and motels in Washington, Utah
Most common first names in Washington, UT among deceased individuals Name Count Lived (average)
Robert 24 71.4 years John 22 76.9 years James 21 77.1 years William 18 76.4 years George 14 78.2 years Mary 11 78.6 years Margaret 10 83.8 years Ruth 10 79.6 years Richard 10 74.1 years Joseph 9 81.8 years
Most common last names in Washington, UT among deceased individuals Last name Count Lived (average)
Smith 15 69.9 years Johnson 14 84.1 years Jolley 12 81.4 years Iverson 12 81.0 years Jones 10 83.5 years Neilson 9 79.4 years Hansen 7 85.3 years Anderson 5 70.0 years Miller 5 87.2 years Turner 5 82.6 years
Washington compared to Utah state average:
Unemployed percentage below state average. Hispanic race population percentage significantly above state average. Foreign-born population percentage significantly above state average. Length of stay since moving in significantly above state average. House age significantly below state average. Number of college students above state average. Percentage of population with a bachelor's degree or higher above state average. Washington on our top lists :
#35 on the list of "Top 101 cities with most building permits per 10,000 residents (population 5,000+)"
#42 on the list of "Top 101 cities with the largest percentage population increase from 2000 (population 5,000+)"
#55 on the list of "Top 101 cities with the most residents born in Oceania, n.e.c. (population 500+)"
#84 on the list of "Top 100 cities with newest houses (pop. 5,000+)"
#89 on the list of "Top 101 cities with the most residents born in Oceania (population 500+)"
#40 (84790) on the list of "Top 101 zip codes with the largest percentage of English first ancestries (pop 5,000+)"
#45 (84790) on the list of "Top 101 zip codes with the largest percentage of Danish first ancestries (pop 5,000+)"
#53 (84790) on the list of "Top 101 zip codes with the largest charity contributions deductions as a percentage of AGI in 2012 (pop 5,000+)"
#6 on the list of "Top 101 counties with highest percentage of residents voting for Romney (Republican) in the 2012 Presidential Election (pop. 50,000+)"
#17 on the list of "Top 101 counties with the most Other congregations"
#18 on the list of "Top 101 counties with the highest Ozone (1-hour) air pollution readings in 2012 (ppm)"
#19 on the list of "Top 101 counties with the most Other adherents"
#20 on the list of "Top 101 counties with the lowest percentage of residents relocating to foreign countries in 2011 (pop. 50,000+)"
Top Patent Applicants
Brian D. Choules (5)
Shawn D. Nelson (5)
Monty Moshier (3)
Ross B. Wall (2)
Chad Steven Sillitoe (2)
James Colin Clark (2)
Delray Graves (2)
Martin C. Tilley (1)
Jayson Thompson (1)
Steven Swinson (1)
Total of 46 patent applications in 2008-2024.


 Recent articles from our blog. Our writers, many of them Ph.D. graduates or candidates, create easy-to-read articles on a wide variety of topics.


 (108.3 miles