Wasilla, Alaska Submit your own pictures of this city and show them to the world
OSM Map
General Map
Google Map
MSN Map
OSM Map
General Map
Google Map
MSN Map
OSM Map
General Map
Google Map
MSN Map
OSM Map
General Map
Google Map
MSN Map
Please wait while loading the map...
Population in 2022: 9,711 (90% urban, 10% rural). Population change since 2000: +77.6%Males: 4,936 Females: 4,775
March 2022 cost of living index in Wasilla: 103.4 (near average, U.S. average is 100) Percentage of residents living in poverty in 2022: 12.9%for White Non-Hispanic residents , 8.6% for Black residents , 15.7% for Hispanic or Latino residents , 24.5% for American Indian residents , 75.2% for other race residents , 12.6% for two or more races residents )
Profiles of local businesses
Business Search - 14 Million verified businesses
Data:
Median household income ($)
Median household income (% change since 2000)
Household income diversity
Ratio of average income to average house value (%)
Ratio of average income to average rent
Median household income ($) - White
Median household income ($) - Black or African American
Median household income ($) - Asian
Median household income ($) - Hispanic or Latino
Median household income ($) - American Indian and Alaska Native
Median household income ($) - Multirace
Median household income ($) - Other Race
Median household income for houses/condos with a mortgage ($)
Median household income for apartments without a mortgage ($)
Races - White alone (%)
Races - White alone (% change since 2000)
Races - Black alone (%)
Races - Black alone (% change since 2000)
Races - American Indian alone (%)
Races - American Indian alone (% change since 2000)
Races - Asian alone (%)
Races - Asian alone (% change since 2000)
Races - Hispanic (%)
Races - Hispanic (% change since 2000)
Races - Native Hawaiian and Other Pacific Islander alone (%)
Races - Native Hawaiian and Other Pacific Islander alone (% change since 2000)
Races - Two or more races (%)
Races - Two or more races (% change since 2000)
Races - Other race alone (%)
Races - Other race alone (% change since 2000)
Racial diversity
Unemployment (%)
Unemployment (% change since 2000)
Unemployment (%) - White
Unemployment (%) - Black or African American
Unemployment (%) - Asian
Unemployment (%) - Hispanic or Latino
Unemployment (%) - American Indian and Alaska Native
Unemployment (%) - Multirace
Unemployment (%) - Other Race
Population density (people per square mile)
Population - Males (%)
Population - Females (%)
Population - Males (%) - White
Population - Males (%) - Black or African American
Population - Males (%) - Asian
Population - Males (%) - Hispanic or Latino
Population - Males (%) - American Indian and Alaska Native
Population - Males (%) - Multirace
Population - Males (%) - Other Race
Population - Females (%) - White
Population - Females (%) - Black or African American
Population - Females (%) - Asian
Population - Females (%) - Hispanic or Latino
Population - Females (%) - American Indian and Alaska Native
Population - Females (%) - Multirace
Population - Females (%) - Other Race
Coronavirus confirmed cases (Apr 24, 2024)
Deaths caused by coronavirus (Apr 24, 2024)
Coronavirus confirmed cases (per 100k population) (Apr 24, 2024)
Deaths caused by coronavirus (per 100k population) (Apr 24, 2024)
Daily increase in number of cases (Apr 24, 2024)
Weekly increase in number of cases (Apr 24, 2024)
Cases doubled (in days) (Apr 24, 2024)
Hospitalized patients (Apr 18, 2022)
Negative test results (Apr 18, 2022)
Total test results (Apr 18, 2022)
COVID Vaccine doses distributed (per 100k population) (Sep 19, 2023)
COVID Vaccine doses administered (per 100k population) (Sep 19, 2023)
COVID Vaccine doses distributed (Sep 19, 2023)
COVID Vaccine doses administered (Sep 19, 2023)
Likely homosexual households (%)
Likely homosexual households (% change since 2000)
Likely homosexual households - Lesbian couples (%)
Likely homosexual households - Lesbian couples (% change since 2000)
Likely homosexual households - Gay men (%)
Likely homosexual households - Gay men (% change since 2000)
Cost of living index
Median gross rent ($)
Median contract rent ($)
Median monthly housing costs ($)
Median house or condo value ($)
Median house or condo value ($ change since 2000)
Mean house or condo value by units in structure - 1, detached ($)
Mean house or condo value by units in structure - 1, attached ($)
Mean house or condo value by units in structure - 2 ($)
Mean house or condo value by units in structure by units in structure - 3 or 4 ($)
Mean house or condo value by units in structure - 5 or more ($)
Mean house or condo value by units in structure - Boat, RV, van, etc. ($)
Mean house or condo value by units in structure - Mobile home ($)
Median house or condo value ($) - White
Median house or condo value ($) - Black or African American
Median house or condo value ($) - Asian
Median house or condo value ($) - Hispanic or Latino
Median house or condo value ($) - American Indian and Alaska Native
Median house or condo value ($) - Multirace
Median house or condo value ($) - Other Race
Median resident age
Resident age diversity
Median resident age - Males
Median resident age - Females
Median resident age - White
Median resident age - Black or African American
Median resident age - Asian
Median resident age - Hispanic or Latino
Median resident age - American Indian and Alaska Native
Median resident age - Multirace
Median resident age - Other Race
Median resident age - Males - White
Median resident age - Males - Black or African American
Median resident age - Males - Asian
Median resident age - Males - Hispanic or Latino
Median resident age - Males - American Indian and Alaska Native
Median resident age - Males - Multirace
Median resident age - Males - Other Race
Median resident age - Females - White
Median resident age - Females - Black or African American
Median resident age - Females - Asian
Median resident age - Females - Hispanic or Latino
Median resident age - Females - American Indian and Alaska Native
Median resident age - Females - Multirace
Median resident age - Females - Other Race
Commute - mean travel time to work (minutes)
Travel time to work - Less than 5 minutes (%)
Travel time to work - Less than 5 minutes (% change since 2000)
Travel time to work - 5 to 9 minutes (%)
Travel time to work - 5 to 9 minutes (% change since 2000)
Travel time to work - 10 to 19 minutes (%)
Travel time to work - 10 to 19 minutes (% change since 2000)
Travel time to work - 20 to 29 minutes (%)
Travel time to work - 20 to 29 minutes (% change since 2000)
Travel time to work - 30 to 39 minutes (%)
Travel time to work - 30 to 39 minutes (% change since 2000)
Travel time to work - 40 to 59 minutes (%)
Travel time to work - 40 to 59 minutes (% change since 2000)
Travel time to work - 60 to 89 minutes (%)
Travel time to work - 60 to 89 minutes (% change since 2000)
Travel time to work - 90 or more minutes (%)
Travel time to work - 90 or more minutes (% change since 2000)
Marital status - Never married (%)
Marital status - Now married (%)
Marital status - Separated (%)
Marital status - Widowed (%)
Marital status - Divorced (%)
Median family income ($)
Median family income (% change since 2000)
Median non-family income ($)
Median non-family income (% change since 2000)
Median per capita income ($)
Median per capita income (% change since 2000)
Median family income ($) - White
Median family income ($) - Black or African American
Median family income ($) - Asian
Median family income ($) - Hispanic or Latino
Median family income ($) - American Indian and Alaska Native
Median family income ($) - Multirace
Median family income ($) - Other Race
Median year house/condo built
Median year apartment built
Year house built - Built 2005 or later (%)
Year house built - Built 2000 to 2004 (%)
Year house built - Built 1990 to 1999 (%)
Year house built - Built 1980 to 1989 (%)
Year house built - Built 1970 to 1979 (%)
Year house built - Built 1960 to 1969 (%)
Year house built - Built 1950 to 1959 (%)
Year house built - Built 1940 to 1949 (%)
Year house built - Built 1939 or earlier (%)
Average household size
Household density (households per square mile)
Average household size - White
Average household size - Black or African American
Average household size - Asian
Average household size - Hispanic or Latino
Average household size - American Indian and Alaska Native
Average household size - Multirace
Average household size - Other Race
Occupied housing units (%)
Vacant housing units (%)
Owner occupied housing units (%)
Renter occupied housing units (%)
Vacancy status - For rent (%)
Vacancy status - For sale only (%)
Vacancy status - Rented or sold, not occupied (%)
Vacancy status - For seasonal, recreational, or occasional use (%)
Vacancy status - For migrant workers (%)
Vacancy status - Other vacant (%)
Residents with income below the poverty level (%)
Residents with income below 50% of the poverty level (%)
Children below poverty level (%)
Poor families by family type - Married-couple family (%)
Poor families by family type - Male, no wife present (%)
Poor families by family type - Female, no husband present (%)
Poverty status for native-born residents (%)
Poverty status for foreign-born residents (%)
Poverty among high school graduates not in families (%)
Poverty among people who did not graduate high school not in families (%)
Residents with income below the poverty level (%) - White
Residents with income below the poverty level (%) - Black or African American
Residents with income below the poverty level (%) - Asian
Residents with income below the poverty level (%) - Hispanic or Latino
Residents with income below the poverty level (%) - American Indian and Alaska Native
Residents with income below the poverty level (%) - Multirace
Residents with income below the poverty level (%) - Other Race
Air pollution - Air Quality Index (AQI)
Air pollution - CO
Air pollution - NO2
Air pollution - SO2
Air pollution - Ozone
Air pollution - PM10
Air pollution - PM25
Air pollution - Pb
Crime - Murders per 100,000 population
Crime - Rapes per 100,000 population
Crime - Robberies per 100,000 population
Crime - Assaults per 100,000 population
Crime - Burglaries per 100,000 population
Crime - Thefts per 100,000 population
Crime - Auto thefts per 100,000 population
Crime - Arson per 100,000 population
Crime - City-data.com crime index
Crime - Violent crime index
Crime - Property crime index
Crime - Murders per 100,000 population (5 year average)
Crime - Rapes per 100,000 population (5 year average)
Crime - Robberies per 100,000 population (5 year average)
Crime - Assaults per 100,000 population (5 year average)
Crime - Burglaries per 100,000 population (5 year average)
Crime - Thefts per 100,000 population (5 year average)
Crime - Auto thefts per 100,000 population (5 year average)
Crime - Arson per 100,000 population (5 year average)
Crime - City-data.com crime index (5 year average)
Crime - Violent crime index (5 year average)
Crime - Property crime index (5 year average)
1996 Presidential Elections Results (%) - Democratic Party (Clinton)
1996 Presidential Elections Results (%) - Republican Party (Dole)
1996 Presidential Elections Results (%) - Other
2000 Presidential Elections Results (%) - Democratic Party (Gore)
2000 Presidential Elections Results (%) - Republican Party (Bush)
2000 Presidential Elections Results (%) - Other
2004 Presidential Elections Results (%) - Democratic Party (Kerry)
2004 Presidential Elections Results (%) - Republican Party (Bush)
2004 Presidential Elections Results (%) - Other
2008 Presidential Elections Results (%) - Democratic Party (Obama)
2008 Presidential Elections Results (%) - Republican Party (McCain)
2008 Presidential Elections Results (%) - Other
2012 Presidential Elections Results (%) - Democratic Party (Obama)
2012 Presidential Elections Results (%) - Republican Party (Romney)
2012 Presidential Elections Results (%) - Other
2016 Presidential Elections Results (%) - Democratic Party (Clinton)
2016 Presidential Elections Results (%) - Republican Party (Trump)
2016 Presidential Elections Results (%) - Other
2020 Presidential Elections Results (%) - Democratic Party (Biden)
2020 Presidential Elections Results (%) - Republican Party (Trump)
2020 Presidential Elections Results (%) - Other
Ancestries Reported - Arab (%)
Ancestries Reported - Czech (%)
Ancestries Reported - Danish (%)
Ancestries Reported - Dutch (%)
Ancestries Reported - English (%)
Ancestries Reported - French (%)
Ancestries Reported - French Canadian (%)
Ancestries Reported - German (%)
Ancestries Reported - Greek (%)
Ancestries Reported - Hungarian (%)
Ancestries Reported - Irish (%)
Ancestries Reported - Italian (%)
Ancestries Reported - Lithuanian (%)
Ancestries Reported - Norwegian (%)
Ancestries Reported - Polish (%)
Ancestries Reported - Portuguese (%)
Ancestries Reported - Russian (%)
Ancestries Reported - Scotch-Irish (%)
Ancestries Reported - Scottish (%)
Ancestries Reported - Slovak (%)
Ancestries Reported - Subsaharan African (%)
Ancestries Reported - Swedish (%)
Ancestries Reported - Swiss (%)
Ancestries Reported - Ukrainian (%)
Ancestries Reported - United States (%)
Ancestries Reported - Welsh (%)
Ancestries Reported - West Indian (%)
Ancestries Reported - Other (%)
Educational Attainment - No schooling completed (%)
Educational Attainment - Less than high school (%)
Educational Attainment - High school or equivalent (%)
Educational Attainment - Less than 1 year of college (%)
Educational Attainment - 1 or more years of college (%)
Educational Attainment - Associate degree (%)
Educational Attainment - Bachelor's degree (%)
Educational Attainment - Master's degree (%)
Educational Attainment - Professional school degree (%)
Educational Attainment - Doctorate degree (%)
School Enrollment - Nursery, preschool (%)
School Enrollment - Kindergarten (%)
School Enrollment - Grade 1 to 4 (%)
School Enrollment - Grade 5 to 8 (%)
School Enrollment - Grade 9 to 12 (%)
School Enrollment - College undergrad (%)
School Enrollment - Graduate or professional (%)
School Enrollment - Not enrolled in school (%)
School enrollment - Public schools (%)
School enrollment - Private schools (%)
School enrollment - Not enrolled (%)
Median number of rooms in houses and condos
Median number of rooms in apartments
Housing units lacking complete plumbing facilities (%)
Housing units lacking complete kitchen facilities (%)
Density of houses
Urban houses (%)
Rural houses (%)
Households with people 60 years and over (%)
Households with people 65 years and over (%)
Households with people 75 years and over (%)
Households with one or more nonrelatives (%)
Households with no nonrelatives (%)
Population in households (%)
Family households (%)
Nonfamily households (%)
Population in families (%)
Family households with own children (%)
Median number of bedrooms in owner occupied houses
Mean number of bedrooms in owner occupied houses
Median number of bedrooms in renter occupied houses
Mean number of bedrooms in renter occupied houses
Median number of vehichles in owner occupied houses
Mean number of vehichles in owner occupied houses
Median number of vehichles in renter occupied houses
Mean number of vehichles in renter occupied houses
Mortgage status - with mortgage (%)
Mortgage status - with second mortgage (%)
Mortgage status - with home equity loan (%)
Mortgage status - with both second mortgage and home equity loan (%)
Mortgage status - without a mortgage (%)
Average family size
Average family size - White
Average family size - Black or African American
Average family size - Asian
Average family size - Hispanic or Latino
Average family size - American Indian and Alaska Native
Average family size - Multirace
Average family size - Other Race
Geographical mobility - Same house 1 year ago (%)
Geographical mobility - Moved within same county (%)
Geographical mobility - Moved from different county within same state (%)
Geographical mobility - Moved from different state (%)
Geographical mobility - Moved from abroad (%)
Place of birth - Born in state of residence (%)
Place of birth - Born in other state (%)
Place of birth - Native, outside of US (%)
Place of birth - Foreign born (%)
Housing units in structures - 1, detached (%)
Housing units in structures - 1, attached (%)
Housing units in structures - 2 (%)
Housing units in structures - 3 or 4 (%)
Housing units in structures - 5 to 9 (%)
Housing units in structures - 10 to 19 (%)
Housing units in structures - 20 to 49 (%)
Housing units in structures - 50 or more (%)
Housing units in structures - Mobile home (%)
Housing units in structures - Boat, RV, van, etc. (%)
House/condo owner moved in on average (years ago)
Renter moved in on average (years ago)
Year householder moved into unit - Moved in 1999 to March 2000 (%)
Year householder moved into unit - Moved in 1995 to 1998 (%)
Year householder moved into unit - Moved in 1990 to 1994 (%)
Year householder moved into unit - Moved in 1980 to 1989 (%)
Year householder moved into unit - Moved in 1970 to 1979 (%)
Year householder moved into unit - Moved in 1969 or earlier (%)
Means of transportation to work - Drove car alone (%)
Means of transportation to work - Carpooled (%)
Means of transportation to work - Public transportation (%)
Means of transportation to work - Bus or trolley bus (%)
Means of transportation to work - Streetcar or trolley car (%)
Means of transportation to work - Subway or elevated (%)
Means of transportation to work - Railroad (%)
Means of transportation to work - Ferryboat (%)
Means of transportation to work - Taxicab (%)
Means of transportation to work - Motorcycle (%)
Means of transportation to work - Bicycle (%)
Means of transportation to work - Walked (%)
Means of transportation to work - Other means (%)
Working at home (%)
Industry diversity
Most Common Industries - Agriculture, forestry, fishing and hunting, and mining (%)
Most Common Industries - Agriculture, forestry, fishing and hunting (%)
Most Common Industries - Mining, quarrying, and oil and gas extraction (%)
Most Common Industries - Construction (%)
Most Common Industries - Manufacturing (%)
Most Common Industries - Wholesale trade (%)
Most Common Industries - Retail trade (%)
Most Common Industries - Transportation and warehousing, and utilities (%)
Most Common Industries - Transportation and warehousing (%)
Most Common Industries - Utilities (%)
Most Common Industries - Information (%)
Most Common Industries - Finance and insurance, and real estate and rental and leasing (%)
Most Common Industries - Finance and insurance (%)
Most Common Industries - Real estate and rental and leasing (%)
Most Common Industries - Professional, scientific, and management, and administrative and waste management services (%)
Most Common Industries - Professional, scientific, and technical services (%)
Most Common Industries - Management of companies and enterprises (%)
Most Common Industries - Administrative and support and waste management services (%)
Most Common Industries - Educational services, and health care and social assistance (%)
Most Common Industries - Educational services (%)
Most Common Industries - Health care and social assistance (%)
Most Common Industries - Arts, entertainment, and recreation, and accommodation and food services (%)
Most Common Industries - Arts, entertainment, and recreation (%)
Most Common Industries - Accommodation and food services (%)
Most Common Industries - Other services, except public administration (%)
Most Common Industries - Public administration (%)
Occupation diversity
Most Common Occupations - Management, business, science, and arts occupations (%)
Most Common Occupations - Management, business, and financial occupations (%)
Most Common Occupations - Management occupations (%)
Most Common Occupations - Business and financial operations occupations (%)
Most Common Occupations - Computer, engineering, and science occupations (%)
Most Common Occupations - Computer and mathematical occupations (%)
Most Common Occupations - Architecture and engineering occupations (%)
Most Common Occupations - Life, physical, and social science occupations (%)
Most Common Occupations - Education, legal, community service, arts, and media occupations (%)
Most Common Occupations - Community and social service occupations (%)
Most Common Occupations - Legal occupations (%)
Most Common Occupations - Education, training, and library occupations (%)
Most Common Occupations - Arts, design, entertainment, sports, and media occupations (%)
Most Common Occupations - Healthcare practitioners and technical occupations (%)
Most Common Occupations - Health diagnosing and treating practitioners and other technical occupations (%)
Most Common Occupations - Health technologists and technicians (%)
Most Common Occupations - Service occupations (%)
Most Common Occupations - Healthcare support occupations (%)
Most Common Occupations - Protective service occupations (%)
Most Common Occupations - Fire fighting and prevention, and other protective service workers including supervisors (%)
Most Common Occupations - Law enforcement workers including supervisors (%)
Most Common Occupations - Food preparation and serving related occupations (%)
Most Common Occupations - Building and grounds cleaning and maintenance occupations (%)
Most Common Occupations - Personal care and service occupations (%)
Most Common Occupations - Sales and office occupations (%)
Most Common Occupations - Sales and related occupations (%)
Most Common Occupations - Office and administrative support occupations (%)
Most Common Occupations - Natural resources, construction, and maintenance occupations (%)
Most Common Occupations - Farming, fishing, and forestry occupations (%)
Most Common Occupations - Construction and extraction occupations (%)
Most Common Occupations - Installation, maintenance, and repair occupations (%)
Most Common Occupations - Production, transportation, and material moving occupations (%)
Most Common Occupations - Production occupations (%)
Most Common Occupations - Transportation occupations (%)
Most Common Occupations - Material moving occupations (%)
People in Group quarters - Institutionalized population (%)
People in Group quarters - Correctional institutions (%)
People in Group quarters - Federal prisons and detention centers (%)
People in Group quarters - Halfway houses (%)
People in Group quarters - Local jails and other confinement facilities (including police lockups) (%)
People in Group quarters - Military disciplinary barracks (%)
People in Group quarters - State prisons (%)
People in Group quarters - Other types of correctional institutions (%)
People in Group quarters - Nursing homes (%)
People in Group quarters - Hospitals/wards, hospices, and schools for the handicapped (%)
People in Group quarters - Hospitals/wards and hospices for chronically ill (%)
People in Group quarters - Hospices or homes for chronically ill (%)
People in Group quarters - Military hospitals or wards for chronically ill (%)
People in Group quarters - Other hospitals or wards for chronically ill (%)
People in Group quarters - Hospitals or wards for drug/alcohol abuse (%)
People in Group quarters - Mental (Psychiatric) hospitals or wards (%)
People in Group quarters - Schools, hospitals, or wards for the mentally retarded (%)
People in Group quarters - Schools, hospitals, or wards for the physically handicapped (%)
People in Group quarters - Institutions for the deaf (%)
People in Group quarters - Institutions for the blind (%)
People in Group quarters - Orthopedic wards and institutions for the physically handicapped (%)
People in Group quarters - Wards in general hospitals for patients who have no usual home elsewhere (%)
People in Group quarters - Wards in military hospitals for patients who have no usual home elsewhere (%)
People in Group quarters - Juvenile institutions (%)
People in Group quarters - Long-term care (%)
People in Group quarters - Homes for abused, dependent, and neglected children (%)
People in Group quarters - Residential treatment centers for emotionally disturbed children (%)
People in Group quarters - Training schools for juvenile delinquents (%)
People in Group quarters - Short-term care, detention or diagnostic centers for delinquent children (%)
People in Group quarters - Type of juvenile institution unknown (%)
People in Group quarters - Noninstitutionalized population (%)
People in Group quarters - College dormitories (includes college quarters off campus) (%)
People in Group quarters - Military quarters (%)
People in Group quarters - On base (%)
People in Group quarters - Barracks, unaccompanied personnel housing (UPH), (Enlisted/Officer), ;and similar group living quarters for military personnel (%)
People in Group quarters - Transient quarters for temporary residents (%)
People in Group quarters - Military ships (%)
People in Group quarters - Group homes (%)
People in Group quarters - Homes or halfway houses for drug/alcohol abuse (%)
People in Group quarters - Homes for the mentally ill (%)
People in Group quarters - Homes for the mentally retarded (%)
People in Group quarters - Homes for the physically handicapped (%)
People in Group quarters - Other group homes (%)
People in Group quarters - Religious group quarters (%)
People in Group quarters - Dormitories (%)
People in Group quarters - Agriculture workers' dormitories on farms (%)
People in Group quarters - Job Corps and vocational training facilities (%)
People in Group quarters - Other workers' dormitories (%)
People in Group quarters - Crews of maritime vessels (%)
People in Group quarters - Other nonhousehold living situations (%)
People in Group quarters - Other noninstitutional group quarters (%)
Residents speaking English at home (%)
Residents speaking English at home - Born in the United States (%)
Residents speaking English at home - Native, born elsewhere (%)
Residents speaking English at home - Foreign born (%)
Residents speaking Spanish at home (%)
Residents speaking Spanish at home - Born in the United States (%)
Residents speaking Spanish at home - Native, born elsewhere (%)
Residents speaking Spanish at home - Foreign born (%)
Residents speaking other language at home (%)
Residents speaking other language at home - Born in the United States (%)
Residents speaking other language at home - Native, born elsewhere (%)
Residents speaking other language at home - Foreign born (%)
Class of Workers - Employee of private company (%)
Class of Workers - Self-employed in own incorporated business (%)
Class of Workers - Private not-for-profit wage and salary workers (%)
Class of Workers - Local government workers (%)
Class of Workers - State government workers (%)
Class of Workers - Federal government workers (%)
Class of Workers - Self-employed workers in own not incorporated business and Unpaid family workers (%)
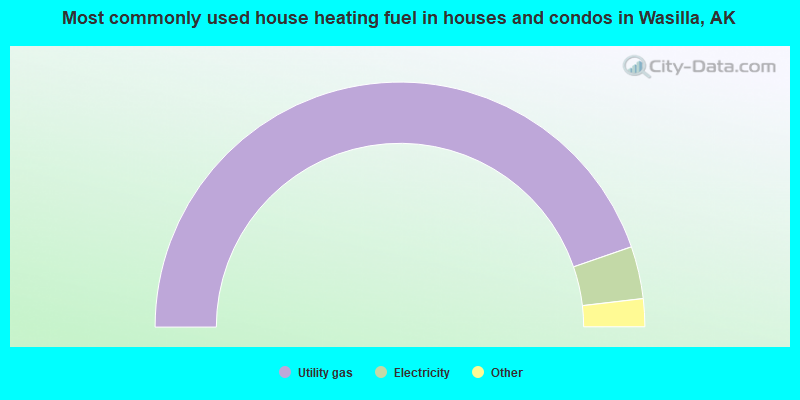
House heating fuel used in houses and condos - Utility gas (%)
House heating fuel used in houses and condos - Bottled, tank, or LP gas (%)
House heating fuel used in houses and condos - Electricity (%)
House heating fuel used in houses and condos - Fuel oil, kerosene, etc. (%)
House heating fuel used in houses and condos - Coal or coke (%)
House heating fuel used in houses and condos - Wood (%)
House heating fuel used in houses and condos - Solar energy (%)
House heating fuel used in houses and condos - Other fuel (%)
House heating fuel used in houses and condos - No fuel used (%)
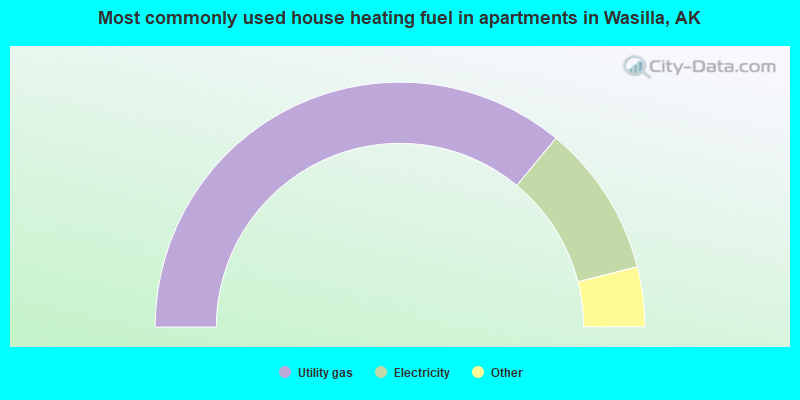
House heating fuel used in apartments - Utility gas (%)
House heating fuel used in apartments - Bottled, tank, or LP gas (%)
House heating fuel used in apartments - Electricity (%)
House heating fuel used in apartments - Fuel oil, kerosene, etc. (%)
House heating fuel used in apartments - Coal or coke (%)
House heating fuel used in apartments - Wood (%)
House heating fuel used in apartments - Solar energy (%)
House heating fuel used in apartments - Other fuel (%)
House heating fuel used in apartments - No fuel used (%)
Armed forces status - In Armed Forces (%)
Armed forces status - Civilian (%)
Armed forces status - Civilian - Veteran (%)
Armed forces status - Civilian - Nonveteran (%)
Fatal accidents locations in years 2005-2021
Fatal accidents locations in 2005
Fatal accidents locations in 2006
Fatal accidents locations in 2007
Fatal accidents locations in 2008
Fatal accidents locations in 2009
Fatal accidents locations in 2010
Fatal accidents locations in 2011
Fatal accidents locations in 2012
Fatal accidents locations in 2013
Fatal accidents locations in 2014
Fatal accidents locations in 2015
Fatal accidents locations in 2016
Fatal accidents locations in 2017
Fatal accidents locations in 2018
Fatal accidents locations in 2019
Fatal accidents locations in 2020
Fatal accidents locations in 2021
Alcohol use - People drinking some alcohol every month (%)
Alcohol use - People not drinking at all (%)
Alcohol use - Average days/month drinking alcohol
Alcohol use - Average drinks/week
Alcohol use - Average days/year people drink much
Audiometry - Average condition of hearing (%)
Audiometry - People that can hear a whisper from across a quiet room (%)
Audiometry - People that can hear normal voice from across a quiet room (%)
Audiometry - Ears ringing, roaring, buzzing (%)
Audiometry - Had a job exposure to loud noise (%)
Audiometry - Had off-work exposure to loud noise (%)
Blood Pressure & Cholesterol - Has high blood pressure (%)
Blood Pressure & Cholesterol - Checking blood pressure at home (%)
Blood Pressure & Cholesterol - Frequently checking blood cholesterol (%)
Blood Pressure & Cholesterol - Has high cholesterol level (%)
Consumer Behavior - Money monthly spent on food at supermarket/grocery store
Consumer Behavior - Money monthly spent on food at other stores
Consumer Behavior - Money monthly spent on eating out
Consumer Behavior - Money monthly spent on carryout/delivered foods
Consumer Behavior - Income spent on food at supermarket/grocery store (%)
Consumer Behavior - Income spent on food at other stores (%)
Consumer Behavior - Income spent on eating out (%)
Consumer Behavior - Income spent on carryout/delivered foods (%)
Current Health Status - General health condition (%)
Current Health Status - Blood donors (%)
Current Health Status - Has blood ever tested for HIV virus (%)
Current Health Status - Left-handed people (%)
Dermatology - People using sunscreen (%)
Diabetes - Diabetics (%)
Diabetes - Had a blood test for high blood sugar (%)
Diabetes - People taking insulin (%)
Diet Behavior & Nutrition - Diet health (%)
Diet Behavior & Nutrition - Milk product consumption (# of products/month)
Diet Behavior & Nutrition - Meals not home prepared (#/week)
Diet Behavior & Nutrition - Meals from fast food or pizza place (#/week)
Diet Behavior & Nutrition - Ready-to-eat foods (#/month)
Diet Behavior & Nutrition - Frozen meals/pizza (#/month)
Drug Use - People that ever used marijuana or hashish (%)
Drug Use - Ever used hard drugs (%)
Drug Use - Ever used any form of cocaine (%)
Drug Use - Ever used heroin (%)
Drug Use - Ever used methamphetamine (%)
Health Insurance - People covered by health insurance (%)
Kidney Conditions-Urology - Avg. # of times urinating at night
Medical Conditions - People with asthma (%)
Medical Conditions - People with anemia (%)
Medical Conditions - People with psoriasis (%)
Medical Conditions - People with overweight (%)
Medical Conditions - Elderly people having difficulties in thinking or remembering (%)
Medical Conditions - People who ever received blood transfusion (%)
Medical Conditions - People having trouble seeing even with glass/contacts (%)
Medical Conditions - People with arthritis (%)
Medical Conditions - People with gout (%)
Medical Conditions - People with congestive heart failure (%)
Medical Conditions - People with coronary heart disease (%)
Medical Conditions - People with angina pectoris (%)
Medical Conditions - People who ever had heart attack (%)
Medical Conditions - People who ever had stroke (%)
Medical Conditions - People with emphysema (%)
Medical Conditions - People with thyroid problem (%)
Medical Conditions - People with chronic bronchitis (%)
Medical Conditions - People with any liver condition (%)
Medical Conditions - People who ever had cancer or malignancy (%)
Mental Health - People who have little interest in doing things (%)
Mental Health - People feeling down, depressed, or hopeless (%)
Mental Health - People who have trouble sleeping or sleeping too much (%)
Mental Health - People feeling tired or having little energy (%)
Mental Health - People with poor appetite or overeating (%)
Mental Health - People feeling bad about themself (%)
Mental Health - People who have trouble concentrating on things (%)
Mental Health - People moving or speaking slowly or too fast (%)
Mental Health - People having thoughts they would be better off dead (%)
Oral Health - Average years since last visit a dentist
Oral Health - People embarrassed because of mouth (%)
Oral Health - People with gum disease (%)
Oral Health - General health of teeth and gums (%)
Oral Health - Average days a week using dental floss/device
Oral Health - Average days a week using mouthwash for dental problem
Oral Health - Average number of teeth
Pesticide Use - Households using pesticides to control insects (%)
Pesticide Use - Households using pesticides to kill weeds (%)
Physical Activity - People doing vigorous-intensity work activities (%)
Physical Activity - People doing moderate-intensity work activities (%)
Physical Activity - People walking or bicycling (%)
Physical Activity - People doing vigorous-intensity recreational activities (%)
Physical Activity - People doing moderate-intensity recreational activities (%)
Physical Activity - Average hours a day doing sedentary activities
Physical Activity - Average hours a day watching TV or videos
Physical Activity - Average hours a day using computer
Physical Functioning - People having limitations keeping them from working (%)
Physical Functioning - People limited in amount of work they can do (%)
Physical Functioning - People that need special equipment to walk (%)
Physical Functioning - People experiencing confusion/memory problems (%)
Physical Functioning - People requiring special healthcare equipment (%)
Prescription Medications - Average number of prescription medicines taking
Preventive Aspirin Use - Adults 40+ taking low-dose aspirin (%)
Reproductive Health - Vaginal deliveries (%)
Reproductive Health - Cesarean deliveries (%)
Reproductive Health - Deliveries resulted in a live birth (%)
Reproductive Health - Pregnancies resulted in a delivery (%)
Reproductive Health - Women breastfeeding newborns (%)
Reproductive Health - Women that had a hysterectomy (%)
Reproductive Health - Women that had both ovaries removed (%)
Reproductive Health - Women that have ever taken birth control pills (%)
Reproductive Health - Women taking birth control pills (%)
Reproductive Health - Women that have ever used Depo-Provera or injectables (%)
Reproductive Health - Women that have ever used female hormones (%)
Sexual Behavior - People 18+ that ever had sex (vaginal, anal, or oral) (%)
Sexual Behavior - Males 18+ that ever had vaginal sex with a woman (%)
Sexual Behavior - Males 18+ that ever performed oral sex on a woman (%)
Sexual Behavior - Males 18+ that ever had anal sex with a woman (%)
Sexual Behavior - Males 18+ that ever had any sex with a man (%)
Sexual Behavior - Females 18+ that ever had vaginal sex with a man (%)
Sexual Behavior - Females 18+ that ever performed oral sex on a man (%)
Sexual Behavior - Females 18+ that ever had anal sex with a man (%)
Sexual Behavior - Females 18+ that ever had any kind of sex with a woman (%)
Sexual Behavior - Average age people first had sex
Sexual Behavior - Average number of female sex partners in lifetime (males 18+)
Sexual Behavior - Average number of female vaginal sex partners in lifetime (males 18+)
Sexual Behavior - Average age people first performed oral sex on a woman (18+)
Sexual Behavior - Average number of woman performed oral sex on in lifetime (18+)
Sexual Behavior - Average number of male sex partners in lifetime (males 18+)
Sexual Behavior - Average number of male anal sex partners in lifetime (males 18+)
Sexual Behavior - Average age people first performed oral sex on a man (18+)
Sexual Behavior - Average number of male oral sex partners in lifetime (18+)
Sexual Behavior - People using protection when performing oral sex (%)
Sexual Behavior - Average number of times people have vaginal or anal sex a year
Sexual Behavior - People having sex without condom (%)
Sexual Behavior - Average number of male sex partners in lifetime (females 18+)
Sexual Behavior - Average number of male vaginal sex partners in lifetime (females 18+)
Sexual Behavior - Average number of female sex partners in lifetime (females 18+)
Sexual Behavior - Circumcised males 18+ (%)
Sleep Disorders - Average hours sleeping at night
Sleep Disorders - People that has trouble sleeping (%)
Smoking-Cigarette Use - People smoking cigarettes (%)
Taste & Smell - People 40+ having problems with smell (%)
Taste & Smell - People 40+ having problems with taste (%)
Taste & Smell - People 40+ that ever had wisdom teeth removed (%)
Taste & Smell - People 40+ that ever had tonsils teeth removed (%)
Taste & Smell - People 40+ that ever had a loss of consciousness because of a head injury (%)
Taste & Smell - People 40+ that ever had a broken nose or other serious injury to face or skull (%)
Taste & Smell - People 40+ that ever had two or more sinus infections (%)
Weight - Average height (inches)
Weight - Average weight (pounds)
Weight - Average BMI
Weight - People that are obese (%)
Weight - People that ever were obese (%)
Weight - People trying to lose weight (%)
7,096 73.4% White alone 944 9.8% Two or more races 671 6.9% Hispanic 558 5.8% American Indian alone 303 3.1% Asian alone 82 0.8% Black alone
Officers per 1,000 residents here:
2.18Alaska average:
1.77
Latest news from Wasilla, AK collected exclusively by city-data.com from local newspapers, TV, and radio stations
Ancestries: Irish (9.8%), American (9.2%), German (8.7%), English (5.7%), European (3.3%), Scottish (2.5%).
Current Local Time:
Land area: 11.7 square miles.
Population density: 829 people per square mile (low).
543 residents are foreign born (2.7% Asia , 1.4% Latin America , 1.1% Europe ).
This city:
5.6%Alaska:
7.9%
Median real estate property taxes paid for housing units with mortgages in 2022: $3,296 (1.0%)Median real estate property taxes paid for housing units with no mortgage in 2022: $3,179 (1.0%)
Nearest city with pop. 50,000+: Anchorage, AK
Nearest city with pop. 1,000,000+: Los Angeles, CA
Nearest cities:
Latitude: 61.58 N, Longitude: 149.45 W
Daytime population change due to commuting: +6,291 (+65.1%)Workers who live and work in this city: 1,760 (44.1%)
Wasilla tourist attractions:
Single-family new house construction building permits:
2022: 25 buildings , average cost: $333,5002021: 19 buildings , average cost: $307,0002020: 8 buildings , average cost: $296,8002019: 25 buildings , average cost: $283,7002018: 42 buildings , average cost: $287,0002017: 37 buildings , average cost: $290,5002016: 17 buildings , average cost: $288,4002015: 21 buildings , average cost: $291,6002014: 61 buildings , average cost: $141,4002013: 10 buildings , average cost: $229,0002012: 17 buildings , average cost: $225,0002011: 38 buildings , average cost: $220,7002010: 18 buildings , average cost: $209,1002009: 29 buildings , average cost: $228,1002008: 23 buildings , average cost: $215,7002007: 28 buildings , average cost: $199,7002006: 43 buildings , average cost: $184,6002005: 75 buildings , average cost: $171,6002004: 49 buildings , average cost: $162,4002003: 46 buildings , average cost: $156,7002002: 49 buildings , average cost: $151,7002001: 33 buildings , average cost: $151,4002000: 40 buildings , average cost: $134,9001999: 32 buildings , average cost: $127,3001998: 63 buildings , average cost: $117,5001997: 55 buildings , average cost: $107,100Unemployment in December 2023: Population change in the 1990s: +1,352 (+32.8%).
Most common occupations in Wasilla, AK (%)
Both Males Females
Other sales and related occupations, including supervisors (5.9%)
Other management occupations, except farmers and farm managers (5.7%)
Other office and administrative support workers, including supervisors (4.3%)
Electrical equipment mechanics and other installation, maintenance, and repair workers, including supervisors (3.9%)
Retail sales workers, except cashiers (3.3%)
Preschool, kindergarten, elementary, and middle school teachers (3.1%)
Material recording, scheduling, dispatching, and distributing workers (3.1%)
Electrical equipment mechanics and other installation, maintenance, and repair workers, including supervisors (7.3%)
Vehicle and mobile equipment mechanics, installers, and repairers (5.5%)
Other management occupations, except farmers and farm managers (5.3%)
Material recording, scheduling, dispatching, and distributing workers (4.8%)
Cooks and food preparation workers (4.3%)
Other sales and related occupations, including supervisors (4.1%)
Carpenters (4.1%)
Other office and administrative support workers, including supervisors (8.4%)
Other sales and related occupations, including supervisors (8.1%)
Other management occupations, except farmers and farm managers (6.2%)
Secretaries and administrative assistants (6.2%)
Preschool, kindergarten, elementary, and middle school teachers (5.3%)
Bookkeeping, accounting, and auditing clerks (4.2%)
Building and grounds cleaning and maintenance occupations (4.0%)
Earthquake activity:
Wasilla-area historical earthquake activity is significantly above Alaska state average. It is 8337% greater than the overall U.S. average. On 3/28/1964 at 03:36:12, a magnitude 9.2 (9.2 UK, Class: Great, Intensity: VIII - XII) earthquake occurred 72.1 miles away from Wasilla center, causing $1,020,000,000 total damage On 11/3/2002 at 22:12:41, a magnitude 8.5 (7.0 MB, 8.5 MS, 7.9 MW, 8.1 ME) earthquake occurred 146.1 miles away from the city center On 8/27/1904 at 21:56:06, a magnitude 8.3 (8.3 UK) earthquake occurred 174.3 miles away from Wasilla center On 11/3/2002 at 22:12:41, a magnitude 7.9 (7.9 MW, Depth: 2.6 mi, Class: Major, Intensity: VIII - XII) earthquake occurred 148.1 miles away from Wasilla center On 11/30/2018 at 17:29:29, a magnitude 7.1 (7.1 MW, Depth: 29.0 mi) earthquake occurred 23.3 miles away from Wasilla center On 10/9/1900 at 12:28:00, a magnitude 8.3 (8.3 UK) earthquake occurred 341.5 miles away from the city center Magnitude types: body-wave magnitude (MB), energy magnitude (ME), surface-wave magnitude (MS), moment magnitude (MW) Hospitals and medical centers in Wasilla: FMC WASILLA (3787 E MERIDIAN LOOP)
MAT-SU REGIONAL HOME CARE (950 E BOGARD, STE 132)
Airports, heliports and other landing facilities located in Wasilla: Wasilla Airport (IYS) Runways: , Air Taxi Ops: 1,042, Itinerant Ops: 24,200, Local Ops: 24,200, Military Ops: 72)Anderson Lake Airport (0AK1) Runways: , Itinerant Ops: 7,000)Huttunen Strip Airport (79AK) Runways: , Itinerant Ops: 50, Local Ops: 200)June Lake Airpark Airport (06AK) Runways: , Local Ops: 150)West Papoose Lake Airpark Airport (44AK) Runways: , Local Ops: 100)Birchwater Airport (AK85) Runways: Tidewater Airport (77AK) Runways: Bluff Park Farm Airport (71AK) Runways: Boisselle's Strip Airport (3AK8) Runways: Todds Strip Airport (5AK5) Runways: Cizek North Airport (6AK9) Runways: Tulakes Airport (6AK8) Runways: Fairview East Airport (58AK) Runways: Fairview West Airport (AK58) Runways: Flyway Farm Airstrip Airport (36AK) Runways: Gannon's Landing Airport (AK83) Runways: Gattis Strip Airport (16AK) Runways: Grand Home Airport (AK99) Runways: Grebe Lake Airport (AK45) Runways: Green's Strip Airport (AK65) Runways: Hess Airport (7AK8) Runways: Hunt Strip Airport (10AK) Runways: Valley Flying Crown Airport (AK27) Runways: Jack Fish Landing Airport (7AK4) Runways: Wicker Airport (42AK) Runways: Jolly Field Airport (AK79) Runways: Wolf Track Airport (9AK8) Runways: Kalmbach Airport (43AK) Runways: Yuknis Airport (23AK) Runways: Lawrence Airstrip Airport (55AK) Runways: Leisurewood Airstrip Airport (9AK6) Runways: Lincoln Village Airpark Airport (89AK) Runways: Mcdonald Ridge Airport (65AK) Runways: Mels Airport (38AK) Runways: Memory Lake Airport (5AK8) Runways: North Cubs Strip Airport (8AK8) Runways: Penderosa Airport (59AK) Runways: Piper Landing Airport (AK25) Runways: Rainbow Heights Estates Airstrip Airport (6AK7) Runways: Settlers Bay Airstrip Airport (41AK) Runways: Shawn Field Airport (AK47) Runways: Soloy Strip Airport (87AK) Runways: South Hollywood Airport (67AK) Runways: St John Homestead Airport (4AK2) Runways: Stro's Airport (AK54) Runways: Sunset Strip Airport (AK16) Runways: Carol's Heliport (60AK) T-Time Heliport (84AK) Other Facilities: 16See details about Airports, heliports and other landing facilities located in Wasilla, AK Colleges/universities with over 2000 students nearest to Wasilla:
Charter College-Anchorage (about 30 miles; Anchorage, AK ; Full-time enrollment: 2,983)
University of Alaska Anchorage (about 30 miles; Anchorage, AK ; FT enrollment: 12,483)
University of Alaska Fairbanks (about 233 miles; Fairbanks, AK ; FT enrollment: 6,397)
Whatcom Community College (about 1367 miles; Bellingham, WA ; FT enrollment: 3,265)
Western Washington University (about 1370 miles; Bellingham, WA ; FT enrollment: 13,875)
Peninsula College (about 1378 miles; Port Angeles, WA ; FT enrollment: 2,012)
Skagit Valley College (about 1392 miles; Mount Vernon, WA ; FT enrollment: 3,803)
Public high schools in Wasilla: WASILLA HIGH SCHOOL Students: 1,223, Location: 701 BOGARD RD, Grades: PK-12)TWINDLY BRIDGE CHARTER SCHOOL Students: 274, Location: 141 E SELDON ROAD SUITE C, Grades: KG-12, Charter school )BURCHELL HIGH SCHOOL Students: 216, Location: 1775 W PARKS HIGHWAY, Grades: 9-12)MAT-SU CENTRAL SCHOOL Location: 600 E RAILROAD AVE, SUITE 6, Grades: KG-12)
AMERICAN CHARTER ACADEMY Location: 7362 W. PARKS HWY #723, Grades: KG-12, Charter school )
MAT-SU CAREER & TECH ED HIGH SCHOOL Location: 2472 N SEWARD MERIDIAN PARKWAY, Grades: 9-12)
MAT-SU DAY SCHOOL Location: 3901 E BOGARD ROAD, Grades: KG-12)
Private high school in Wasilla: CORNERSTONE CHRISTIAN SCHOOL Students: 33, Location: 4001 E DARRINGTON VILLAGE AVE, Grades: PK-11)
Biggest public elementary/middle schools in Wasilla: WASILLA MIDDLE SCHOOL Students: 756, Location: 650 BOGARD RD, Grades: 6-8)TEELAND MIDDLE SCHOOL Students: 648, Location: 2788 N SEWARD MERIDIAN PARKWAY, Grades: 6-8)COTTONWOOD CREEK ELEMENTARY Students: 472, Location: 800 N SEWARD MERIDIAN, Grades: PK-5)IDITAROD ELEMENTARY Students: 446, Location: 801 N WASILLA FISHHOOK RD, Grades: PK-5)GOOSE BAY ELEMENTARY Students: 392, Location: 6400 HOLLYWOOD BLVD, Grades: PK-2)FINGER LAKE ELEMENTARY Students: 389, Location: 5981 EEK STREET, Grades: PK-5)LARSON ELEMENTARY Students: 389, Location: 2722 E SELDON RD, Grades: PK-5)MEADOW LAKES ELEMENTARY Students: 387, Location: 1741 PITTMAN ROAD, Grades: PK-5)SNOWSHOE ELEMENTARY Students: 379, Location: 2001 WEST FAIRVIEW LOOP, Grades: PK-5)TANAINA ELEMENTARY Students: 374, Location: 2550 LUCILLE ST, Grades: PK-5)Private elementary/middle schools in Wasilla: OUR LADY OF THE VALLEY CATHOLIC SCHOOL Students: 57, Location: 260 E NELSON AVE, Grades: KG-8)
AXIOS ACADEMY Students: 41, Location: 300 E KALLI CIR, Grades: PK-4)
NORTHERN LIGHT MENNONITE SCHOOL Students: 13, Location: 3369 S VALE AVE, Grades: 2-8)
See full list of schools located in Wasilla Library in Wasilla: WASILLA PUBLIC LIBRARY Operating income: $780,945; Location: 391 NORTH MAIN STREET; 49,675 books ; 1,602 audio materials ; 2,506 video materials ; 1 local licensed databases ; 50 state licensed databases ; 2 other licensed databases ; 79 print serial subscriptions )
Notable locations in Wasilla: (A) , Wasilla - Lakes Fire Service (B) , Central Matanuska - Susitna Fire Department Station 61 (C) . Display/hide their locations on the map
Lakes: (A) , Lucile Lake (B) . Display/hide their locations on the map
Tourist attractions: (1) , Dorothy G Page Museum (290 East Herning Avenue) (2) , Forward Amusement CO (Amusement & Theme Parks; 231 East Parks Highway) (3) , Alaskan Tours and Vacations (Recreational Trips & Guides; 7362 W. Parks Hwy. #754) (4) , Alaska Remote Guide Service (Tours & Charters; 3508 West Parks Hy) (5) , Alaska Outdoors LLC (Tours & Charters; Schrock Road) (6) , ABC Travel Time Inc (Tours & Charters; 191 East SWanson Avenue Suite 102) (7) . Display/hide their approximate locations on the map
Hotels: (1) , Hillside Cabins (Hatcher Passage) (2) , A & W Windbreak Hotel Cafe & Lounge (2201 East Parks Highway) (3) , Seymour Lake Bed & Breakfast Inn (PO Box 878465) (4) , Valley Country Motel (Mountain Village Pla) (5) , Best Western Lake Lucille Inn (1300 Lake Lucille Drive) (6) , Alaska's Lake Lucille Bed & Breakfast (235 West Lakeview Avenue) (7) , Alaska's Select Inn & Executive Suites (3451 Palmdale Drive Apt 2) (8) , Kashim Inn Motel (181 West Parks Highway) (9) . Display/hide their approximate locations on the map
Court: (1) . Display/hide its approximate location on the map
Birthplace of: Rob Yundt - Mixed martial artist, Ray Schafer - College basketball player (Oregon Ducks).
Matanuska-Susitna Borough has a predicted average indoor radon screening level between 2 and 4 pCi/L (pico curies per liter) - Moderate Potential Drinking water stations with addresses in Wasilla and their reported violations in the past:
WASILLA WATER SYSTEM (Population served: 18,222, Groundwater):
Past health violations:
MCL, Average - In JAN-2014, Contaminant: Arsenic. Follow-up actions: St Tech Assistance Visit (JUN-24-2014), St Other (JUN-26-2014), St Violation/Reminder Notice (JUN-26-2014)
Past monitoring violations:
63 regular monitoring violations
Population served: 2,275, Groundwater):
Past monitoring violations:
Follow-up Or Routine LCR Tap M/R - In JAN-01-2004, Contaminant: Lead and Copper Rule
4 routine major monitoring violations
One minor monitoring violation
Population served: 1,961, Groundwater):
Past health violations:
MCL, Monthly (TCR) - In SEP-2013, Contaminant: Coliform. Follow-up actions: St Compliance achieved (MAR-19-2014)
Past monitoring violations:
Failure To Address Deficiency - In JUL-20-2012, Contaminant: GROUNDWATER RULE
Failure To Address Deficiency - In JUL-20-2012, Contaminant: GROUNDWATER RULE
Population served: 1,100, Groundwater):
Past monitoring violations:
3 routine major monitoring violations
Population served: 897, Groundwater):
Past monitoring violations:
Failure To Address Deficiency - In JUL-20-2012, Contaminant: GROUNDWATER RULE
Population served: 623, Groundwater):
Past monitoring violations:
Failure To Address Deficiency - In JUN-21-2010, Contaminant: LT2ESWTR. Follow-up actions: St AO (w/o penalty) issued (NOV-28-2011), St Compliance achieved (DEC-01-2011)
Population served: 600, Groundwater):
Past monitoring violations:
One routine major monitoring violation
One regular monitoring violation
Population served: 575, Groundwater):
Past monitoring violations:
Follow-up Or Routine LCR Tap M/R - In JAN-01-2011, Contaminant: Lead and Copper Rule. Follow-up actions: St Compliance achieved (2 times from APR-29-2011 to FEB-29-2012)
One regular monitoring violation
Drinking water stations with addresses in Wasilla that have no violations reported:
VALLEY UTILITIES LLC (Population served: 1,500, Primary Water Source Type: Groundwater)
MSBSD TEELAND MIDDLE SCHOOL (Population served: 914, Primary Water Source Type: Groundwater)
SACRED HEART PARISH (Population served: 803, Primary Water Source Type: Groundwater)
VALLEY COUNTRY STORE 2 (Population served: 770, Primary Water Source Type: Groundwater)
MSBSD COTTONWOOD CREEK ELEM (Population served: 500, Primary Water Source Type: Groundwater)
MSBSD PIONEER PEAK (Population served: 475, Primary Water Source Type: Groundwater)
MSBSD SNOWSHOE ELEMENTARY (Population served: 427, Primary Water Source Type: Groundwater)
MSBSD MEADOW LAKES ELEMENTARY (Population served: 383, Primary Water Source Type: Groundwater)
MSBSD BIG LAKE ELEM #2 NEW (Population served: 365, Primary Water Source Type: Groundwater)
TESORO #78 (Population served: 315, Primary Water Source Type: Groundwater)
Average household size: This city:
2.6 peopleAlaska:
2.6 people
Percentage of family households: This city:
64.7%Whole state:
66.2%
Percentage of households with unmarried partners: This city:
8.4%Whole state:
8.6%
Likely homosexual households (counted as self-reported same-sex unmarried-partner households)
Lesbian couples: 0.3% of all households Gay men: 0.1% of all households
People in group quarters in Wasilla in 2010:
46 people in emergency and transitional shelters (with sleeping facilities) for people experiencing homelessness
44 people in nursing facilities/skilled-nursing facilities
4 people in residential treatment centers for juveniles (non-correctional)
people in other nonhousehold living situations in 2000Banks with branches in Wasilla (2011 data):
Wells Fargo Bank, National Association: Cottonwood Creek Branch, Wasilla Branch, Wasilla Wal-Mart Branch. Info updated 2011/04/05: Bank assets: $1,161,490.0 mil, Deposits: $905,653.0 mil, headquarters in Sioux Falls, SD, positive income , 6395 total offices , Holding Company: Wells Fargo & Company
Northrim Bank: Wasilla Branch at 850 East Usa Circle, branch established on 1994/02/14. Info updated 2012/02/15: Bank assets: $1,079.2 mil, Deposits: $918.5 mil, headquarters in Anchorage, AK, positive income , Commercial Lending Specialization, 10 total offices , Holding Company: Northrim Bancorp, Inc.
First National Bank Alaska: Wasilla Branch at 775 East Parks Highway, branch established on 1985/07/01. Info updated 2006/11/03: Bank assets: $2,870.3 mil, Deposits: $1,931.3 mil, headquarters in Anchorage, AK, positive income , Commercial Lending Specialization, 30 total offices
KeyBank National Association: North Lucille Street Branch at 201 North Lucille Street, branch established on 1988/11/07. Info updated 2008/03/03: Bank assets: $86,198.8 mil, Deposits: $64,214.8 mil, headquarters in Cleveland, OH, positive income , Commercial Lending Specialization, 1067 total offices , Holding Company: Keycorp
For population 15 years and over in Wasilla:
Never married: 32.3%Now married: 43.4%Separated: 1.5%Widowed: 7.3%Divorced: 15.5% For population 25 years and over in Wasilla:
High school or higher: 95.3%Bachelor's degree or higher: 20.2%Graduate or professional degree: 8.8%Unemployed: 11.2%Mean travel time to work (commute): 26.6 minutes
Education Gini index (Inequality in education) Here:
8.3Alaska average:
10.3
Religion statistics for Wasilla, AK (based on Matanuska-Susitna Borough data)
Religion Adherents Congregations Evangelical Protestant 15,076 74 Other 5,650 19 Catholic 3,354 4 Mainline Protestant 2,271 17 Black Protestant 193 1 Orthodox 112 1 None 62,339 -
Source: Clifford Grammich, Kirk Hadaway, Richard Houseal, Dale E.Jones, Alexei Krindatch, Richie Stanley and Richard H.Taylor. 2012. 2010 U.S.Religion Census: Religious Congregations & Membership Study. Association of Statisticians of American Religious Bodies. Jones, Dale E., et al. 2002. Congregations and Membership in the United States 2000. Nashville, TN: Glenmary Research Center. Graphs represent county-level data
Food Environment Statistics: Number of grocery stores : 9Matanuska-Susitna Borough :
1.09 / 10,000 pop.Alaska :
3.30 / 10,000 pop.
Number of supercenters and club stores : 2Matanuska-Susitna Borough :
0.24 / 10,000 pop.State :
0.33 / 10,000 pop.
Number of convenience stores (no gas) : 8Matanuska-Susitna Borough :
0.97 / 10,000 pop.Alaska :
0.52 / 10,000 pop.
Number of convenience stores (with gas) : 19Matanuska-Susitna Borough :
2.30 / 10,000 pop.State :
2.30 / 10,000 pop.
Number of full-service restaurants : 39This county :
4.72 / 10,000 pop.State :
7.82 / 10,000 pop.
Adult diabetes rate : This county :
6.1%Alaska :
6.3%
Health and Nutrition:
Average overall health of teeth and gums : People feeling badly about themselves : This city:
22.3%Alaska:
21.7%
People not drinking alcohol at all : This city:
10.3%State:
9.7%
Average hours sleeping at night : General health condition : Wasilla:
55.7%Alaska:
57.5%
Average condition of hearing : More about Health and Nutrition of Wasilla, AK Residents
Local government employment and payroll (March 2022)
Function
Full-time employees
Monthly full-time payroll
Average yearly full-time wage
Part-time employees
Monthly part-time payroll
Police - Other
26 $190,856 $88,087 0 $0 Police Protection - Officers
26 $227,708 $105,096 0 $0 Other Government Administration
14 $94,247 $80,783 9 $3,488 Financial Administration
13 $78,242 $72,223 0 $0 Parks and Recreation
12 $62,689 $62,689 10 $6,083 Local Libraries
9 $43,526 $58,035 7 $7,004 Water Supply
5 $33,221 $79,730 0 $0 Sewerage
5 $30,794 $73,906 0 $0 Streets and Highways
5 $32,884 $78,922 0 $0 Other and Unallocable
3 $21,045 $84,180 0 $0 Correction
1 $3,764 $45,168 0 $0 Airports
1 $9,938 $119,256 0 $0
Totals for Government
120 $828,913 $82,891 26 $16,574
Wasilla government finances - Expenditure in 2021 (per resident):
Construction - Transit Utilities: $577,000 ($59.42)
Parks and Recreation: $522,000 ($53.75)Libraries: $460,000 ($47.37)Air Transportation: $430,000 ($44.28)Police Protection: $409,000 ($42.12)Regular Highways: $298,000 ($30.69)Sewerage: $174,000 ($17.92)Water Utilities: $173,000 ($17.81)General - Other: $17,000 ($1.75)Current Operations - Health - Other: $10,946,000 ($1127.18)
Police Protection: $2,890,000 ($297.60)Parks and Recreation: $2,391,000 ($246.22)Central Staff Services: $1,717,000 ($176.81)Sewerage: $1,398,000 ($143.96)Financial Administration: $1,380,000 ($142.11)Libraries: $1,295,000 ($133.35)Water Utilities: $1,248,000 ($128.51)Regular Highways: $1,215,000 ($125.12)General - Other: $961,000 ($98.96)General Public Buildings: $579,000 ($59.62)Air Transportation: $286,000 ($29.45)Protective Inspection and Regulation - Other: $91,000 ($9.37)Corrections - Other: $81,000 ($8.34)Other Capital Outlay - General - Other: $773,000 ($79.60)
Regular Highways: $469,000 ($48.30)Sewerage: $47,000 ($4.84)Water Utilities: $47,000 ($4.84)Water Utilities - Interest on Debt: $10,000 ($1.03)
Wasilla government finances - Revenue in 2021 (per resident):
Charges - Other: $3,505,000 ($360.93)
Sewerage: $1,510,000 ($155.49)Parks and Recreation: $658,000 ($67.76)Air Transportation: $142,000 ($14.62)Miscellaneous Commercial Activities: $2,000 ($0.21)Federal Intergovernmental - Air Transportation: $130,000 ($13.39)
Local Intergovernmental - Other: $461,000 ($47.47)
Miscellaneous - General Revenue - Other: $266,000 ($27.39)
Fines and Forfeits: $174,000 ($17.92)Interest Earnings: $93,000 ($9.58)Rents: $52,000 ($5.35)Donations From Private Sources: $3,000 ($0.31)Special Assessments: $1,000 ($0.10)Revenue - Water Utilities: $2,010,000 ($206.98)
State Intergovernmental - Health and Hospitals: $10,946,000 ($1127.18)
Other: $1,543,000 ($158.89)Highways: $532,000 ($54.78)General Local Government Support: $293,000 ($30.17)Sewerage: $283,000 ($29.14)Water Utilities: $33,000 ($3.40)Tax - General Sales and Gross Receipts: $20,834,000 ($2145.40)
Motor Vehicle License: $178,000 ($18.33)Occupation and Business License - Other: $60,000 ($6.18)Other License: $16,000 ($1.65)
Wasilla government finances - Debt in 2021 (per resident):
Long Term Debt - Beginning Outstanding - Unspecified Public Purpose: $662,000 ($68.17)
Outstanding Unspecified Public Purpose: $496,000 ($51.08)Retired Unspecified Public Purpose: $165,000 ($16.99)
Wasilla government finances - Cash and Securities in 2021 (per resident):
Other Funds - Cash and Securities: $63,087,000 ($6496.45)
9.10% of this county's 2021 resident taxpayers lived in other counties in 2020 ($66,953 average adjusted gross income )
Here:
9.10%Alaska average:
7.48%
0.09% of residents moved from foreign countries ($572 average AGI )Matanuska-Susitna Borough:
0.09%Alaska average:
0.14%
Top counties from which taxpayers relocated into this county between 2020 and 2021:
Businesses in Wasilla, AK
Name Count Name Count
Arby's 1 Lowe's 1 Best Western 1 MasterBrand Cabinets 2 Blockbuster 2 McDonald's 2 Burger King 1 Nike 4 Carl\s Jr. 1 Papa John's Pizza 1 Chevrolet 1 Payless 1 ColorTyme 1 Pizza Hut 1 Curves 1 RadioShack 1 Dairy Queen 1 Red Robin 1 Famous Footwear 1 Sears 1 FedEx 5 Starbucks 2 Ford 1 Subway 5 GNC 1 Taco Bell 1 GameStop 1 Target 1 H&R Block 3 U-Haul 1 Home Depot 1 UPS 4 IHOP 1 Walgreens 1 KFC 1 Walmart 1 Kroger 2 Wendy's 1 La-Z-Boy 1
Strongest AM radio stations in Wasilla:
KENI (650 AM; 50 kW; ANCHORAGE, AK; Owner: CAPSTAR TX LIMITED PARTNERSHIP)
KFQD (750 AM; 50 kW; ANCHORAGE, AK; Owner: MCC RADIO, LLC)
KBYR (700 AM; 10 kW; ANCHORAGE, AK; Owner: COBB COMMUNICATIONS,INC.)
KTZN (550 AM; 5 kW; ANCHORAGE, AK; Owner: CAPSTAR TX LIMITED PARTNERSHIP)
KUDO (1080 AM; 10 kW; ANCHORAGE, AK; Owner: CHINOOK CONCERT BROADCASTERS, INC.)
KHAR (590 AM; 5 kW; ANCHORAGE, AK; Owner: MCC RADIO, LLC)
KSLD (1140 AM; 10 kW; SOLDOTNA, AK; Owner: KSRM, INC)
KCHU (770 AM; 10 kW; VALDEZ, AK; Owner: TERMINAL RADIO, INC.)
KJNP (1170 AM; 50 kW; NORTH POLE, AK; Owner: EVAN. ALASKA MISSIONARY FELLOWSHIP)
KSRM (920 AM; 5 kW; SOLDOTNA, AK; Owner: KSRM, INC.)
KBBI (890 AM; 10 kW; HOMER, AK; Owner: KACHEMAK BAY BROADCASTING INC)
KIAM (630 AM; 10 kW; NENANA, AK; Owner: VOICE OF CHRIST MINISTRIES, INC.)
KCAM (790 AM; 5 kW; GLENNALLEN, AK; Owner: NORTHERN LIGHT NETWORK)
Strongest FM radio stations in Wasilla:
KFAT (92.9 FM; ANCHORAGE, AK; Owner: NEW NORTHWEST BROADCASTERS, LLC)
KRPM (96.3 FM; HOUSTON, AK; Owner: NEW NORTHWEST BROADCASTERS, LLC)
KNIK-FM (105.7 FM; ANCHORAGE, AK; Owner: UBIK CORPORATION)
KGOT (101.3 FM; ANCHORAGE, AK; Owner: CAPSTAR TX LIMITED PARTNERSHIP)
KASH-FM (107.5 FM; ANCHORAGE, AK; Owner: CAPSTAR TX LIMITED PARTNERSHIP)
KQEZ (92.1 FM; HOUSTON, AK; Owner: NEW NORTHWEST BROADCASTERS, LLC)
KNBA (90.3 FM; ANCHORAGE, AK; Owner: KOAHNIC BROADCAST CORPORATION)
KSKA (91.1 FM; ANCHORAGE, AK; Owner: ALASKA PUBLIC TELECOM., INC.)
KEAG (97.3 FM; ANCHORAGE, AK; Owner: MCC RADIO, LLC)
KDBZ (102.1 FM; ANCHORAGE, AK; Owner: NEW NORTHWEST BROADCASTERS, LLC)
KWHL (106.5 FM; ANCHORAGE, AK; Owner: MCC RADIO, LLC)
KYMG (98.9 FM; ANCHORAGE, AK; Owner: CAPSTAR TX LIMITED PARTNERSHIP)
KRUA (88.1 FM; ANCHORAGE, AK; Owner: UNIVERSITY OF ALASKA - BOARD OF REGENTS)
KATB (89.3 FM; ANCHORAGE, AK; Owner: CHRISTIAN BROADCASTING, INC.)
KMBQ (99.7 FM; WASILLA, AK; Owner: KMBQ CORPORATION)
TV broadcast stations around Wasilla:
KAKM (Channel 7; ANCHORAGE, AK; Owner: ALASKA PUBLIC TELECOMMUNICATIONS INC)
KTUU-TV (Channel 2; ANCHORAGE, AK; Owner: CHANNEL 2 BROADCASTING COMPANY)
KIMO (Channel 13; ANCHORAGE, AK; Owner: SMITH TELEVISION LICENSE HOLDINGS, INC.)
KTVA (Channel 11; ANCHORAGE, AK; Owner: ALASKA BROADCASTING COMPANY, INC.)
KYES (Channel 5; ANCHORAGE, AK; Owner: FIREWEED COMMUNICATIONS CORPORATION)
K25FM (Channel 25; ANCHORAGE, AK; Owner: ACS TELEVISION, L.L.C.)
K27FJ (Channel 27; ANCHORAGE, AK; Owner: ACS TELEVISION, L.L.C.)
K50EP (Channel 50; ANCHORAGE, AK; Owner: ACS TELEVISION, L.L.C.)
K39EP (Channel 39; ANCHORAGE, AK; Owner: ACS TELEVISION, L.L.C.)
K43EY (Channel 43; ANCHORAGE, AK; Owner: ACS TELEVISION, L.L.C.)
K44EQ (Channel 44; ANCHORAGE, AK; Owner: ACS TELEVISION, L.L.C.)
K46EN (Channel 46; ANCHORAGE, AK; Owner: ACS TELEVISION, L.L.C.)
K49EE (Channel 49; ANCHORAGE, AK; Owner: ACS TELEVISION, L.L.C.)
K52FI (Channel 52; ANCHORAGE, AK; Owner: ACS TELEVISION, L.L.C.)
K53FN (Channel 53; ANCHORAGE, AK; Owner: ACS TELEVISION, L.L.C.)
K63FT (Channel 63; ANCHORAGE, AK; Owner: ACS TELEVISION, L.L.C.)
K64FA (Channel 64; ANCHORAGE, AK; Owner: ACS TELEVISION, L.L.C.)
K65GM (Channel 65; ANCHORAGE, AK; Owner: ACS TELEVISION, L.L.C.)
K67GT (Channel 67; ANCHORAGE, AK; Owner: ACS TELEVISION, L.L.C.)
K68FF (Channel 68; ANCHORAGE, AK; Owner: ACS TELEVISION, L.L.C.)
National Bridge Inventory (NBI) Statistics 37 Number of bridges640ft / 195m Total length229,956 Total average daily traffic14,521 Total average daily truck traffic
New bridges - historical statistics
2 1960-1969 1 1980-1989 6 1990-1999 22 2000-2009 6 2010-2019
See full National Bridge Inventory statistics for Wasilla, AK
Home Mortgage Disclosure Act Aggregated Statistics For Year 2009(Based on 2 full tracts) A) FHA, FSA/RHS & VA B) Conventional C) Refinancings D) Home Improvement Loans E) Loans on Dwellings For 5+ Families F) Non-occupant Loans on Number Average Value Number Average Value Number Average Value Number Average Value Number Average Value Number Average Value
LOANS ORIGINATED 120 $209,365 66 $194,335 404 $203,651 22 $123,805 1 $275,690 27 $170,966 APPLICATIONS APPROVED, NOT ACCEPTED 4 $255,012 11 $192,699 42 $203,228 4 $79,752 0 $0 4 $198,642 APPLICATIONS DENIED 18 $220,605 18 $146,477 100 $221,462 14 $78,869 0 $0 10 $184,518 APPLICATIONS WITHDRAWN 11 $200,957 15 $173,463 133 $202,734 16 $132,367 0 $0 12 $164,995 FILES CLOSED FOR INCOMPLETENESS 4 $275,688 3 $82,040 29 $179,309 4 $76,650 0 $0 3 $126,477
Aggregated Statistics For Year 2008(Based on 2 full tracts) A) FHA, FSA/RHS & VA B) Conventional C) Refinancings D) Home Improvement Loans E) Loans on Dwellings For 5+ Families F) Non-occupant Loans on G) Loans On Manufactured Number Average Value Number Average Value Number Average Value Number Average Value Number Average Value Number Average Value Number Average Value
LOANS ORIGINATED 78 $207,492 92 $209,268 166 $190,755 21 $125,560 1 $351,500 22 $161,997 3 $118,667 APPLICATIONS APPROVED, NOT ACCEPTED 7 $165,844 16 $159,969 28 $227,451 3 $141,540 0 $0 8 $185,848 1 $38,000 APPLICATIONS DENIED 15 $159,606 11 $141,635 88 $188,155 16 $70,897 0 $0 16 $167,421 1 $40,000 APPLICATIONS WITHDRAWN 14 $168,099 13 $222,416 92 $199,606 8 $128,425 0 $0 7 $186,426 0 $0 FILES CLOSED FOR INCOMPLETENESS 1 $214,640 0 $0 11 $182,591 4 $32,737 0 $0 1 $251,070 0 $0
Aggregated Statistics For Year 2007(Based on 2 full tracts) A) FHA, FSA/RHS & VA B) Conventional C) Refinancings D) Home Improvement Loans E) Loans on Dwellings For 5+ Families F) Non-occupant Loans on G) Loans On Manufactured Number Average Value Number Average Value Number Average Value Number Average Value Number Average Value Number Average Value Number Average Value
LOANS ORIGINATED 82 $206,135 176 $192,377 149 $192,084 28 $63,329 2 $278,640 44 $186,411 3 $54,333 APPLICATIONS APPROVED, NOT ACCEPTED 0 $0 33 $199,870 31 $191,315 3 $55,793 0 $0 15 $178,184 0 $0 APPLICATIONS DENIED 7 $207,450 49 $199,558 136 $184,517 21 $102,014 0 $0 38 $206,685 4 $61,238 APPLICATIONS WITHDRAWN 14 $203,326 37 $197,290 77 $175,010 5 $132,724 0 $0 17 $181,821 1 $112,000 FILES CLOSED FOR INCOMPLETENESS 2 $132,460 2 $122,500 13 $235,427 1 $167,380 0 $0 2 $246,150 0 $0
Aggregated Statistics For Year 2006(Based on 2 full tracts) A) FHA, FSA/RHS & VA B) Conventional C) Refinancings D) Home Improvement Loans E) Loans on Dwellings For 5+ Families F) Non-occupant Loans on G) Loans On Manufactured Number Average Value Number Average Value Number Average Value Number Average Value Number Average Value Number Average Value Number Average Value
LOANS ORIGINATED 50 $216,714 195 $157,648 201 $169,926 27 $60,515 1 $684,300 53 $162,761 1 $5,000 APPLICATIONS APPROVED, NOT ACCEPTED 3 $250,547 22 $163,476 26 $194,470 3 $70,270 0 $0 5 $176,140 1 $112,240 APPLICATIONS DENIED 7 $180,973 70 $164,917 109 $182,892 39 $62,537 0 $0 31 $159,450 0 $0 APPLICATIONS WITHDRAWN 7 $185,669 46 $161,655 60 $162,892 7 $57,140 1 $196,920 18 $152,283 0 $0 FILES CLOSED FOR INCOMPLETENESS 0 $0 2 $256,500 14 $167,745 2 $71,875 0 $0 1 $109,290 0 $0
Aggregated Statistics For Year 2005(Based on 2 full tracts) A) FHA, FSA/RHS & VA B) Conventional C) Refinancings D) Home Improvement Loans E) Loans on Dwellings For 5+ Families F) Non-occupant Loans on G) Loans On Manufactured Number Average Value Number Average Value Number Average Value Number Average Value Number Average Value Number Average Value Number Average Value
LOANS ORIGINATED 106 $195,021 309 $159,758 230 $150,942 32 $90,809 1 $3,280,000 55 $159,321 4 $110,085 APPLICATIONS APPROVED, NOT ACCEPTED 2 $203,320 36 $187,545 38 $160,276 6 $31,067 0 $0 9 $161,912 0 $0 APPLICATIONS DENIED 2 $167,875 49 $157,554 123 $161,529 38 $58,745 0 $0 16 $101,370 4 $53,712 APPLICATIONS WITHDRAWN 8 $161,229 33 $184,086 83 $164,977 10 $45,604 0 $0 5 $226,458 0 $0 FILES CLOSED FOR INCOMPLETENESS 0 $0 6 $169,193 22 $179,511 4 $99,690 0 $0 3 $156,880 0 $0
Aggregated Statistics For Year 2004(Based on 2 full tracts) A) FHA, FSA/RHS & VA B) Conventional C) Refinancings D) Home Improvement Loans E) Loans on Dwellings For 5+ Families F) Non-occupant Loans on G) Loans On Manufactured Number Average Value Number Average Value Number Average Value Number Average Value Number Average Value Number Average Value Number Average Value
LOANS ORIGINATED 97 $178,694 251 $165,896 207 $152,047 20 $43,119 2 $210,210 81 $167,545 0 $0 APPLICATIONS APPROVED, NOT ACCEPTED 2 $208,575 25 $177,829 29 $136,492 2 $19,690 0 $0 8 $170,552 1 $24,610 APPLICATIONS DENIED 5 $168,244 33 $149,859 91 $131,390 34 $54,150 0 $0 17 $107,958 2 $33,970 APPLICATIONS WITHDRAWN 11 $138,071 40 $160,244 44 $135,565 6 $66,063 0 $0 10 $167,065 0 $0 FILES CLOSED FOR INCOMPLETENESS 1 $179,200 2 $145,720 19 $129,368 3 $32,820 0 $0 4 $116,695 0 $0
Detailed HMDA statistics for the following Tracts:
0008.00
, 0009.00
Private Mortgage Insurance Companies Aggregated Statistics For Year 2009(Based on 2 full tracts) A) Conventional B) Refinancings C) Non-occupant Loans on Number Average Value Number Average Value Number Average Value
LOANS ORIGINATED 6 $177,112 6 $192,465 1 $107,000 APPLICATIONS APPROVED, NOT ACCEPTED 2 $249,595 2 $184,120 0 $0 APPLICATIONS DENIED 3 $325,903 3 $258,620 0 $0 APPLICATIONS WITHDRAWN 1 $350,520 1 $264,860 0 $0 FILES CLOSED FOR INCOMPLETENESS 0 $0 1 $264,860 0 $0
Aggregated Statistics For Year 2008(Based on 2 full tracts) A) Conventional B) Refinancings C) Non-occupant Loans on Number Average Value Number Average Value Number Average Value
LOANS ORIGINATED 24 $197,860 15 $226,972 0 $0 APPLICATIONS APPROVED, NOT ACCEPTED 4 $175,448 3 $374,943 1 $184,000 APPLICATIONS DENIED 0 $0 2 $308,530 1 $188,060 APPLICATIONS WITHDRAWN 1 $189,000 0 $0 0 $0 FILES CLOSED FOR INCOMPLETENESS 0 $0 0 $0 0 $0
Aggregated Statistics For Year 2007(Based on 2 full tracts) A) Conventional B) Refinancings C) Non-occupant Loans on Number Average Value Number Average Value Number Average Value
LOANS ORIGINATED 43 $200,200 20 $233,225 7 $168,007 APPLICATIONS APPROVED, NOT ACCEPTED 4 $142,308 2 $225,835 2 $156,000 APPLICATIONS DENIED 0 $0 0 $0 0 $0 APPLICATIONS WITHDRAWN 2 $264,500 1 $256,980 0 $0 FILES CLOSED FOR INCOMPLETENESS 0 $0 0 $0 0 $0
Aggregated Statistics For Year 2006(Based on 2 full tracts) A) Conventional B) Refinancings C) Non-occupant Loans on Number Average Value Number Average Value Number Average Value
LOANS ORIGINATED 38 $188,687 23 $180,447 4 $167,628 APPLICATIONS APPROVED, NOT ACCEPTED 2 $294,050 1 $145,720 1 $377,100 APPLICATIONS DENIED 0 $0 0 $0 0 $0 APPLICATIONS WITHDRAWN 0 $0 1 $274,000 0 $0 FILES CLOSED FOR INCOMPLETENESS 0 $0 0 $0 0 $0
Aggregated Statistics For Year 2005(Based on 2 full tracts) A) Conventional B) Refinancings C) Non-occupant Loans on Number Average Value Number Average Value Number Average Value
LOANS ORIGINATED 65 $198,260 40 $176,060 7 $187,863 APPLICATIONS APPROVED, NOT ACCEPTED 8 $217,169 7 $204,364 1 $206,770 APPLICATIONS DENIED 0 $0 0 $0 0 $0 APPLICATIONS WITHDRAWN 2 $202,575 3 $145,667 0 $0 FILES CLOSED FOR INCOMPLETENESS 0 $0 0 $0 0 $0
Aggregated Statistics For Year 2004(Based on 2 full tracts) A) Conventional B) Refinancings C) Non-occupant Loans on D) Loans On Manufactured Number Average Value Number Average Value Number Average Value Number Average Value
LOANS ORIGINATED 72 $173,093 28 $150,200 18 $164,587 1 $147,690 APPLICATIONS APPROVED, NOT ACCEPTED 7 $179,796 13 $180,328 4 $177,960 0 $0 APPLICATIONS DENIED 1 $158,520 0 $0 0 $0 0 $0 APPLICATIONS WITHDRAWN 0 $0 0 $0 0 $0 0 $0 FILES CLOSED FOR INCOMPLETENESS 0 $0 1 $142,770 0 $0 0 $0
Detailed PMIC statistics for the following Tracts:
0008.00
, 0009.00 Fire-safe hotels and motels in Wasilla, Alaska:
Best Western Lake Lucille Inn, 1300 W Lk Lucille Dr, Wasilla, Alaska 99654 Phone: (907) 373-1776, Fax: (907) 376-6199
Agate Inn, 4725 Begich Cir, Wasilla, Alaska 99654 Phone: (907) 373-2290
Alaska's Select Inn Wasilla, 3451 Palmdale Dr, Wasilla, Alaska 99654 Phone: (907) 357-4768, Fax: (907) 376-0875
All 3 fire-safe hotels and motels in Wasilla, Alaska
Most common first names in Wasilla, AK among deceased individuals Name Count Lived (average)
James 53 67.6 years Robert 49 71.5 years William 43 69.3 years John 42 68.5 years Charles 32 69.1 years Mary 29 73.4 years George 29 73.5 years Richard 25 65.8 years David 22 58.6 years Dorothy 22 80.0 years
Most common last names in Wasilla, AK among deceased individuals Last name Count Lived (average)
Smith 28 73.0 years Johnson 26 71.6 years Anderson 11 65.2 years Nelson 10 77.2 years Miller 9 66.4 years Brown 9 73.2 years Adams 8 64.4 years Jones 8 72.9 years Scott 7 64.7 years Robinson 7 67.2 years
Wasilla compared to Alaska state average:
Black race population percentage below state average. Length of stay since moving in significantly above state average. House age below state average.
#16 on the list of "Top 101 cities with the most full-time local library workers per 1000 residents (population 5,000+)"
#37 on the list of "Top 101 cities with the most full-time park and recreation workers per 1000 residents (population 5,000+)"
#98 on the list of "Top 101 cities with the most full-time financial administration workers per 1000 residents (population 5,000+)"
#14 on the list of "Top 101 counties with the lowest total withdrawal of fresh water for public supply (pop. 50,000+)"
#43 on the list of "Top 101 counties with the largest number of people moving in compared to moving out (pop. 50,000+)"
#45 on the list of "Top 101 counties with the lowest number of deaths per 1000 residents 2007-2013 (pop. 50,000+)"
#52 on the list of "Top 101 counties with the lowest Particulate Matter (PM2.5 ) Annual air pollution readings in 2012 (µg/m3 )"
#74 on the list of "Top 101 counties with the lowest Particulate Matter (PM10 ) Annual air pollution readings in 2012 (µg/m3 )"
Top Patent Applicants
Kelly Lucas (6)
Joe E. Hess (3)
Paul A. Skvorc, Ii (2)
Cecil Logan Ellsworth (2)
Paul Anthony Skvorc, Ii (2)
Curtis G. Blount (1)
Leif M. Jensen (1)
William D. Rauchenstein (1)
Lowell Perry (1)
Sean Mcdowell (1)
Total of 37 patent applications in 2008-2024.
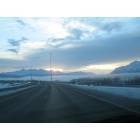
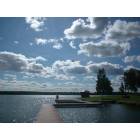
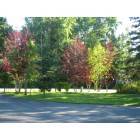
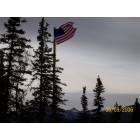


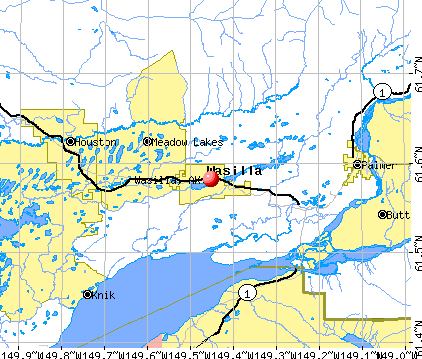


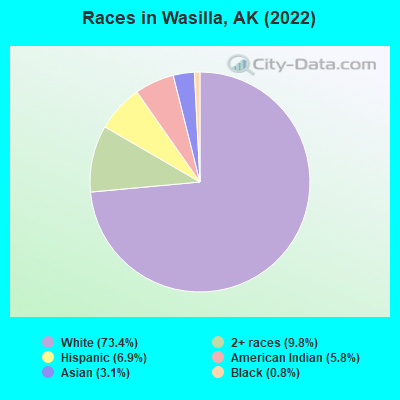
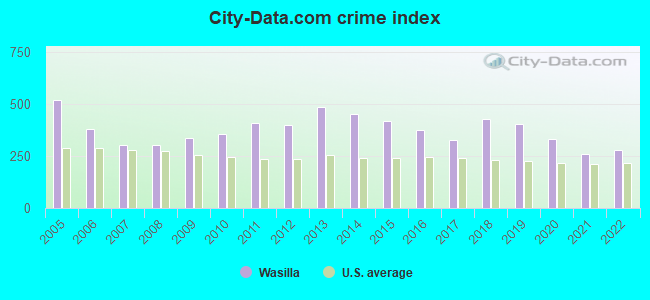
 Recent articles from our blog. Our writers, many of them Ph.D. graduates or candidates, create easy-to-read articles on a wide variety of topics.


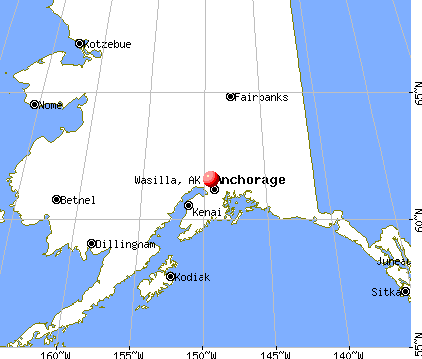
 (28.8 miles
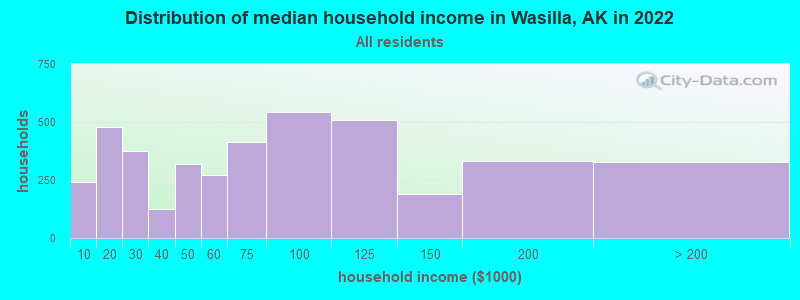

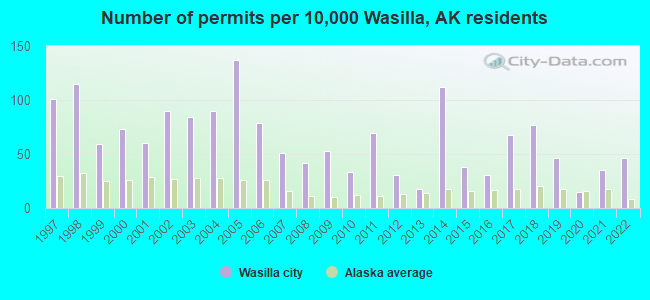
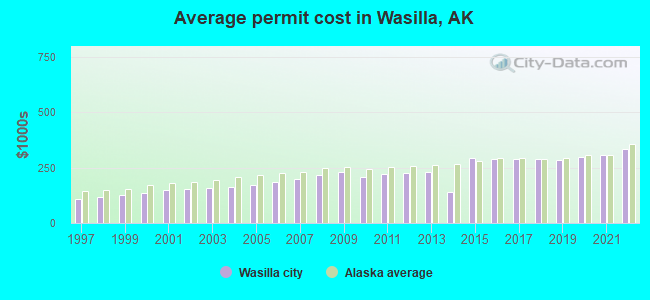
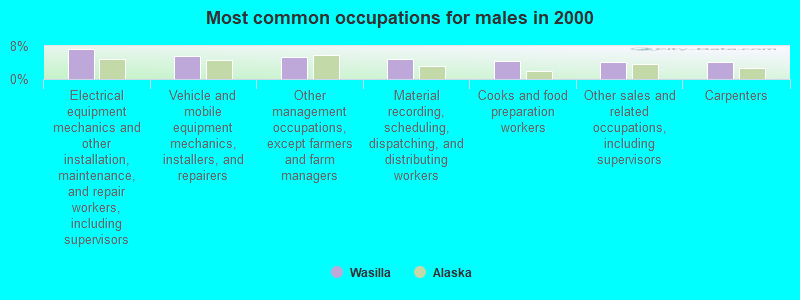
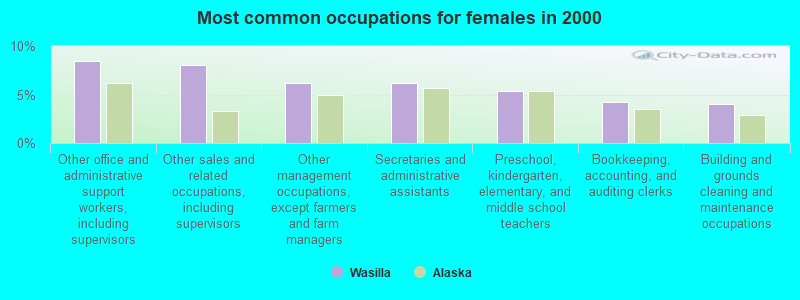
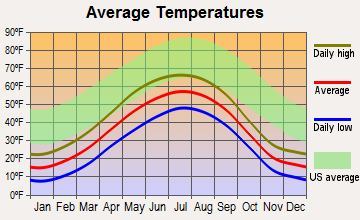
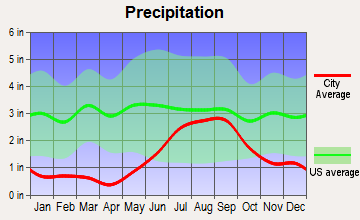
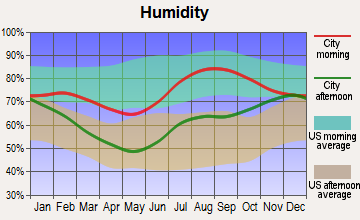
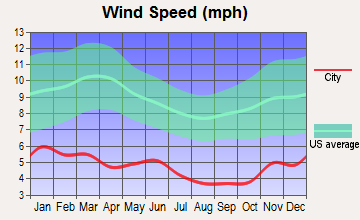


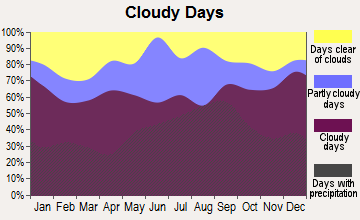


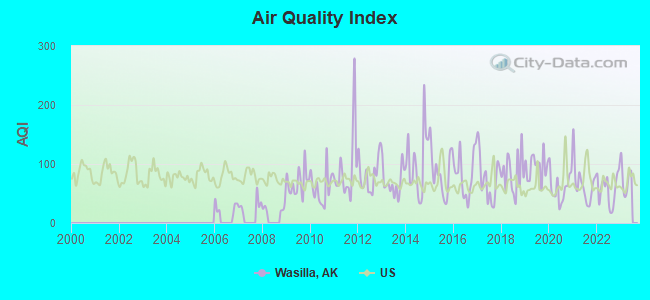
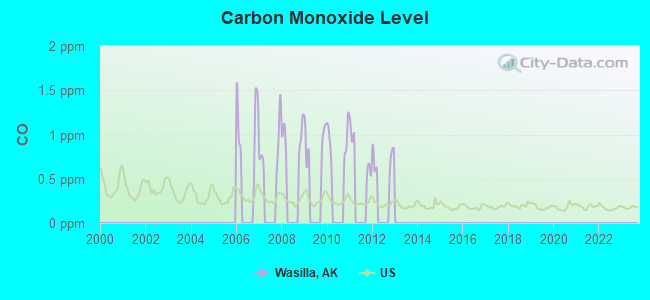
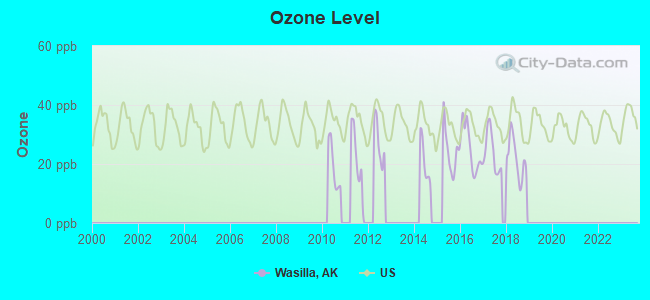
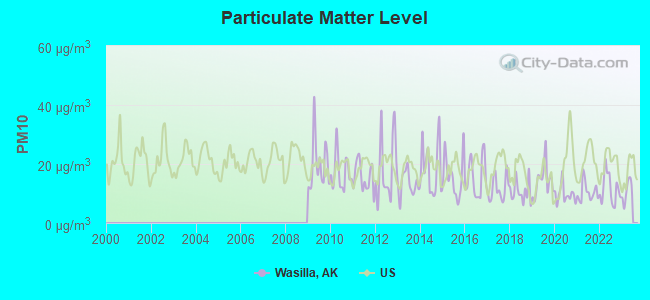
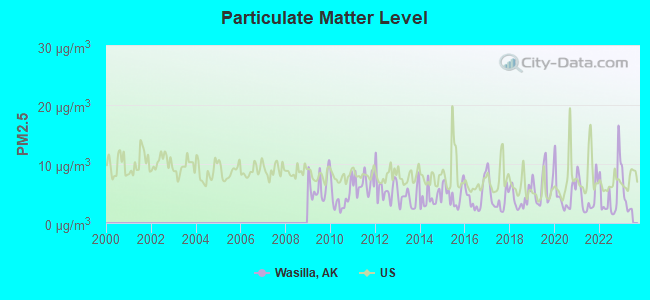

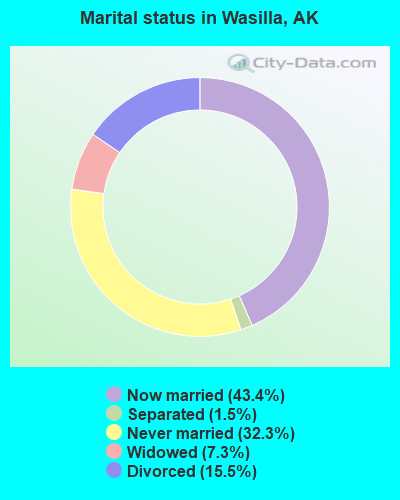
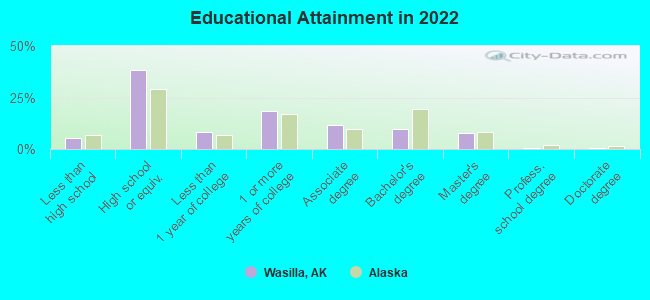
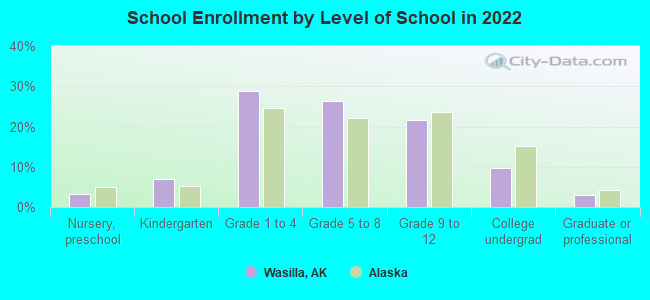
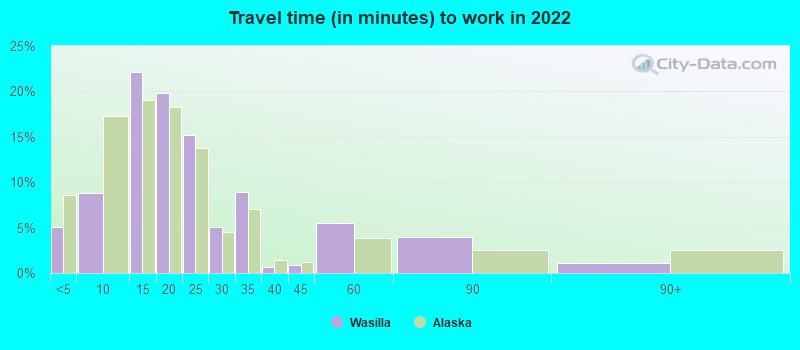
 Based on the data from the years 2002 - 2018 the average number of fire incidents per year is 194. The highest number of reported fires - 284 took place in 2003, and the least - 137 in 2007. The data has a rising trend.
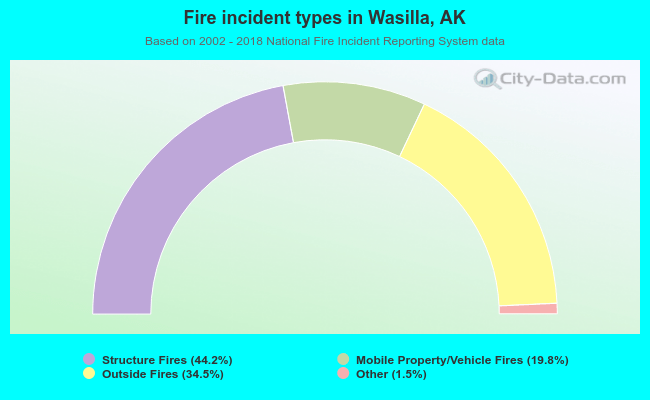 When looking into fire subcategories, the most incidents belonged to: Structure Fires (44.2%), and Outside Fires (34.5%).