West Imperial, California
Submit your own pictures of this place and show them to the world
- OSM Map
- General Map
- Google Map
- MSN Map

| Males: 6,686 | |
| Females: 1,579 |
| Median resident age: | 34.3 years |
| California median age: | 33.3 years |
| West Imperial: | $35,722 |
| CA: | $91,551 |
Estimated per capita income in 2022: $27,069 (it was $15,208 in 2000)
West Imperial CCD income, earnings, and wages data
Estimated median house or condo value in 2022: $170,669 (it was $54,600 in 2000)
| West Imperial: | $170,669 |
| CA: | $715,900 |
Mean prices in 2022: all housing units: $267,501; detached houses: $287,824; townhouses or other attached units: $339,294; in 2-unit structures: $153,064; in 3-to-4-unit structures: $163,407; in 5-or-more-unit structures: $239,638; mobile homes: $72,491; occupied boats, rvs, vans, etc.: $99,236
Detailed information about poverty and poor residents in West Imperial, CA
Compare current foreclosures near West Imperial, CA:
| Photo | Address | Area | Beds / Baths | Price | Details |
|---|---|---|---|---|---|

|
#1
Sand Knoll Ave
Thermal, CA 92274
|
- sq. feet
|
- baths - beds |
show details | |

|
#2
Indian Ocean Ave
Thermal, CA 92274
|
- sq. feet
|
- baths - beds |
show details | |

|
#3
China Sea Ave
Thermal, CA 92274
|
- sq. feet
|
- baths - beds |
show details | |

|
Check over 1 million property listings on Foreclosure.com!
|
browse all offers | |||

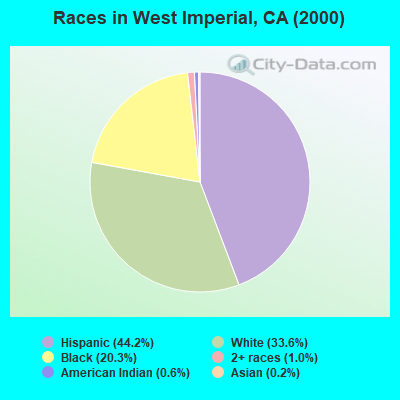
- 3,24244.2%Hispanic
- 2,46833.6%White alone
- 1,48920.3%Black alone
- 751.0%Two or more races
- 410.6%American Indian alone
- 170.2%Asian alone
- 40.05%Native Hawaiian and Other
Pacific Islander alone - 30.04%Other race alone
 Recent articles from our blog. Our writers, many of them Ph.D. graduates or candidates, create easy-to-read articles on a wide variety of topics.

Current Local Time: PST time zone
Land area: 979.6 square miles.
Population density: 8.4 people per square mile (very low).

| West Imperial CCD: | 0.9% ($484) |
| California: | 0.8% ($1,564) |
Nearest city with pop. 50,000+: Coachella Valley, CA  (31.0 miles , pop. 118,932).
Nearest city with pop. 200,000+: San Diego, CA (76.2 miles , pop. 1,223,400).
Nearest cities:
), ), Latitude: 33.24 N, Longitude: 115.95 W

| Here: | 18.3% |
| California: | 5.1% |
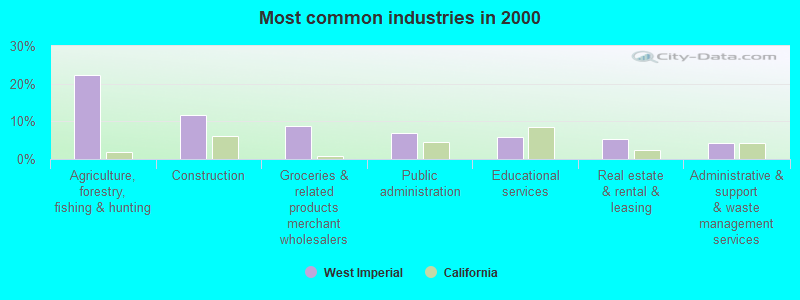
- Agriculture, forestry, fishing & hunting (22.3%)
- Construction (11.7%)
- Groceries & related products merchant wholesalers (8.8%)
- Public administration (7.0%)
- Educational services (5.9%)
- Real estate & rental & leasing (5.4%)
- Administrative & support & waste management services (4.2%)
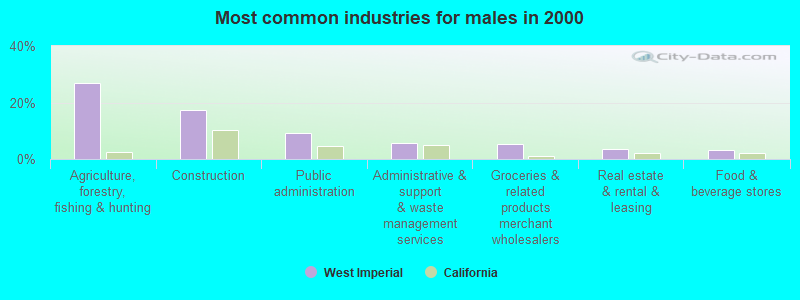
- Agriculture, forestry, fishing & hunting (27.0%)
- Construction (17.2%)
- Public administration (9.2%)
- Administrative & support & waste management services (5.8%)
- Groceries & related products merchant wholesalers (5.2%)
- Real estate & rental & leasing (3.4%)
- Food & beverage stores (3.2%)
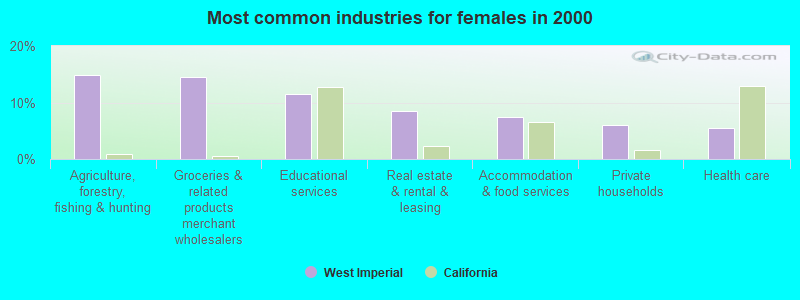
- Agriculture, forestry, fishing & hunting (14.9%)
- Groceries & related products merchant wholesalers (14.6%)
- Educational services (11.5%)
- Real estate & rental & leasing (8.5%)
- Accommodation & food services (7.5%)
- Private households (6.1%)
- Health care (5.4%)
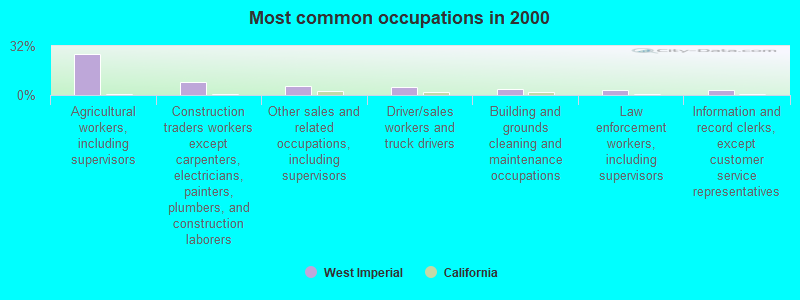
- Agricultural workers, including supervisors (27.1%)
- Construction traders workers except carpenters, electricians, painters, plumbers, and construction laborers (8.3%)
- Other sales and related occupations, including supervisors (5.7%)
- Driver/sales workers and truck drivers (5.1%)
- Building and grounds cleaning and maintenance occupations (3.9%)
- Law enforcement workers, including supervisors (3.5%)
- Information and record clerks, except customer service representatives (3.5%)
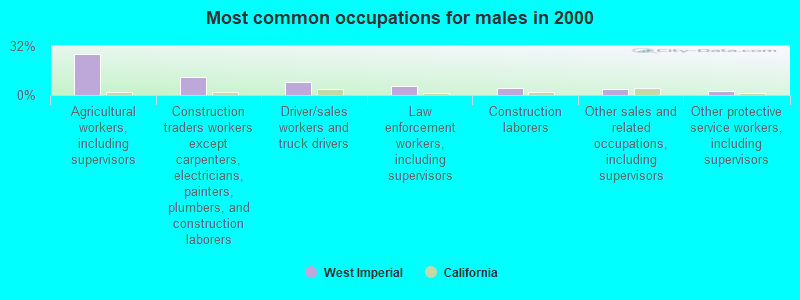
- Agricultural workers, including supervisors (26.8%)
- Construction traders workers except carpenters, electricians, painters, plumbers, and construction laborers (11.6%)
- Driver/sales workers and truck drivers (8.4%)
- Law enforcement workers, including supervisors (5.8%)
- Construction laborers (4.3%)
- Other sales and related occupations, including supervisors (3.6%)
- Other protective service workers, including supervisors (2.8%)
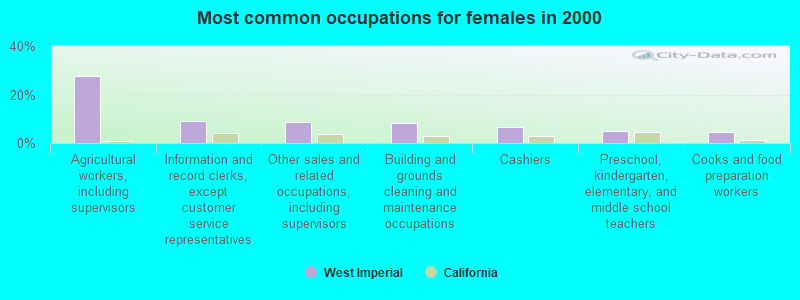
- Agricultural workers, including supervisors (27.5%)
- Information and record clerks, except customer service representatives (9.2%)
- Other sales and related occupations, including supervisors (8.8%)
- Building and grounds cleaning and maintenance occupations (8.1%)
- Cashiers (6.4%)
- Preschool, kindergarten, elementary, and middle school teachers (4.7%)
- Cooks and food preparation workers (4.4%)
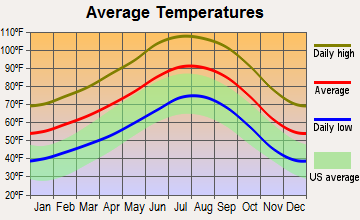
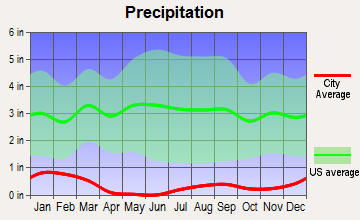
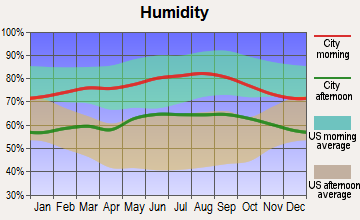
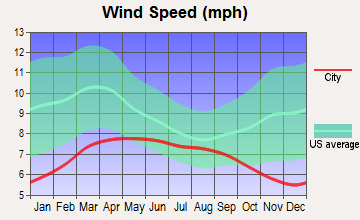
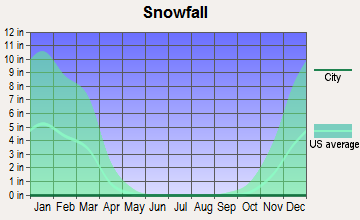
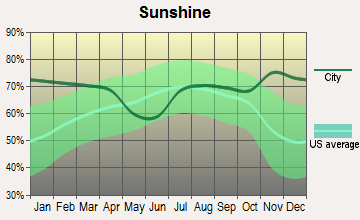
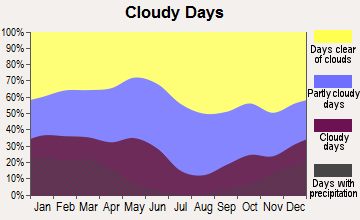
Average climate in West Imperial, California
Based on data reported by over 4,000 weather stations
(lower is better)
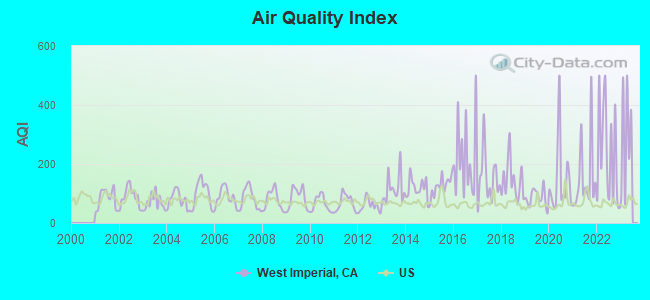
Air Quality Index (AQI) level in 2022 was 236. This is significantly worse than average.
| City: | 236 |
| U.S.: | 73 |
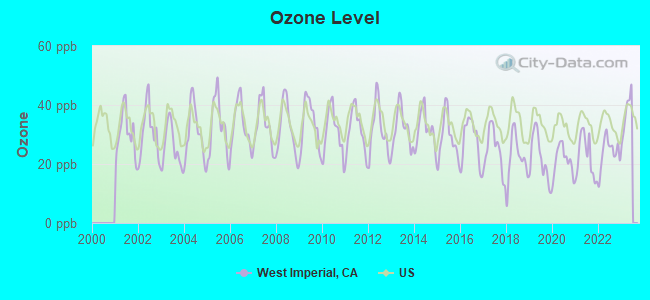
Ozone [ppb] level in 2022 was 24.0. This is better than average. Closest monitor was 11.2 miles away from the city center.
| City: | 24.0 |
| U.S.: | 33.3 |
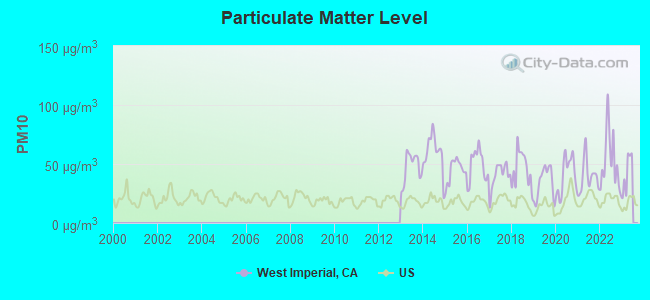
Particulate Matter (PM10) [µg/m3] level in 2022 was 52.3. This is significantly worse than average. Closest monitor was 10.6 miles away from the city center.
| City: | 52.3 |
| U.S.: | 19.2 |
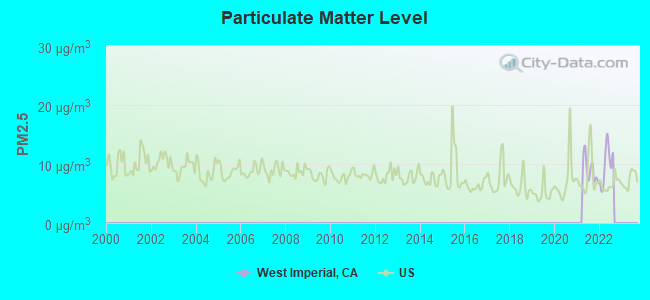
Particulate Matter (PM2.5) [µg/m3] level in 2022 was 9.84. This is worse than average. Closest monitor was 10.6 miles away from the city center.
| City: | 9.84 |
| U.S.: | 8.11 |
Earthquake activity:
West Imperial-area historical earthquake activity is significantly above California state average. It is 6113% greater than the overall U.S. average.On 6/28/1992 at 11:57:34, a magnitude 7.6 (6.2 MB, 7.6 MS, 7.3 MW, Depth: 0.7 mi, Class: Major, Intensity: VIII - XII) earthquake occurred 73.6 miles away from West Imperial center, causing 3 deaths (1 shaking deaths, 2 other deaths) and 400 injuries, causing $100,000,000 total damage and $40,000,000 insured losses
On 5/19/1940 at 04:36:40, a magnitude 7.2 (7.2 UK) earthquake occurred 14.7 miles away from West Imperial center, causing $33,000,000 total damage
On 10/16/1999 at 09:46:44, a magnitude 7.4 (6.3 MB, 7.4 MS, 7.2 MW, 7.3 ML) earthquake occurred 92.8 miles away from the city center
On 12/31/1934 at 18:45:56, a magnitude 7.1 (7.1 UK) earthquake occurred 39.6 miles away from the city center
On 10/15/1979 at 23:16:54, a magnitude 7.0 (5.7 MB, 6.9 MS, 7.0 ML, 6.4 MW) earthquake occurred 34.2 miles away from West Imperial center
On 7/21/1952 at 11:52:14, a magnitude 7.7 (7.7 UK) earthquake occurred 213.0 miles away from the city center, causing $50,000,000 total damage
Magnitude types: body-wave magnitude (MB), local magnitude (ML), surface-wave magnitude (MS), moment magnitude (MW)
Natural disasters:
The number of natural disasters in Imperial County (10) is smaller than the US average (15).Major Disasters (Presidential) Declared: 8
Emergencies Declared: 1
Causes of natural disasters: Floods: 5, Winter Storms: 3, Earthquakes: 2, Landslides: 2, Freeze: 1, Hurricane: 1, Storm: 1, Tropical Storm: 1, Other: 1 (Note: some incidents may be assigned to more than one category).
Colleges/universities with over 2000 students nearest to West Imperial:
- Imperial Valley College (about 39 miles; Imperial, CA; Full-time enrollment: 5,313)
- College of the Desert (about 43 miles; Palm Desert, CA; FT enrollment: 5,686)
- Cuyamaca College (about 67 miles; El Cajon, CA; FT enrollment: 4,270)
- Grossmont College (about 68 miles; El Cajon, CA; FT enrollment: 10,461)
- California State University-San Marcos (about 71 miles; San Marcos, CA; FT enrollment: 8,070)
- Alliant International University (about 71 miles; San Diego, CA; FT enrollment: 3,155)
- Mt San Jacinto Community College District (about 71 miles; San Jacinto, CA; FT enrollment: 8,426)
Points of interest:
Notable locations in West Imperial: Salton Sea Service Station (A), Old Carrizo Stage Station (B), Salton Sea Beach Marina (C), Salton Golf Course (D), Ocotillo Community Center (E), Ocotillo Branch Imperial County Free Library (F), West Shore Ambulance Service (G), Salton Sea Beach Volunteer Fire Department (H), Centinela State Prison Fire Department (I), Imperial County Fire Department Station 6 (J). Display/hide their locations on the map
Lake: Salton Sea (A). Display/hide its location on the map
Streams, rivers, and creeks: Gravel Wash (A), Grave Wash (B), Gert Wash (C), Fish Creek Wash (D), Coyote Wash (E), Coral Wash (F), Campbell Wash (G), Boulder Creek (H), Biloxi Wash (I). Display/hide their locations on the map
Parks in West Imperial include: Imperial Highway Monument (1), Stage Station Historical Marker (2), Vista De Anza Historical Marker (3). Display/hide their locations on the map
Beaches: Sandy Beach (A), Sea View Beach (B). Display/hide their locations on the map
| This place: | 2.9 people |
| California: | 2.9 people |
| This place: | 67.7% |
| Whole state: | 68.7% |
| This place: | 6.5% |
| Whole state: | 7.2% |
Likely homosexual households (counted as self-reported same-sex unmarried-partner households)
- Lesbian couples: 0.3% of all households
- Gay men: 0.5% of all households
| This place: | 21.3% |
| Whole state: | 14.2% |
| This place: | 11.0% |
| Whole state: | 6.3% |
4,472 people in state prisons in 2000
For population 15 years and over in West Imperial:
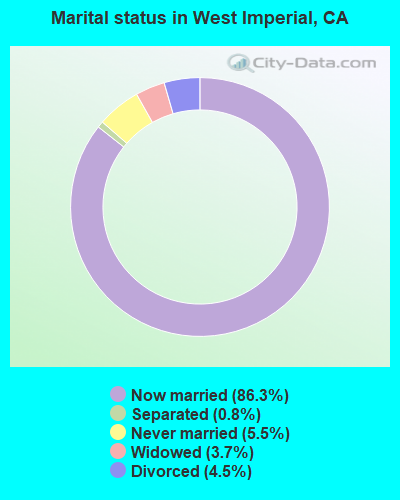
- Never married: 5.5%
- Now married: 86.3%
- Separated: 0.8%
- Widowed: 3.7%
- Divorced: 4.5%
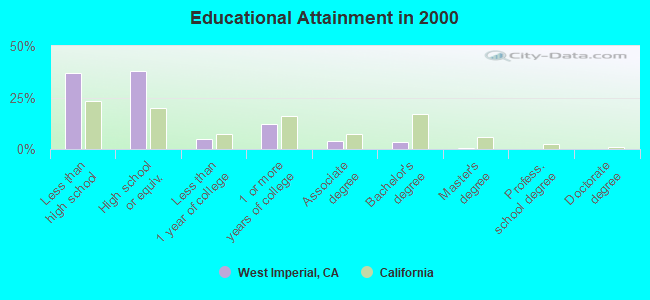
For population 25 years and over in West Imperial:
- High school or higher: 63.0%
- Bachelor's degree or higher: 4.1%
- Graduate or professional degree: 0.7%
- Unemployed: 10.5%
- Mean travel time to work (commute): 30.5 minutes
| Here: | 12.4 |
| California average: | 16.1 |
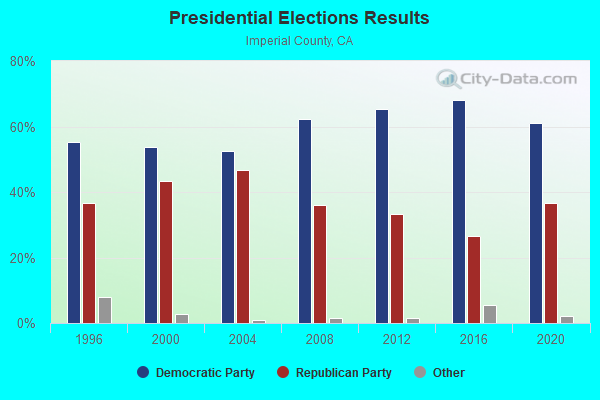
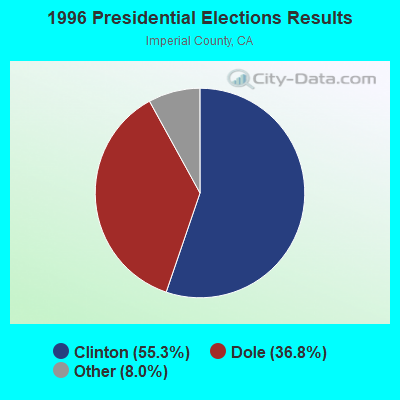
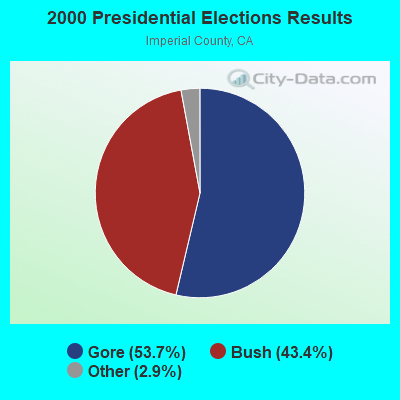
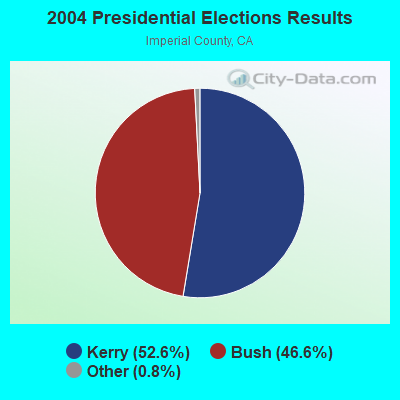
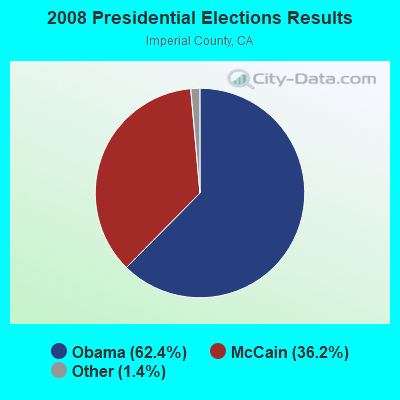
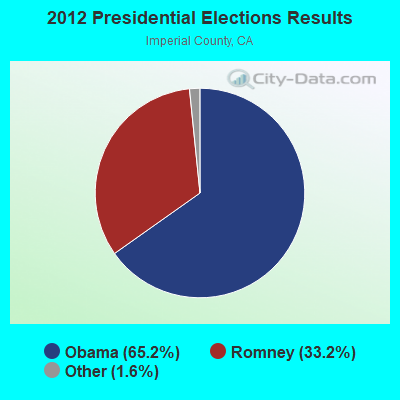
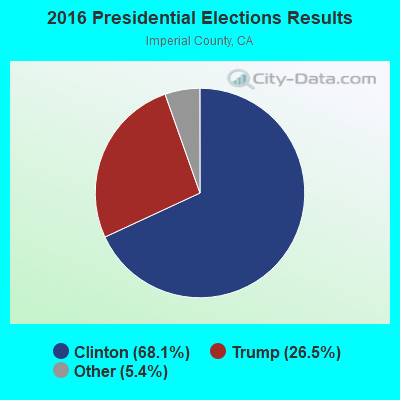
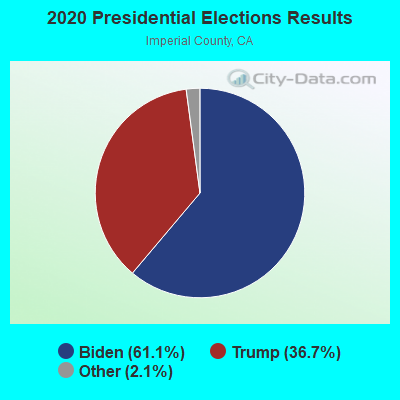
Graphs represent county-level data. Detailed 2008 Election Results
Religion statistics for West Imperial, CA (based on Imperial County data)
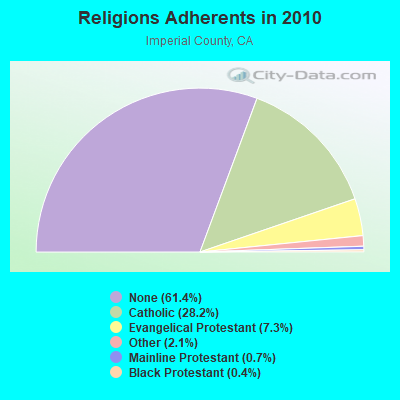
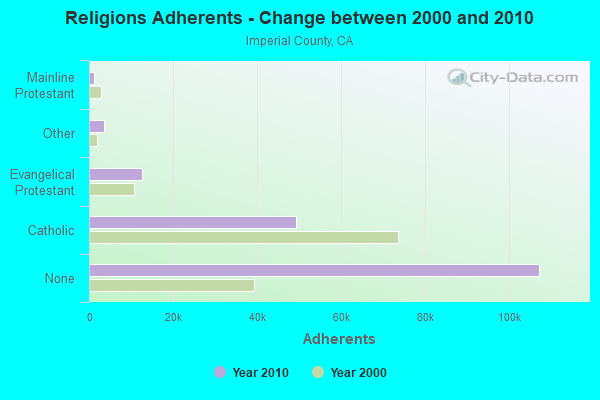
| Religion | Adherents | Congregations |
|---|---|---|
| Catholic | 49,226 | 12 |
| Evangelical Protestant | 12,707 | 80 |
| Other | 3,633 | 14 |
| Mainline Protestant | 1,137 | 12 |
| Black Protestant | 669 | 5 |
| None | 107,156 | - |
Food Environment Statistics:
| This county: | 2.49 / 10,000 pop. |
| California: | 2.14 / 10,000 pop. |
| This county: | 0.06 / 10,000 pop. |
| California: | 0.04 / 10,000 pop. |
| Imperial County: | 0.62 / 10,000 pop. |
| California: | 0.62 / 10,000 pop. |
| This county: | 3.23 / 10,000 pop. |
| State: | 1.49 / 10,000 pop. |
| Imperial County: | 4.85 / 10,000 pop. |
| California: | 7.42 / 10,000 pop. |
| Imperial County: | 6.9% |
| California: | 7.3% |
| Imperial County: | 25.4% |
| California: | 21.3% |
| Here: | 16.6% |
| State: | 17.9% |
Strongest AM radio stations in West Imperial:
- KFMB (760 AM; 50 kW; SAN DIEGO, CA; Owner: MIDWEST TELEVISION, INC.)
- KCBQ (1170 AM; 50 kW; SAN DIEGO, CA; Owner: RADIO 1210, INC.)
- KPLS (830 AM; 50 kW; ORANGE, CA; Owner: CRN LICENSES, LLC)
- KLAC (570 AM; 50 kW; LOS ANGELES, CA; Owner: AMFM RADIO LICENSES, L.L.C.)
- KFI (640 AM; 50 kW; LOS ANGELES, CA; Owner: CAPSTAR TX LIMITED PARTNERSHIP)
- KNWZ (970 AM; 5 kW; COACHELLA, CA; Owner: MCC RADIO, LLC)
- KNWQ (1140 AM; 10 kW; PALM SPRINGS, CA; Owner: MCC RADIO, LLC)
- KPRZ (1210 AM; 20 kW; SAN MARCOS, CA; Owner: RADIO 1210, INC.)
- KTNQ (1020 AM; 50 kW; LOS ANGELES, CA; Owner: KTNQ-AM LICENSE CORP.)
- KSPN (710 AM; 50 kW; LOS ANGELES, CA; Owner: KABC-AM RADIO, INC.)
- KXTA (1150 AM; 50 kW; LOS ANGELES, CA; Owner: CITICASTERS LICENSES, L.P.)
- KDIS (1110 AM; 50 kW; PASADENA, CA; Owner: ABC,INC.)
- KFWB (980 AM; 50 kW; LOS ANGELES, CA; Owner: INFINITY BROADCASTING OPERATIONS, INC.)
Strongest FM radio stations in West Imperial:
- KLVJ (100.1 FM; JULIAN, CA; Owner: EDUCATIONAL MEDIA FOUNDATION)
- KZAL (105.5 FM; DESERT CENTER, CA; Owner: WORLDWIDE MULTI-MEDIA B/C CO.)
- KLRD (90.1 FM; YUCAIPA, CA; Owner: EDUCATIONAL MEDIA FOUNDATION)
- KRTM (88.9 FM; TEMECULA, CA; Owner: PENFOLD COMMUNICATIONS, INC.)
- KSEH (94.5 FM; BRAWLEY, CA; Owner: ENTRAVISION HOLDINGS, LLC)
- KATY-FM (101.3 FM; IDYLLWILD, CA; Owner: ALL PRO BROADCASTING, INC.)
- KRCK-FM (97.7 FM; MECCA, CA; Owner: PLAYA DEL SOL BROADCASTERS)
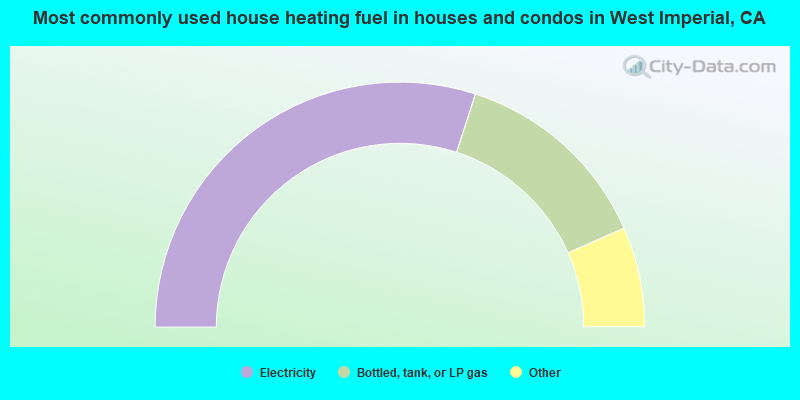
- 60.0%Electricity
- 26.8%Bottled, tank, or LP gas
- 3.4%No fuel used
- 3.3%Wood
- 3.2%Utility gas
- 3.2%Other fuel
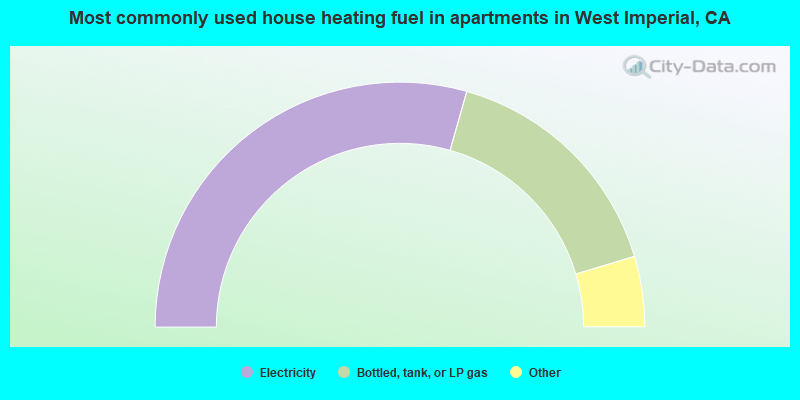
- 58.8%Electricity
- 31.9%Bottled, tank, or LP gas
- 4.0%Wood
- 3.1%Other fuel
- 2.2%No fuel used
West Imperial compared to California state average:
- Median household income significantly below state average.
- Median house value significantly below state average.
- Black race population percentage significantly above state average.
- Foreign-born population percentage significantly below state average.
- Length of stay since moving in significantly above state average.
- Number of rooms per house significantly below state average.
- House age significantly below state average.
- Institutionalized population percentage significantly above state average.
- Number of college students significantly below state average.
- Percentage of population with a bachelor's degree or higher significantly below state average.
West Imperial on our top lists:
- #1 on the list of "Top 101 cities with largest percentage of females in occupations: construction trades workers except carpenters, electricians, painters, plumbers, and construction laborers (population 5,000+)"
- #1 on the list of "Top 101 cities with largest percentage of males in industries: recyclable material merchant wholesalers (population 5,000+)"
- #2 on the list of "Top 101 cities with largest percentage of females in occupations: agricultural workers including supervisors (population 5,000+)"
- #2 on the list of "Top 101 cities with largest percentage of males in occupations: construction trades workers except carpenters, electricians, painters, plumbers, and construction laborers (population 5,000+)"
- #2 on the list of "Top 101 cities with largest percentage of females in industries: groceries and related products merchant wholesalers (population 5,000+)"
- #2 on the list of "Top 101 cities with largest percentage of females in industries: gasoline stations (population 5,000+)"
- #3 on the list of "Top 101 cities with largest percentage of males in industries: miscellaneous durable goods merchant wholesalers (population 5,000+)"
- #4 on the list of "Top 101 cities with largest percentage of males in occupations: agricultural workers including supervisors (population 5,000+)"
- #4 on the list of "Top 101 cities with largest percentage of females in industries: nonmetallic mineral products (population 5,000+)"
- #4 on the list of "Top 101 cities with largest percentage of females in industries: private households (population 5,000+)"
- #6 on the list of "Top 101 cities with largest percentage of males in occupations: plant and system operators (population 5,000+)"
- #7 on the list of "Top 101 cities with largest percentage of males in industries: groceries and related products merchant wholesalers (population 5,000+)"
- #12 on the list of "Top 100 most racially diverse cities (pop. 5,000+)"
- #12 on the list of "Top 101 cities with largest percentage of females in occupations: other sales and related workers including supervisors (population 5,000+)"
- #13 on the list of "Top 101 cities with the largest percentage of people in state prisons (population 1,000+)"
- #14 on the list of "Top 101 cities with largest percentage of males in industries: farm supplies merchant wholesalers (population 5,000+)"
- #14 on the list of "Top 101 cities with the most people taking a motorcycle to work (population 5,000+)"
- #18 on the list of "Top 101 cities with largest percentage of males in industries: used merchandise, gift, novelty, and souvenir, and other miscellaneous stores (population 5,000+)"
- #19 on the list of "Top 100 cities with the largest percentage of males (pop. 5,000+)"
- #29 on the list of "Top 101 cities with the most people carpooling to work (population 5,000+)"
- #1 on the list of "Top 101 counties with the highest lead air pollution readings in 2012 (µg/m3)"
- #8 on the list of "Top 101 counties with the highest Particulate Matter (PM10) Annual air pollution readings in 2012 (µg/m3)"
- #13 on the list of "Top 101 counties with the highest number of births per 1000 residents 2007-2013"
- #27 on the list of "Top 101 counties with the highest Particulate Matter (PM2.5) Annual air pollution readings in 2012 (µg/m3)"
- #37 on the list of "Top 101 counties with the largest decrease in the number of deaths per 1000 residents 2000-2006 to 2007-2013 (pop. 50,000+)"