Bollinger County, Missouri (MO)
County owner-occupied free and clear houses and condos in 2010: 1,861
County owner-occupied houses and condos in 2000: 3,732
Renter-occupied apartments: 935 (it was 844 in 2000)
| % of renters here: | 18% |
| State: | 31% |
Land area: 621 sq. mi.
Water area: 0.5 sq. mi.
Population density: 17 people per square mile (low).
Industries providing employment: Educational, health and social services (22.4%), Retail trade (16.9%), Manufacturing (16.1%), Construction (15.3%).
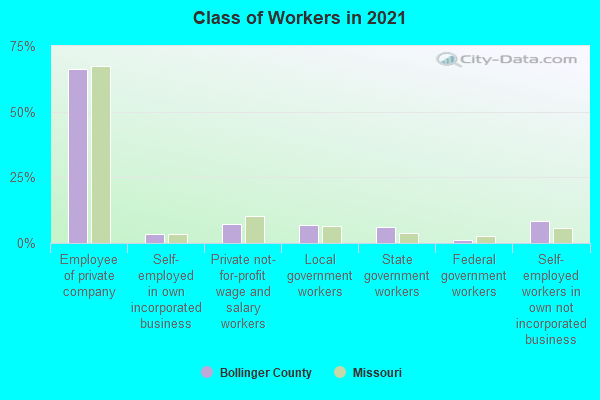
Type of workers:
- Private wage or salary: 82%
- Government: 12%
- Self-employed, not incorporated: 5%
- Unpaid family work: 0%
- OSM Map
- General Map
- Google Map
- MSN Map

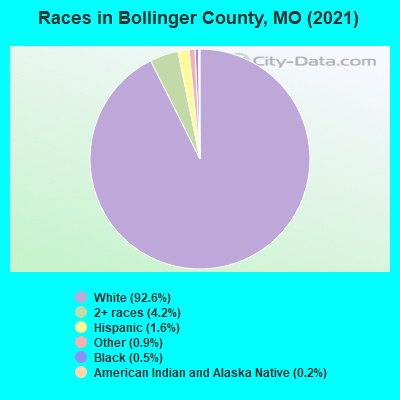
- 9,91792.8%White Non-Hispanic Alone
- 4284.0%Two or more races
- 1871.7%Hispanic or Latino
- 820.8%Some other race alone
- 560.5%Black Non-Hispanic Alone
- 160.1%American Indian and Alaska Native alone
- 60.06%Asian alone
| Median resident age: | 45.0 years |
| Missouri median age: | 39.1 years |
| Males: 5,310 | |
| Females: 5,388 |

 | Interesting Missouri facts. (1186 replies) |
| Missouri Outlaw History (3407 replies) |
| Where in Missouri does the South begin? (507 replies) |
| Why Is Missouri No Longer a Swing State? (186 replies) |
| Missouri...Southern or Midwestern? (1475 replies) |
| Location Suggestions in the Ozarks to start a family hobby farm (61 replies) |
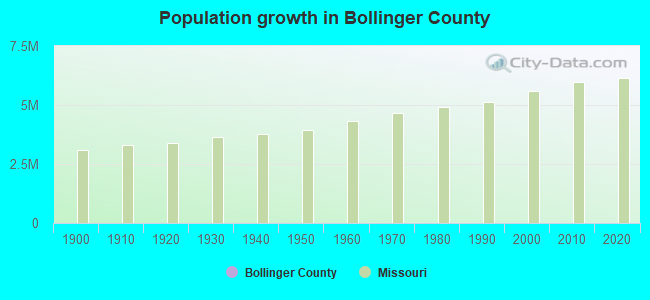
| Bollinger County: | 2.0 people |
| Missouri: | 2 people |
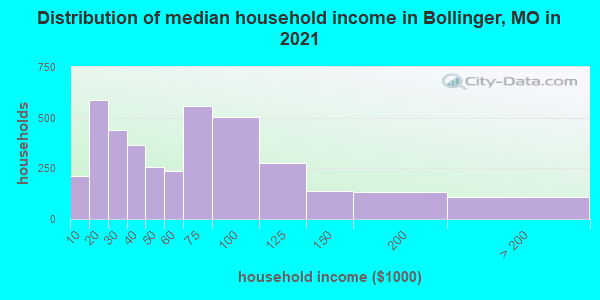
Estimated median household income in 2022: $51,426 ($30,462 in 1999)
| This county: | $51,426 |
| Missouri: | $64,811 |
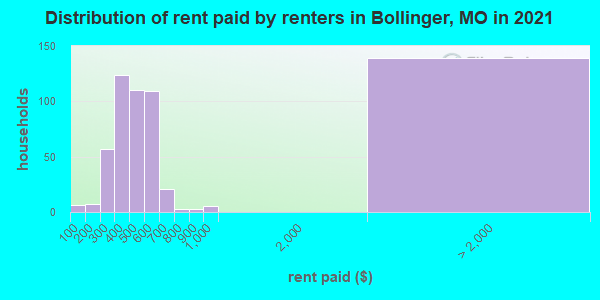
Median contract rent in 2022 for apartments: $463 (lower quartile is $329, upper quartile is $580)
| This county: | $463 |
| State: | $757 |
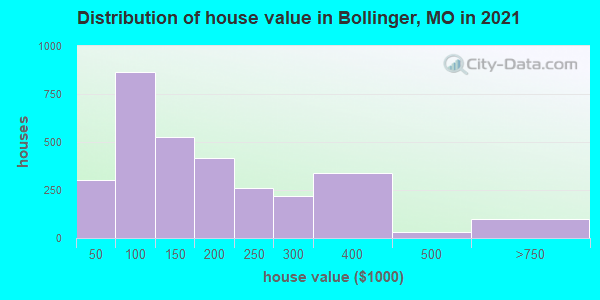
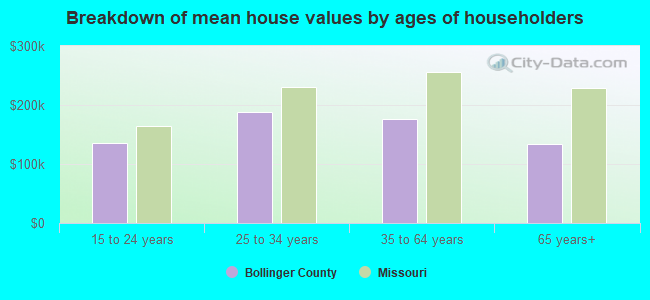
Estimated median house or condo value in 2022: $137,002 (it was $61,900 in 2000)
| Bollinger: | $137,002 |
| Missouri: | $221,200 |
Median monthly housing costs for homes and condos with a mortgage: $979
Median monthly housing costs for units without a mortgage: $366
Institutionalized population: 74
Crime in 2021 (reported by the sheriff's office or county police, not the county total):
- Murders: 1
- Rapes: 11
- Robberies: 0
- Assaults: 62
- Burglaries: 30
- Thefts: 28
- Auto thefts: 9
Crime in 2020 (reported by the sheriff's office or county police, not the county total):
- Murders: 0
- Rapes: 5
- Robberies: 0
- Assaults: 34
- Burglaries: 32
- Thefts: 40
- Auto thefts: 2
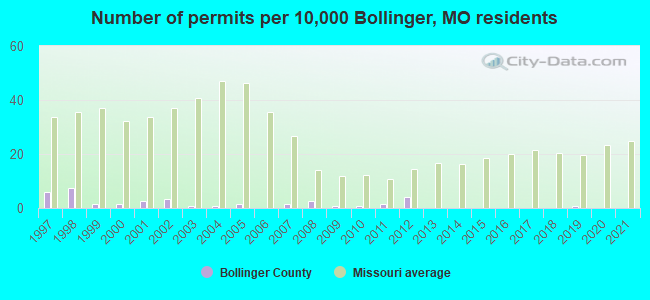
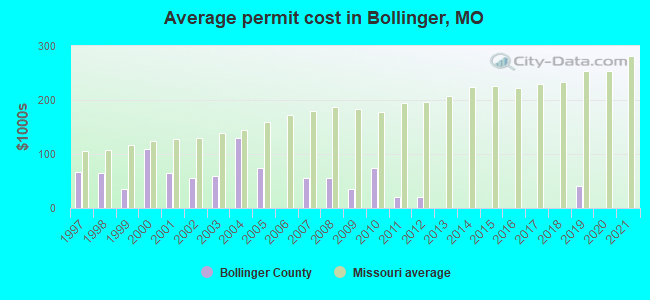
Single-family new house construction building permits:
- 2022: 0 buildings
- 2021: 0 buildings
- 2020: 0 buildings
- 2019: 1 building, cost: $40,000
- 2018: 0 buildings
- 2017: 0 buildings
- 2016: 0 buildings
- 2015: 0 buildings
- 2014: 0 buildings
- 2013: 0 buildings
- 2012: 5 buildings, average cost: $20,000
- 2011: 2 buildings, average cost: $20,000
- 2010: 1 building, cost: $75,000
- 2009: 1 building, cost: $35,000
- 2008: 3 buildings, average cost: $55,000
- 2007: 2 buildings, average cost: $55,000
- 2006: 0 buildings
- 2005: 2 buildings, average cost: $74,500
- 2004: 1 building, cost: $129,600
- 2003: 1 building, cost: $60,000
- 2002: 4 buildings, average cost: $55,000
- 2001: 3 buildings, average cost: $65,000
- 2000: 2 buildings, average cost: $108,600
- 1999: 2 buildings, average cost: $35,000
- 1998: 9 buildings, average cost: $63,900
- 1997: 7 buildings, average cost: $66,100
Median real estate property taxes paid for housing units with mortgages in 2022: $1,037 (0.6%)
Median real estate property taxes paid for housing units with no mortgage in 2022: $595 (0.5%)
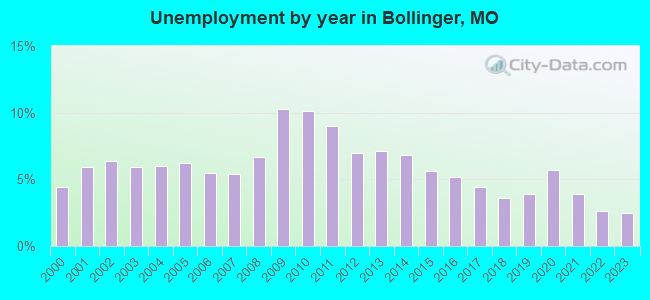
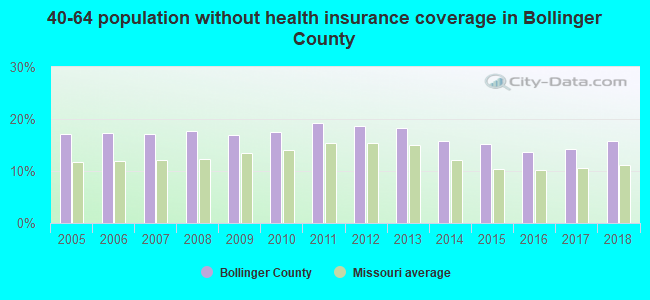
| Bollinger County: | 15.3% |
| Missouri: | 13.2% |
Median age of residents in 2022: 45.0 years old
(Males: 43.8 years old, Females: 45.5 years old)
(Median age for: White residents: 45.3 years old, Black residents: 42.7 years old, American Indian residents: 52.3 years old, Hispanic or Latino residents: 20.6 years old, Other race residents: 62.5 years old)
Fair market rent in 2006 for a 1-bedroom apartment in Bollinger County is $381 a month.
Fair market rent for a 2-bedroom apartment is $500 a month.
Fair market rent for a 3-bedroom apartment is $639 a month.
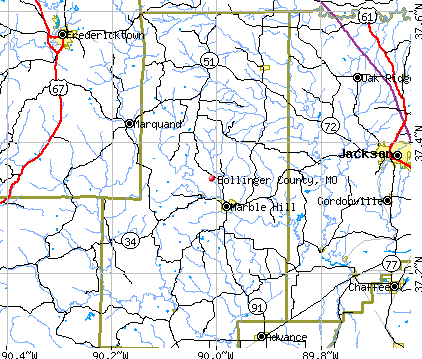
Cities in this county include: Marble Hill, Sedgewickville, Glen Allen, Zalma.
Neighboring counties: Chautauqua County, Kansas  , Cherokee County, Kansas , Marin County, California , Casey County, Kentucky
  , Nelson County, Kentucky , Taylor County, Kentucky , Lexington city, Virginia .
| Here: | 2.7% |
| Missouri: | 2.8% |
Current college students: 220
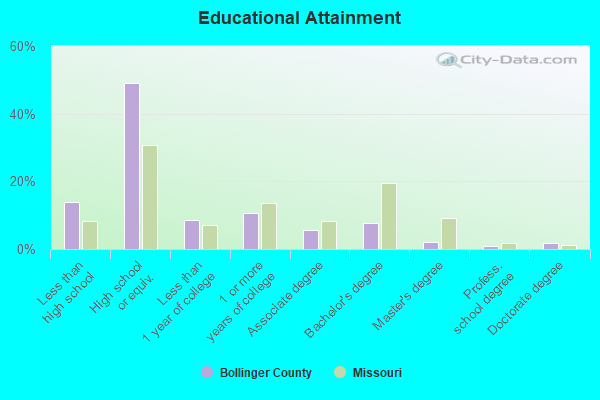
People 25 years of age or older with a high school degree or higher: 84.3%
People 25 years of age or older with a bachelor's degree or higher: 11.7%
Number of foreign born residents: 66 (87.2% naturalized citizens)
| Bollinger County: | 0.6% |
| Whole state: | 4.1% |
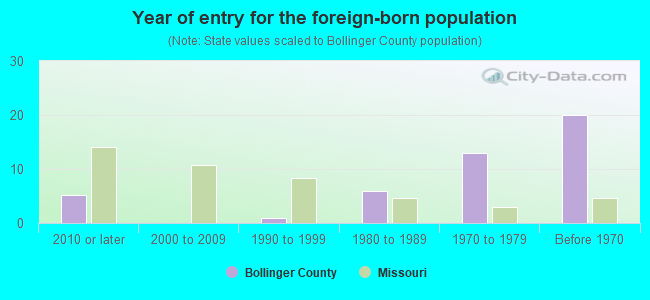
- Year of entry for the foreign-born population
- 92010 or later
- 02000 to 2009
- 11990 to 1999
- 61980 to 1989
- 131970 to 1979
- 20Before 1970
Mean travel time to work (commute): ! minutes
Percentage of county residents living and working in this county: 100.2%

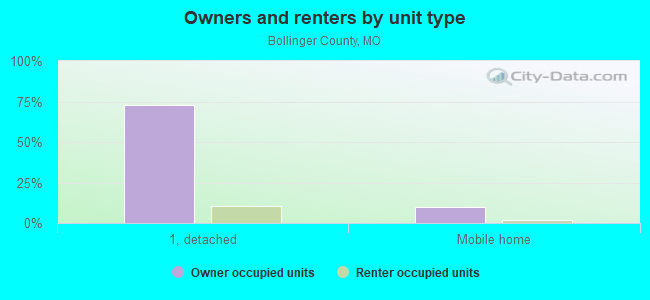
Housing units in structures:
- One, detached: 4,098
- One, attached: 22
- Two: 38
- 3 or 4: 41
- 5 to 9: 64
- 10 to 19: 22
- 20 to 49: 6
- 50 or more: 8
- Mobile homes: 780
Housing units in Bollinger County with a mortgage: 1,340 (75 second mortgage, 9 home equity loan, 60 both second mortgage and home equity loan)
Houses without a mortgage: 8
| Here: | 11.1% with mortgage |
| State: | 98.0% with mortgage |
Religion statistics for Bollinger County
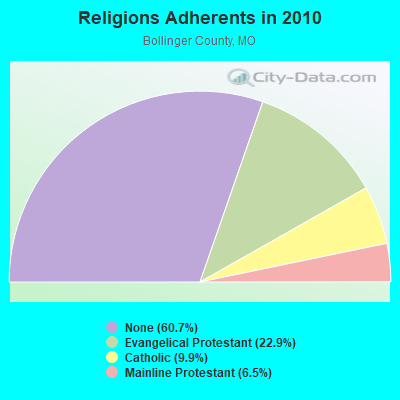
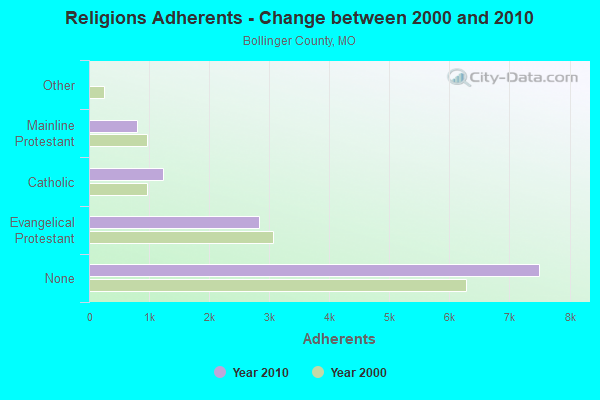
| Religion | Adherents | Congregations |
|---|---|---|
| Evangelical Protestant | 2,836 | 22 |
| Catholic | 1,225 | 2 |
| Mainline Protestant | 802 | 12 |
| Other | 1 | - |
| None | 7,499 | - |
Source: Clifford Grammich, Kirk Hadaway, Richard Houseal, Dale E.Jones, Alexei Krindatch, Richie Stanley and Richard H.Taylor. 2012. 2010 U.S.Religion Census: Religious Congregations & Membership Study. Association of Statisticians of American Religious Bodies. Jones, Dale E., et al. 2002. Congregations and Membership in the United States 2000. Nashville, TN: Glenmary Research Center.
Food Environment Statistics:
| Bollinger County: | 1.65 / 10,000 pop. |
| State: | 1.88 / 10,000 pop. |
| Bollinger County: | 7.43 / 10,000 pop. |
| Missouri: | 4.34 / 10,000 pop. |
| This county: | 4.95 / 10,000 pop. |
| State: | 7.37 / 10,000 pop. |
| Bollinger County: | 9.0% |
| Missouri: | 8.8% |
| Bollinger County: | 30.5% |
| State: | 29.6% |
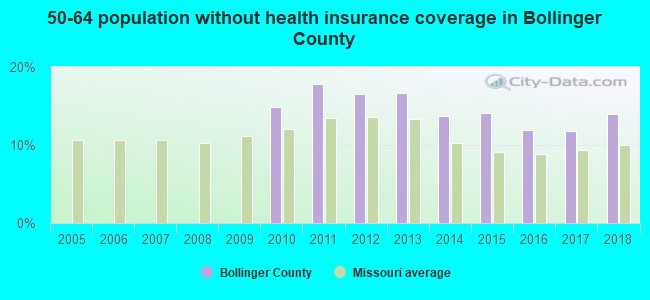
| Here: | 15.5% |
| State: | 13.5% |
Agriculture in Bollinger County:
Average size of farms: 250 acresAverage value of agricultural products sold per farm: $21,451
Average total farm production expenses per farm: $19,413
Harvested cropland as a percentage of land in farms: 31.69%
Average market value of all machinery and equipment per farm: $36,801
The percentage of farms operated by a family or individual: 93.65%
Average age of principal farm operators: 56 years
Average number of cattle and calves per 100 acres of all land in farms: 14.10
Milk cows as a percentage of all cattle and calves: 0.61%
Corn for grain: 10057 harvested acres
All wheat for grain: 2857 harvested acres
Soybeans for beans: 20279 harvested acres
Vegetables: 23 harvested acres
Land in orchards: 33 acres
Earthquake activity:
Bollinger County-area historical earthquake activity is significantly above Missouri state average. It is 384% greater than the overall U.S. average.On 9/26/1990 at 13:18:51, a magnitude 5.0 (4.7 MB, 4.8 LG, 5.0 LG, Depth: 7.7 mi, Class: Moderate, Intensity: VI - VII) earthquake occurred 28.9 miles away from Bollinger County center
On 4/18/2008 at 09:36:59, a magnitude 5.4 (5.1 MB, 4.8 MS, 5.4 MW, 5.2 MW) earthquake occurred 139.0 miles away from the county center
On 5/4/1991 at 01:18:54, a magnitude 5.0 (4.4 MB, 4.6 LG, 5.0 LG, Depth: 3.1 mi) earthquake occurred 54.9 miles away from the county center
On 4/18/2008 at 09:36:59, a magnitude 5.2 (5.2 MW, Depth: 8.9 mi) earthquake occurred 139.0 miles away from the county center
On 3/25/1976 at 00:41:20, a magnitude 5.0 (4.9 MB, 5.0 LG) earthquake occurred 119.3 miles away from Bollinger County center
On 6/18/2002 at 17:37:15, a magnitude 5.0 (4.3 MB, 4.6 MW, 5.0 LG) earthquake occurred 130.0 miles away from the county center
Magnitude types: regional Lg-wave magnitude (LG), body-wave magnitude (MB), surface-wave magnitude (MS), moment magnitude (MW)
Most recent natural disasters:
- Missouri Covid-19 Pandemic, Incident Period: January 20, 2020, FEMA Id: 4490, Natural disaster type: Other
- Missouri Severe Storms, Tornadoes, And Flooding, Incident Period: April 29, 2019, FEMA Id: 4451, Natural disaster type: Storm, Tornado, Flood
- Missouri Severe Storms, Tornadoes, Straight-line Winds, And Flooding, Incident Period: April 28, 2017 - May 11, 2017, FEMA Id: 4317, Natural disaster type: Storm, Tornado, Flood, Wind
- Missouri Severe Storms, Tornadoes, Straight-line Winds, and Flooding, Incident Period: December 23, 2015 to January 09, 2016, Major Disaster (Presidential) Declared DR-4250: January 21, 2016, FEMA Id: 4250, Natural disaster type: Storm, Tornado, Flood, Wind
- Missouri Severe Storms, Tornadoes, Straight-line Winds, and Flooding, Incident Period: December 22, 2015 to January 09, 2016, Emergency Declared EM-3374: January 02, 2016, FEMA Id: 3374, Natural disaster type: Storm, Tornado, Flood, Wind
- Missouri Severe Storms, Tornadoes, and Flooding, Incident Period: April 19, 2011 to June 06, 2011, Major Disaster (Presidential) Declared DR-1980: May 09, 2011, FEMA Id: 1980, Natural disaster type: Storm, Tornado, Flood
- Missouri Severe Winter Storm, Incident Period: January 31, 2011 to February 05, 2011, Emergency Declared EM-3317: February 03, 2011, FEMA Id: 3317, Natural disaster type: Winter Storm
- Missouri Severe Storms, Tornadoes, and Flooding, Incident Period: May 08, 2009 to May 16, 2009, Major Disaster (Presidential) Declared DR-1847: June 19, 2009, FEMA Id: 1847, Natural disaster type: Storm, Tornado, Flood
- Missouri Severe Winter Storm, Incident Period: January 26, 2009 to January 28, 2009, Major Disaster (Presidential) Declared DR-1822: February 17, 2009, FEMA Id: 1822, Natural disaster type: Winter Storm
- Missouri Severe Winter Storm, Incident Period: January 26, 2009 to January 28, 2009, Emergency Declared EM-3303: January 30, 2009, FEMA Id: 3303, Natural disaster type: Winter Storm
- 11 other natural disasters have been reported since 1953.
The number of natural disasters in Bollinger County (21) is greater than the US average (15).
Major Disasters (Presidential) Declared: 13
Emergencies Declared: 5
Causes of natural disasters: Floods: 14, Storms: 13, Tornadoes: 12, Winter Storms: 5, Winds: 3, Heavy Rain: 1, Hurricane: 1, Other: 1 (Note: some incidents may be assigned to more than one category).
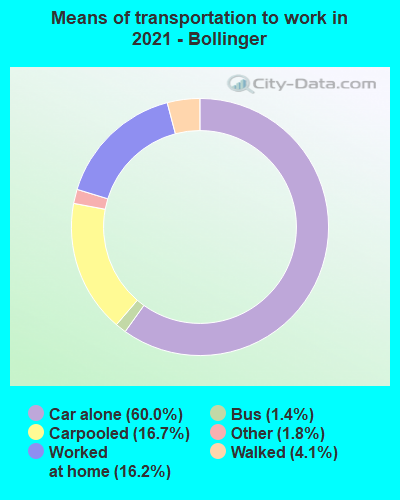
Means of transportation to work:
- Drove a car alone: 1,123 (56.9%)
- Carpooled: 378 (19.1%)
- Bus: 3 (0.2%)
- Taxicab, motorcycle, or other means: 13 (0.7%)
- Walked: 16 (0.8%)
- Worked at home: 511 (25.9%)
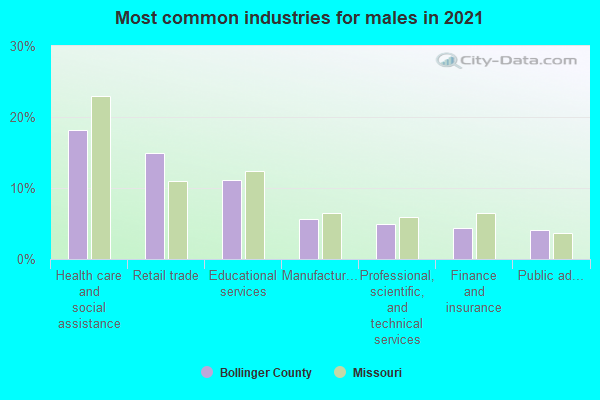
- Health care and social assistance (20%)
- Retail trade (15%)
- Educational services (11%)
- Manufacturing (7%)
- Accommodation and food services (5%)
- Finance and insurance (4%)
- Public administration (3%)
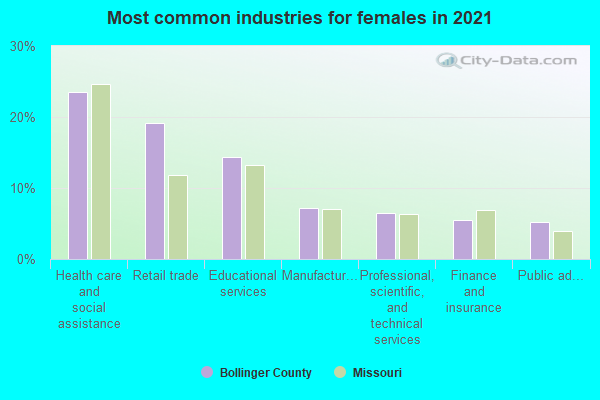
- Health care and social assistance (25%)
- Retail trade (19%)
- Educational services (13%)
- Manufacturing (9%)
- Accommodation and food services (6%)
- Finance and insurance (5%)
- Public administration (4%)
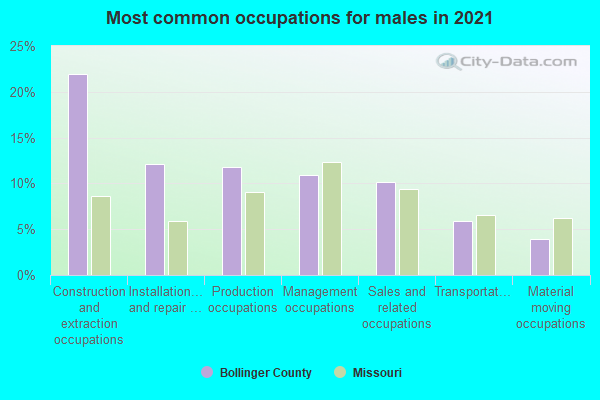
- Construction and extraction occupations (26%)
- Production occupations (13%)
- Management occupations (12%)
- Installation, maintenance, and repair occupations (10%)
- Sales and related occupations (9%)
- Transportation occupations (6%)
- Material moving occupations (4%)
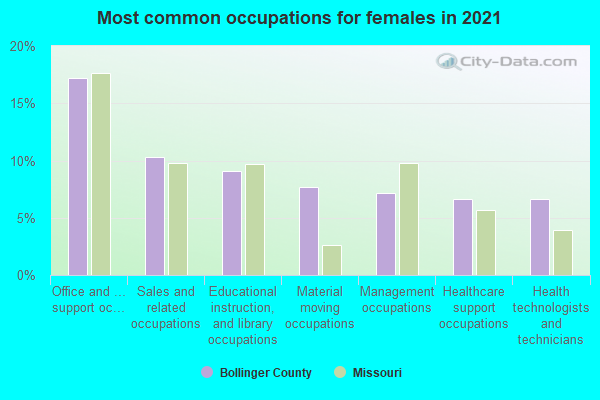
- Office and administrative support occupations (20%)
- Sales and related occupations (10%)
- Educational instruction, and library occupations (10%)
- Healthcare support occupations (7%)
- Material moving occupations (6%)
- Health technologists and technicians (6%)
- Business and financial operations occupations (6%)
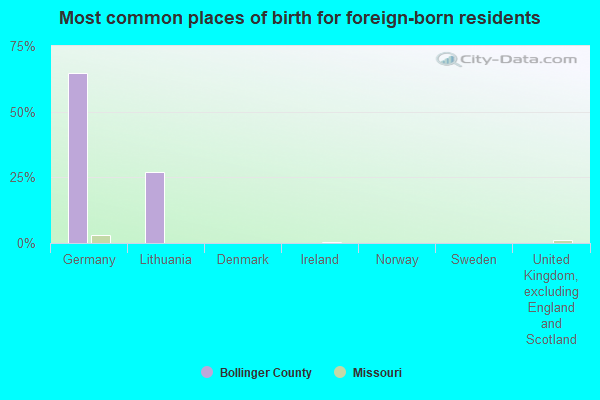
- Germany (71%)
- Lithuania (30%)
- South Africa (6%)
- Philippines (5%)
- Ireland (0%)
- Norway (0%)
- Sweden (0%)
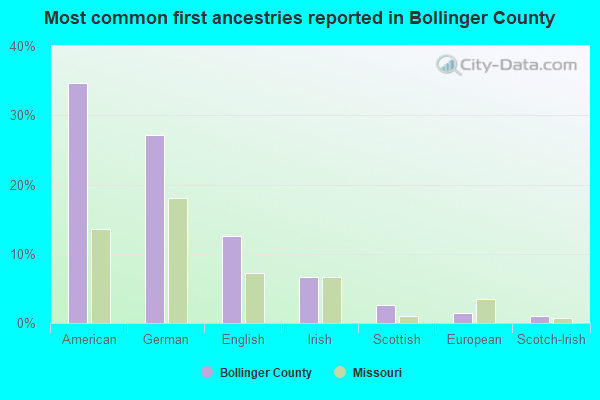
- American (33%)
- German (30%)
- English (10%)
- Irish (5%)
- Scottish (2%)
- European (2%)
- Italian (1%)
People in group quarters in Bollinger County, Missouri in 2010:
- 65 people in nursing facilities/skilled-nursing facilities
- 60 people in group homes intended for adults
- 29 people in residential treatment centers for adults
- 9 people in local jails and other municipal confinement facilities
People in group quarters in Bollinger County, Missouri in 2000:
- 86 people in other noninstitutional group quarters
- 64 people in nursing homes
- 11 people in local jails and other confinement facilities (including police lockups)
- 3 people in other nonhousehold living situations
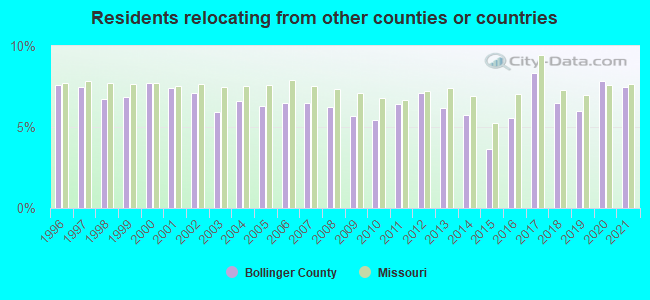
7.49% of this county's 2021 resident taxpayers lived in other counties in 2020 ($44,261 average adjusted gross income)
| Here: | 7.49% |
| Missouri average: | 7.67% |
10 or fewer of this county's residents moved from foreign countries.
6.16% relocated from other counties in Missouri ($34,413 average AGI)
1.33% relocated from other states ($9,845 average AGI)
Bollinger County: 1.33% Missouri average: 3.04%
Top counties from which taxpayers relocated into this county between 2020 and 2021:
| from Cape Girardeau County, MO | |
| from Madison County, MO | |
| from Scott County, MO | |
| from Perry County, MO | |
| from Stoddard County, MO |
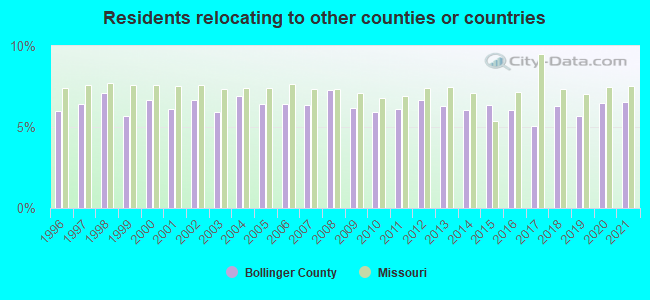
6.54% of this county's 2020 resident taxpayers moved to other counties in 2021 ($36,985 average adjusted gross income)
| Here: | 6.54% |
| Missouri average: | 7.51% |
10 or fewer of this county's residents moved to foreign countries.
5.37% relocated to other counties in Missouri ($29,037 average AGI)
1.17% relocated to other states ($7,948 average AGI)
Bollinger County: 1.17% Missouri average: 2.88%
Top counties to which taxpayers relocated from this county between 2020 and 2021:
| to Cape Girardeau County, MO | |
| to Stoddard County, MO |
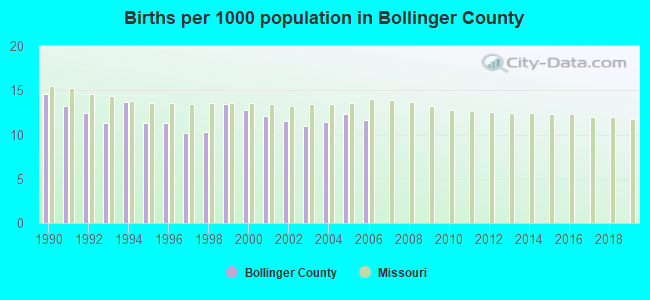
Births per 1000 population from 1990 to 1999: 12.2
Births per 1000 population from 2000 to 2006: 11.8
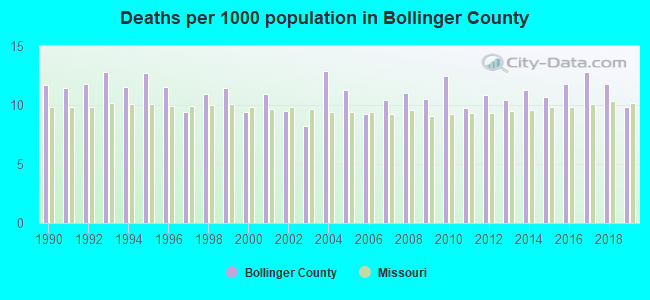
Deaths per 1000 population from 1990 to 1999: 11.5
Deaths per 1000 population from 2000 to 2009: 10.3
Deaths per 1000 population from 2010 to 2020: 11.5
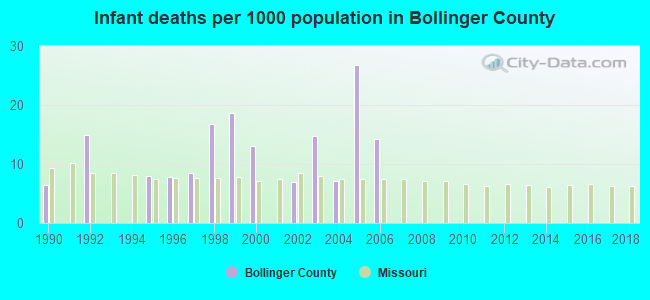
Infant deaths per 1000 live births from 1990 to 1999: 8.1
Infant deaths per 1000 live births from 2000 to 2006: 11.8
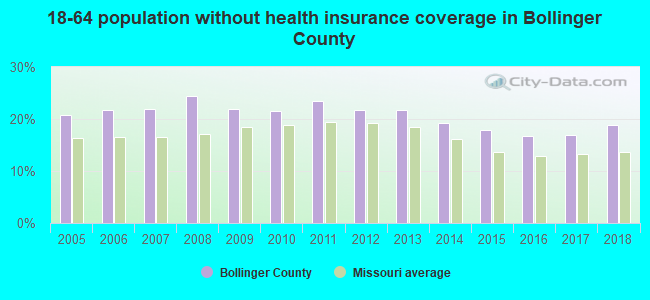
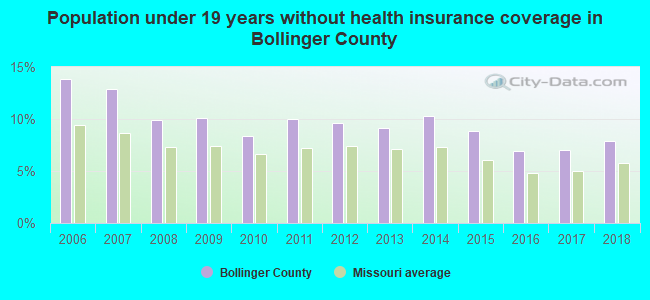
Persons under 19 years old without health insurance coverage in 2018: 7.9%
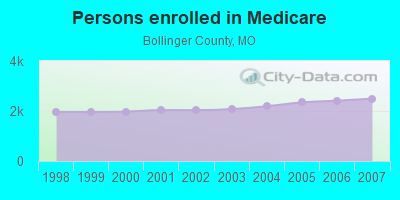
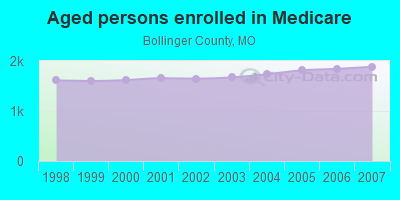
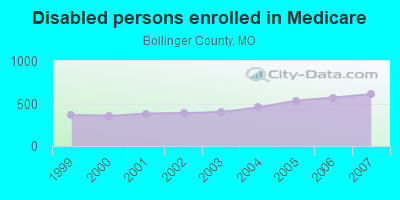
Persons enrolled in hospital insurance and/or supplemental medical insurance (Medicare) in July 1, 2007: 2,496 (1,885 aged, 611 disabled)
Children under 18 without health insurance coverage in 2007: 334 (12%)
Most common underlying causes of death in Bollinger County, Missouri in 1999 - 2019:
- Acute myocardial infarction, unspecified (242)
- Atherosclerotic heart disease (237)
- Bronchus or lung, unspecified - Malignant neoplasms (174)
- Cardiac arrest, unspecified (58)
- Atherosclerotic cardiovascular disease, so described (37)
- Chronic obstructive pulmonary disease, unspecified (34)
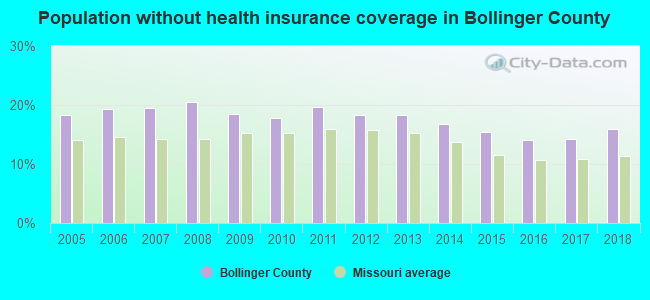
Population without health insurance coverage in 2000: 15%
Children under 18 without health insurance coverage in 2000: 13%
Medical specialist MDs per 100,000 population in 2005: 1,217
Total births per 100,000 population, July 2005 - July 2006 : 9
Total deaths per 100,000 population, July 2005 - July 2006: 24
Limited-service eating places per 100,000 population in 2005 : 8
Household type by relationship:
Households: 10,698- Male householders: 1,719 (466 living alone), Female householders: 2,173 (674 living alone)
2,219 spouses (2,213 opposite-sex spouses), 186 unmarried partners, (183 opposite-sex unmarried partners), 3,419 children (3,258 natural, 52 adopted, 110 stepchildren), 273 grandchildren, 49 brothers or sisters, 47 parents, 27 foster children, 120 other relatives, 191 non-relatives
- In group quarters: 228
Size of family households: 1,550 2-persons, 434 3-persons, 337 4-persons, 112 5-persons, 93 6-persons, 62 7-or-more-persons.
Size of nonfamily households: 1,142 1-person, 159 2-persons.
1,367 married couples with children.
615 single-parent households (66 men, 549 women).
98.9% of residents of Bollinger speak English at home.
0.1% of residents speak Spanish at home (100% speak English very well).
0.9% of residents speak other Indo-European language at home (83% speak English very well, 8% speak English well, 9% speak English not well).
In fiscal year 2004:
Federal Government expenditure: $72,100,000 ($5,842 per capita)
Department of Defense expenditure: $1,574,000
Federal direct payments to individuals for retirement and disability: $29,037,000
Federal other direct payments to individuals: $13,515,000
Federal direct payments not to individuals: $2,062,000
Federal grants: $24,915,000
Federal procurement contracts: $492,000 ($0,000 Department of Defense)
Federal salaries and wages: $2,080,000 ($0,000 Department of Defense)
Federal Government direct loans: $99,000
Federal guaranteed/insured loans: $1,001,000
Federal Government insurance: $6,441,000
Population change from April 1, 2000 to July 1, 2005:
Births: 724| Here: | 59 per 1000 residents |
| State: | 69 per 1000 residents |
Deaths: 591
| Here: | 48 per 1000 residents |
| State: | 49 per 1000 residents |
Net international migration: +5
| Here: | +0 per 1000 residents |
| State: | +7 per 1000 residents |
Net internal migration: +188
| Here: | +15 per 1000 residents |
| State: | +5 per 1000 residents |
Total withdrawal of fresh water for public supply: 0.44 millions of gallons per day (all from ground)
| Here: | 5.6 |
| State: | 6.4 |
| Here: | 4.6 |
| State: | 4.4 |
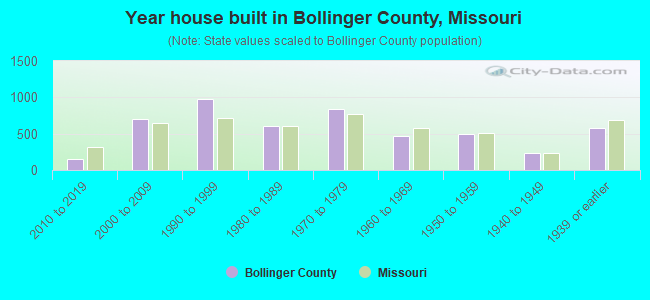
- Year house built in Bollinger County, Missouri
- 62020 or later
- 2222010 to 2019
- 6942000 to 2009
- 8751990 to 1999
- 6561980 to 1989
- 7511970 to 1979
- 4701960 to 1969
- 4921950 to 1959
- 2251940 to 1949
- 6221939 or earlier
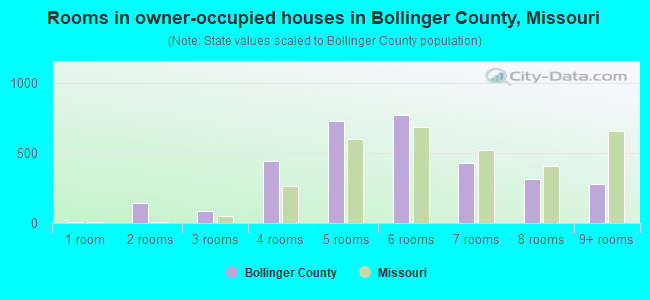
- Rooms in owner-occupied houses in Bollinger County, Missouri
- 81 room
- 1672 rooms
- 1253 rooms
- 4554 rooms
- 7075 rooms
- 7016 rooms
- 4327 rooms
- 3058 rooms
- 2409+ rooms
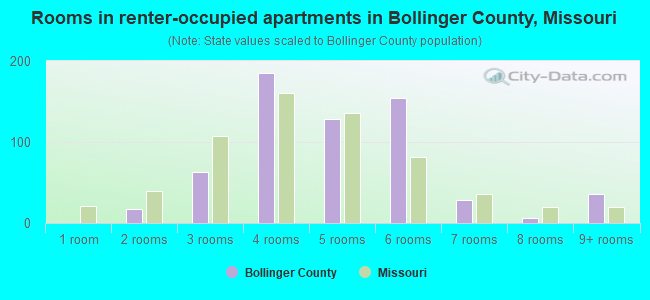
- Rooms in renter-occupied apartments in Bollinger County, Missouri
- 01 room
- 322 rooms
- 863 rooms
- 2524 rooms
- 1435 rooms
- 1566 rooms
- 247 rooms
- 28 rooms
- 629+ rooms
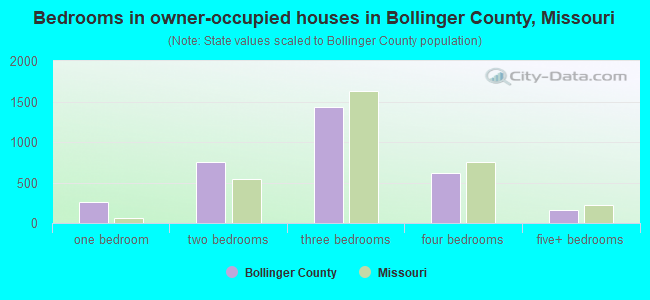
- Bedrooms in owner-occupied houses in Bollinger County, Missouri
- 14no bedroom
- 3091 bedroom
- 7802 bedrooms
- 1,3223 bedrooms
- 6164 bedrooms
- 1095+ bedrooms
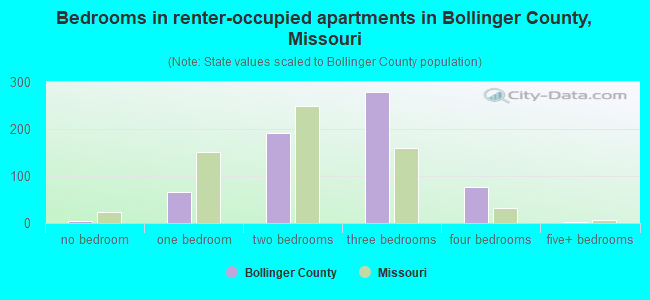
- Bedrooms in renter-occupied apartments in Bollinger County, Missouri
- 1no bedroom
- 1111 bedroom
- 2502 bedrooms
- 2963 bedrooms
- 954 bedrooms
- 05+ bedrooms
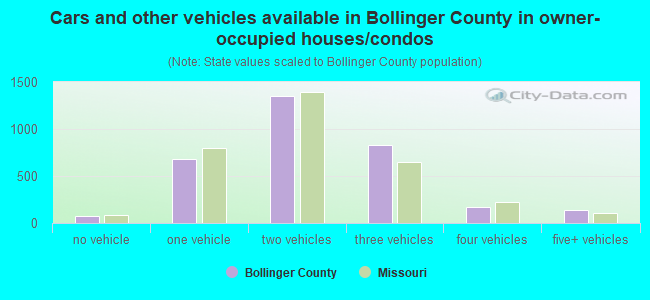
- Cars and other vehicles available in Bollinger County in owner-occupied houses/condos
- 53no vehicle
- 6401 vehicle
- 1,3952 vehicles
- 7763 vehicles
- 1124 vehicles
- 1495+ vehicles
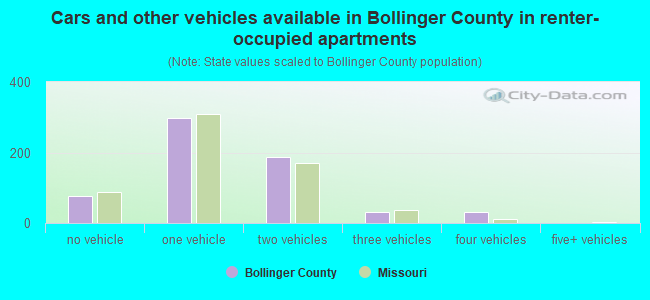
- Cars and other vehicles available in Bollinger County in renter-occupied apartments
- 98no vehicle
- 3241 vehicle
- 2452 vehicles
- 563 vehicles
- 354 vehicles
- 05+ vehicles
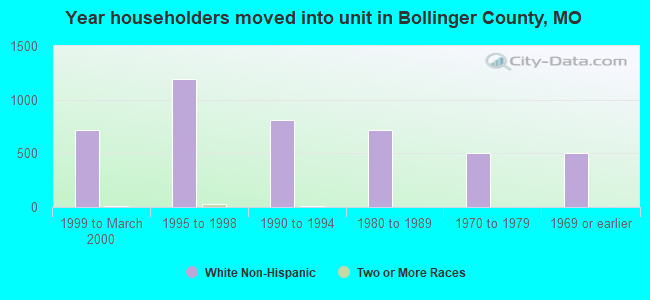
86.8% of Bollinger County residents lived in the same house 1 years ago.
Out of people who lived in different houses, 33% lived in this county.
Out of people who lived in different counties, 79% lived in Missouri.
| Bollinger County: | 86.8% |
| State average: | 87.1% |
Place of birth for U.S.-born residents:
- This state: 8,963
- Other state: 1,613
- Northeast: 19
- Midwest: 737
- South: 665
- West: 186
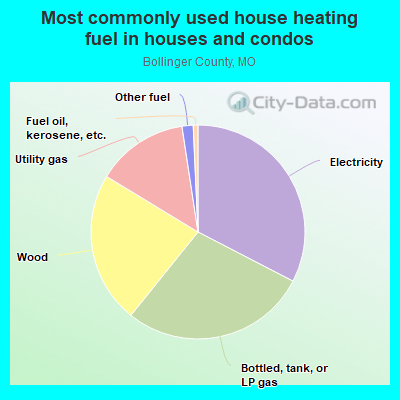
- 34.0%Bottled, tank, or LP gas
- 31.9%Electricity
- 20.5%Wood
- 12.7%Utility gas
- 0.8%Fuel oil, kerosene, etc.
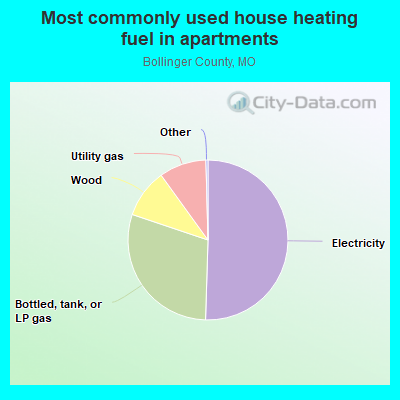
- 53.6%Electricity
- 21.8%Bottled, tank, or LP gas
- 16.5%Wood
- 8.1%Utility gas
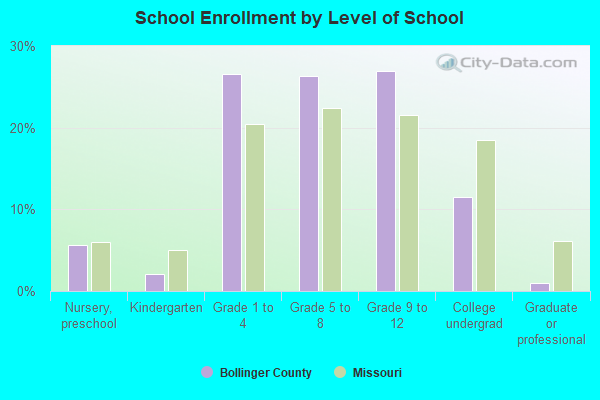
Private vs. public school enrollment:
| Here: | 11.4% |
| Missouri: | 15.4% |
| Here: | 6.0% |
| Missouri: | 13.9% |
| Here: | 0.0% |
| Missouri: | 22.6% |
Bollinger County government finances - Expenditure in 2017:
- Charges - Other: $257,000
- Current Operations - General - Other: $1,040,000
Police Protection: $634,000
Financial Administration: $325,000
Regular Highways: $278,000
Central Staff Services: $251,000
Judicial and Legal Services: $170,000
General Public Buildings: $167,000
Correctional Institutions: $162,000
Public Welfare - Other: $93,000
- Miscellaneous - General Revenue - Other: $362,000
- Other Capital Outlay - General - Other: $159,000
- Other Funds - Cash and Securities: $833,000
- State Intergovernmental - Other: $1,075,000
Highways: $19,000
- Tax - General Sales and Gross Receipts: $1,113,000
Property: $871,000
- Total Salaries and Wages: $466,000
Bollinger County government finances - Revenue in 2017:
- Charges - Other: $257,000
- Current Operations - General - Other: $1,040,000
Police Protection: $634,000
Financial Administration: $325,000
Regular Highways: $278,000
Central Staff Services: $251,000
Judicial and Legal Services: $170,000
General Public Buildings: $167,000
Correctional Institutions: $162,000
Public Welfare - Other: $93,000
- Miscellaneous - General Revenue - Other: $362,000
- Other Capital Outlay - General - Other: $159,000
- Other Funds - Cash and Securities: $833,000
- State Intergovernmental - Other: $1,075,000
Highways: $19,000
- Tax - General Sales and Gross Receipts: $1,113,000
Property: $871,000
- Total Salaries and Wages: $466,000
Bollinger County government finances - Debt in 2017:
- Charges - Other: $257,000
- Current Operations - General - Other: $1,040,000
Police Protection: $634,000
Financial Administration: $325,000
Regular Highways: $278,000
Central Staff Services: $251,000
Judicial and Legal Services: $170,000
General Public Buildings: $167,000
Correctional Institutions: $162,000
Public Welfare - Other: $93,000
- Miscellaneous - General Revenue - Other: $362,000
- Other Capital Outlay - General - Other: $159,000
- Other Funds - Cash and Securities: $833,000
- State Intergovernmental - Other: $1,075,000
Highways: $19,000
- Tax - General Sales and Gross Receipts: $1,113,000
Property: $871,000
- Total Salaries and Wages: $466,000
Bollinger County government finances - Cash and Securities in 2017:
- Charges - Other: $257,000
- Current Operations - General - Other: $1,040,000
Police Protection: $634,000
Financial Administration: $325,000
Regular Highways: $278,000
Central Staff Services: $251,000
Judicial and Legal Services: $170,000
General Public Buildings: $167,000
Correctional Institutions: $162,000
Public Welfare - Other: $93,000
- Miscellaneous - General Revenue - Other: $362,000
- Other Capital Outlay - General - Other: $159,000
- Other Funds - Cash and Securities: $833,000
- State Intergovernmental - Other: $1,075,000
Highways: $19,000
- Tax - General Sales and Gross Receipts: $1,113,000
Property: $871,000
- Total Salaries and Wages: $466,000
Supplemental Security Income (SSI) in 2006:
- Total number of recipients: 420
- Number of aged recipients: 34
- Number of blind and disabled recipients: 386
- Number of recipients under 18: 39
- Number of recipients between 18 and 64: 312
- Number of recipients older than 64: 69
- Number of recipients also receiving OASDI: 193
- Amount of payments (thousands of dollars): 175
| Most common first names in Bollinger County, MO among deceased individuals | ||
| Name | Count | Lived (average) |
|---|---|---|
| William | 26 | 75.9 years |
| John | 22 | 74.9 years |
| Charles | 19 | 74.3 years |
| Mary | 19 | 81.7 years |
| James | 19 | 73.7 years |
| Robert | 15 | 68.6 years |
| George | 12 | 79.7 years |
| Paul | 12 | 71.9 years |
| Marie | 11 | 83.4 years |
| Ruby | 11 | 78.2 years |
| Most common last names in Bollinger County, MO among deceased individuals | ||
| Last name | Count | Lived (average) |
|---|---|---|
| Long | 24 | 76.7 years |
| Cook | 22 | 78.4 years |
| Brown | 21 | 76.5 years |
| Bollinger | 18 | 71.0 years |
| Welker | 18 | 73.4 years |
| Lincoln | 17 | 76.0 years |
| Stevens | 14 | 70.6 years |
| James | 14 | 74.8 years |
| Kirkpatrick | 14 | 77.3 years |
| Smith | 12 | 78.9 years |
| Businesses in Bollinger County, MO | ||||
| Name | Count | Name | Count | |
|---|---|---|---|---|
| Chevrolet | 1 | RadioShack | 1 | |
| Ford | 1 | Subway | 1 | |
| H&R Block | 1 | U-Haul | 1 | |
| McDonald's | 1 | |||