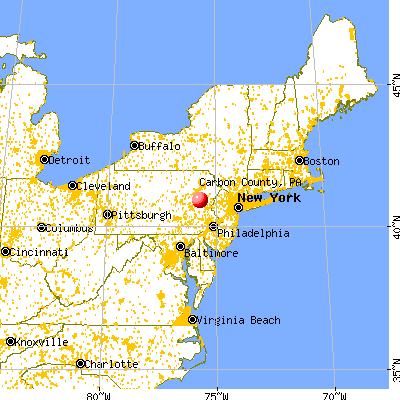
Carbon County, Pennsylvania (PA)
County owner-occupied free and clear houses and condos in 2010: 7,642
County owner-occupied houses and condos in 2000: 18,525
Renter-occupied apartments: 6,041 (it was 5,176 in 2000)
| % of renters here: | 22% |
| State: | 30% |
Land area: 381 sq. mi.
Water area: 6.2 sq. mi.
Population density: 172 people per square mile (high).
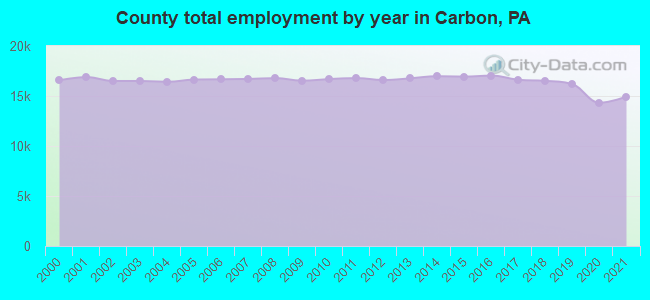
Industries providing employment: Educational, health and social services (25.5%), Manufacturing (12.2%), Retail trade (11.4%), Transportation and warehousing,and utilities (10.2%).
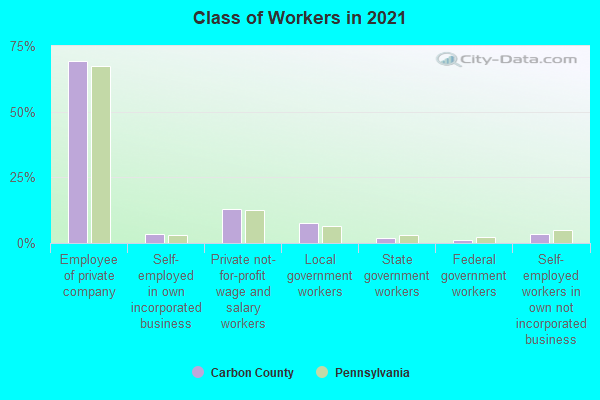
Type of workers:
- Private wage or salary: 86%
- Government: 11%
- Self-employed, not incorporated: 3%
- Unpaid family work: 0%
- OSM Map
- General Map
- Google Map
- MSN Map


- 57,18388.7%White Non-Hispanic Alone
- 4,1136.4%Hispanic or Latino
- 1,6382.5%Two or more races
- 1,1171.7%Black Non-Hispanic Alone
- 2860.4%Asian alone
- 1060.2%American Indian and Alaska Native alone
- 580.09%Some other race alone

| Median resident age: | 46.8 years |
| Pennsylvania median age: | 40.9 years |
| Males: 33,064 | |
| Females: 32,396 |

 | Is Taylor Swift the most famous person to ever come from the Philly area? (220 replies) |
| COVID-19 is coming to our area (317 replies) |
| Stuck on location (30 replies) |
| Considering Poconos Investment. Feedback wanted. (83 replies) |
| Carbon county propane supplier and ISP (17 replies) |
| Fact or Fiction about Pa as a whole (36 replies) |
| Carbon County: | 2.0 people |
| Pennsylvania: | 2 people |
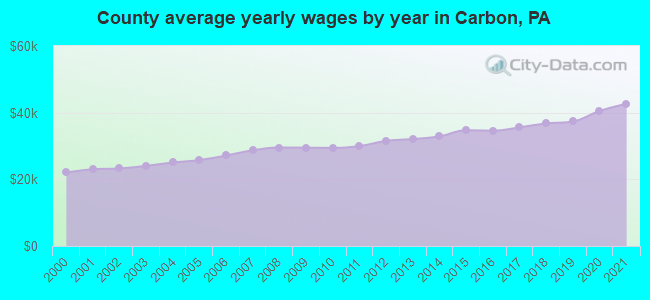
Estimated median household income in 2022: $64,456 ($35,113 in 1999)
| This county: | $64,456 |
| Pennsylvania: | $71,798 |
Median contract rent in 2022 for apartments: $741 (lower quartile is $596, upper quartile is $930)
| This county: | $741 |
| State: | $922 |
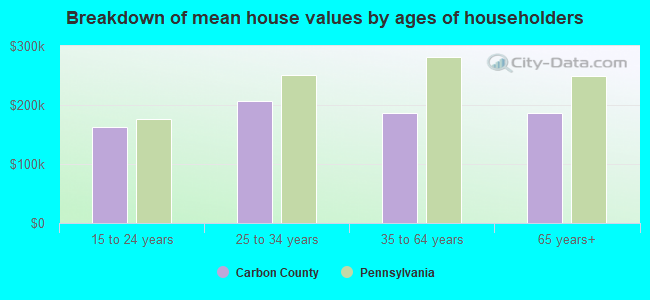
Estimated median house or condo value in 2022: $202,700 (it was $81,000 in 2000)
| Carbon: | $202,700 |
| Pennsylvania: | $245,500 |
Mean price in 2022:
Median monthly housing costs for homes and condos with a mortgage: $1,375Detached houses: $240,102
Here: $240,102 State: $317,202 Townhouses or other attached units: $119,240
Here: $119,240 State: $254,369 In 2-unit structures: $134,143
Here: $134,143 State: $249,182 In 3-to-4-unit structures: $267,473
Here: $267,473 State: $297,446 Mobile homes: $60,365
Here: $60,365 State: $92,414
Median monthly housing costs for units without a mortgage: $579
Institutionalized population: 643
Health of residents in Carbon County based on CDC Behavioral Risk Factor Surveillance System Survey Questionnaires from 2013 to 2021:
General health status score of residents in this county from 1 (poor) to 5 (excellent) is 3.5. This is about average.68.9% of residents exercised in the past month. This is less than average.
47.3% of residents smoked 100+ cigarettes in their lives. This is about average.
57.5% of adult residents drank alcohol in the past 30 days. This is less than average.
70.9% of residents visited a dentist within the past year. This is about average.
Average weight of males is 200 pounds. This is more than average.
Average weight of females is 161 pounds. This is about average.
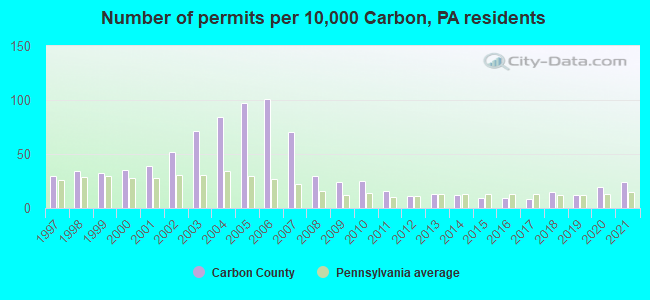
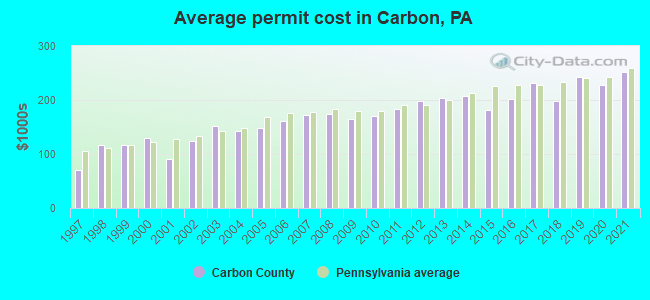
Single-family new house construction building permits:
- 2022: 145 buildings, average cost: $278,800
- 2021: 144 buildings, average cost: $251,900
- 2020: 110 buildings, average cost: $227,100
- 2019: 69 buildings, average cost: $242,900
- 2018: 87 buildings, average cost: $197,700
- 2017: 48 buildings, average cost: $232,100
- 2016: 54 buildings, average cost: $202,100
- 2015: 55 buildings, average cost: $181,000
- 2014: 70 buildings, average cost: $206,500
- 2013: 74 buildings, average cost: $203,900
- 2012: 65 buildings, average cost: $198,700
- 2011: 97 buildings, average cost: $183,000
- 2010: 149 buildings, average cost: $169,600
- 2009: 140 buildings, average cost: $165,000
- 2008: 174 buildings, average cost: $175,300
- 2007: 412 buildings, average cost: $171,600
- 2006: 593 buildings, average cost: $160,800
- 2005: 569 buildings, average cost: $147,700
- 2004: 493 buildings, average cost: $143,200
- 2003: 416 buildings, average cost: $152,200
- 2002: 307 buildings, average cost: $125,400
- 2001: 230 buildings, average cost: $90,900
- 2000: 205 buildings, average cost: $128,500
- 1999: 191 buildings, average cost: $115,600
- 1998: 200 buildings, average cost: $115,500
- 1997: 174 buildings, average cost: $71,000
Median real estate property taxes paid for housing units with mortgages in 2022: $2,918 (1.4%)
Median real estate property taxes paid for housing units with no mortgage in 2022: $2,609 (1.4%)


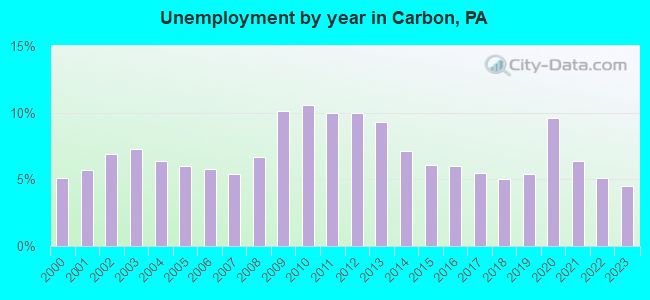
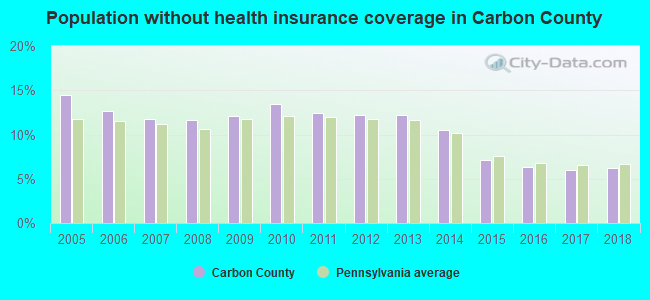
| Carbon County: | 8.7% |
| Pennsylvania: | 11.8% |
Median age of residents in 2022: 46.8 years old
(Males: 45.5 years old, Females: 48.9 years old)
(Median age for: White residents: 48.9 years old, Black residents: 30.3 years old, Asian residents: 52.1 years old, Hispanic or Latino residents: 36.5 years old, Other race residents: 29.3 years old)
Area name: Allentown-Bethlehem-Easton, PA HUD Metro FMR Area
Fair market rent in 2006 for a 1-bedroom apartment in Carbon County is $636 a month.
Fair market rent for a 2-bedroom apartment is $753 a month.
Fair market rent for a 3-bedroom apartment is $974 a month.
Cities in this county include: Lehighton, Palmerton, Jim Thorpe, Indian Mountain Lake, Lansford, Nesquehoning, Summit Hill, Weatherly, Towamensing Trails, Weissport East.
Notable locations in this county outside city limits:
Notable locations in Carbon County: Slippery Rock (A), Borlands Par 3 Golf Course (B), Green Meadows Golf Course (C), Tanglewood Golf Course (D), Mohawk Trails Golf Course (E), Del-Mar Golf Course (F), Wilmington Junction (G), Quakertown Station (H), Seymore Station (I), Edinburg Station (J), The Wilroy Iron Furnace (K), Falcon Camp (L), Fayette Chapel (M), Harbor Bridge (N), New Castle Country Club (O), Heinz Camp (P), Camp Agawam (Q), Camp Allegheny (R), Camp Rentz (S), Kings Chapel (T). Display/hide their locations on the map
Churches in Carbon County include: Highland Heights Church (A), Mahoning Church (B), Maple Grove Church (C), Harmony Church (D), Greenwood Church (E), Graceland Chapel (F), Rich Hill Church (G), Mount Herman Church (H), Saint James Church (I). Display/hide their locations on the map
Cemeteries: Volant Cemetery (1), Ashton Cemetery (2), Wurtemburg Cemetery (3), Briar Hill Cemetery (4), Fair Oaks Cemetery (5), Saint Philip and James Cemetery (6), Saint Vitus Cemetery (7). Display/hide their locations on the map
Lakes and reservoirs: Bates Lake (A), Chambers Reservoir (B). Display/hide their locations on the map
Streams, rivers, and creeks: Jenkins Run (A), Jamison Run (B), Hottenbaugh Run (C), Taylor Run (D), Muddy Creek (E), Hickory Run (F), Little Neshannock Creek (G), Sugar Creek (H), Hell Run (I). Display/hide their locations on the map
Parks in Carbon County include: State Game Lands Number 216 (1), Lakewood Park (2), State Game Lands Number 178 (3), State Game Lands Number 150 (4), McConnells Mill State Park (5), State Game Lands Number 151 (6). Display/hide their locations on the map
Neighboring counties: Erie County, Ohio  , Uintah County, Utah , Hamilton County, Nebraska , Schuylkill County
  , Marshall County, Illinois .
| Here: | 3.3% |
| Pennsylvania: | 2.9% |
Current college students: 1,770
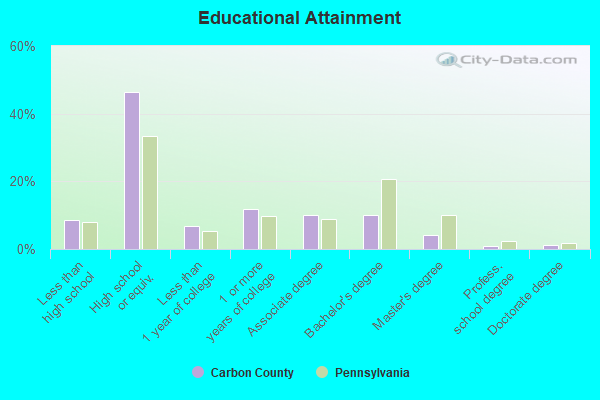
People 25 years of age or older with a high school degree or higher: 89.1%
People 25 years of age or older with a bachelor's degree or higher: 18.6%
Number of foreign born residents: 2,457 (62.4% naturalized citizens)
| Carbon County: | 3.8% |
| Whole state: | 7.5% |
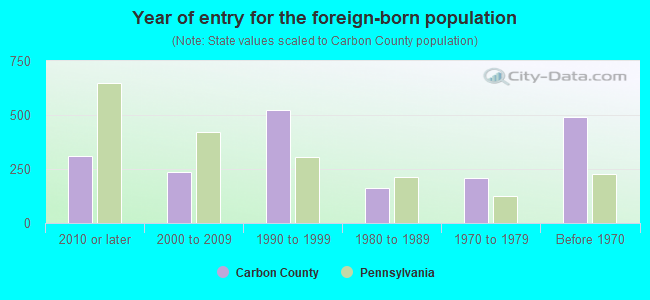
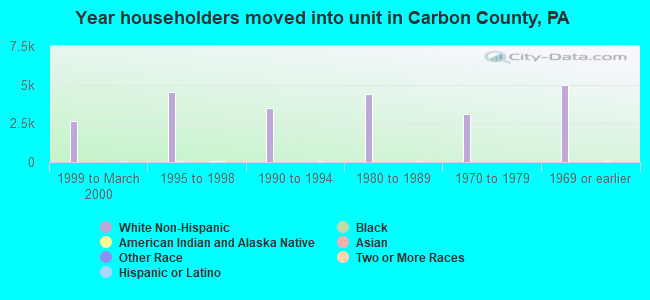
- Year of entry for the foreign-born population
- 3252010 or later
- 4242000 to 2009
- 7431990 to 1999
- 1641980 to 1989
- 2091970 to 1979
- 493Before 1970
Mean travel time to work (commute): minutes
Percentage of county residents living and working in this county: 98.1%
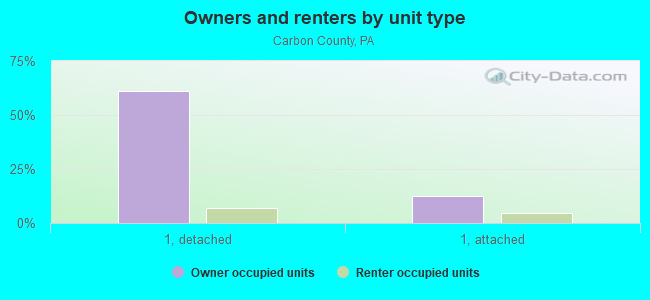
Housing units in structures:
- One, detached: 25,174
- One, attached: 5,517
- Two: 746
- 3 or 4: 380
- 5 to 9: 358
- 10 to 19: 167
- 20 to 49: 78
- 50 or more: 538
- Mobile homes: 1,436
Housing units in Carbon County with a mortgage: 12,206 (1,349 second mortgage, 46 home equity loan, 1,024 both second mortgage and home equity loan)
Houses without a mortgage: 1,525
| Here: | 92.3% with mortgage |
| State: | 93.8% with mortgage |
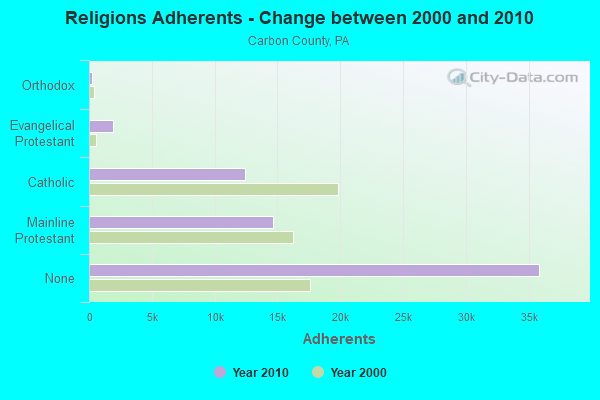
Religion statistics for Carbon County
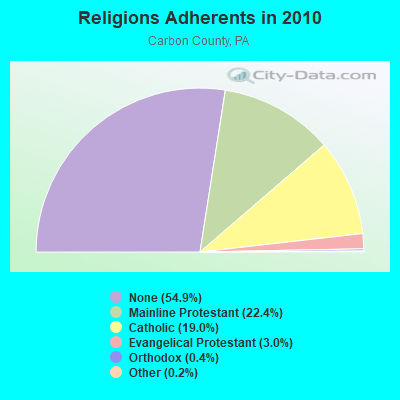
| Religion | Adherents | Congregations |
|---|---|---|
| Mainline Protestant | 14,613 | 52 |
| Catholic | 12,418 | 14 |
| Evangelical Protestant | 1,943 | 18 |
| Orthodox | 264 | 2 |
| Other | 162 | 3 |
| None | 35,849 | - |
Source: Clifford Grammich, Kirk Hadaway, Richard Houseal, Dale E.Jones, Alexei Krindatch, Richie Stanley and Richard H.Taylor. 2012. 2010 U.S.Religion Census: Religious Congregations & Membership Study. Association of Statisticians of American Religious Bodies. Jones, Dale E., et al. 2002. Congregations and Membership in the United States 2000. Nashville, TN: Glenmary Research Center.
Food Environment Statistics:
| Carbon County: | 2.06 / 10,000 pop. |
| State: | 2.04 / 10,000 pop. |
| This county: | 1.27 / 10,000 pop. |
| Pennsylvania: | 0.88 / 10,000 pop. |
| Carbon County: | 2.85 / 10,000 pop. |
| Pennsylvania: | 2.52 / 10,000 pop. |
| This county: | 8.39 / 10,000 pop. |
| State: | 7.12 / 10,000 pop. |
| Carbon County: | 9.1% |
| Pennsylvania: | 9.1% |
| Carbon County: | 29.6% |
| State: | 27.2% |
| Here: | 9.4% |
| State: | 11.5% |
Agriculture in Carbon County:
Average size of farms: 93 acresAverage value of agricultural products sold per farm: $39,551
Average value of crops sold per acre for harvested cropland: $674.87
The value of nursery, greenhouse, floriculture, and sod as a percentage of the total market value of agricultural products sold: 45.39%
The value of livestock, poultry, and their products as a percentage of the total market value of agricultural products sold: 13.05%
Average total farm production expenses per farm: $31,973
Harvested cropland as a percentage of land in farms: 54.51%
Irrigated harvested cropland as a percentage of land in farms: 0.76%
Average market value of all machinery and equipment per farm: $46,452
The percentage of farms operated by a family or individual: 86.41%
Average age of principal farm operators: 51 years
Average number of cattle and calves per 100 acres of all land in farms: 5.22
Milk cows as a percentage of all cattle and calves: 21.79%
Corn for grain: 1022 harvested acres
All wheat for grain: 405 harvested acres
Soybeans for beans: 307 harvested acres
Vegetables: 376 harvested acres
Land in orchards: 34 acres
Tornado activity:
Carbon County historical area-adjusted tornado activity is significantly below Pennsylvania state average. It is 4261167.2 times below overall U.S. average.Tornadoes in this county have caused 14 injuries recorded between 1950 and 2004.
On 8/8/1992, a category 2 (max. wind speeds 113-157 mph) tornado injured 11 people and caused between $50,000 and $500,000 in damages.
Earthquake activity:
Carbon County-area historical earthquake activity is significantly above Pennsylvania state average. It is 65% smaller than the overall U.S. average.On 8/23/2011 at 17:51:04, a magnitude 5.8 (5.8 MW, Depth: 3.7 mi, Class: Moderate, Intensity: VI - VII) earthquake occurred 238.0 miles away from Carbon County center
On 1/16/1994 at 01:49:16, a magnitude 4.6 (4.6 MB, 4.6 LG, Depth: 3.1 mi, Class: Light, Intensity: IV - V) earthquake occurred 42.4 miles away from the county center
On 10/7/1983 at 10:18:46, a magnitude 5.3 (5.1 MB, 5.3 LG, 5.1 ML) earthquake occurred 223.1 miles away from the county center
On 1/16/1994 at 00:42:43, a magnitude 4.2 (4.2 MB, 4.0 LG, Depth: 3.1 mi) earthquake occurred 41.9 miles away from the county center
On 9/25/1998 at 19:52:52, a magnitude 5.2 (4.8 MB, 4.3 MS, 5.2 LG, 4.5 MW, Depth: 3.1 mi) earthquake occurred 247.7 miles away from Carbon County center
On 4/20/2002 at 10:50:47, a magnitude 5.3 (5.3 ML, Depth: 3.0 mi) earthquake occurred 270.6 miles away from the county center
Magnitude types: regional Lg-wave magnitude (LG), body-wave magnitude (MB), local magnitude (ML), surface-wave magnitude (MS), moment magnitude (MW)
Most recent natural disasters:
- Pennsylvania Covid-19 Pandemic, Incident Period: January 20, 2020, Major Disaster (Presidential) Declared DR-4506-PA: March 30, 2020, FEMA Id: 4506, Natural disaster type: Other
- Pennsylvania Hurricane Sandy, Incident Period: October 26, 2012 to November 08, 2012, Emergency Declared EM-3356: October 29, 2012, FEMA Id: 3356, Natural disaster type: Hurricane
- Pennsylvania Remnants of Tropical Storm Lee, Incident Period: September 03, 2011 to October 15, 2011, Major Disaster (Presidential) Declared EM-3340: September 08, 2011, FEMA Id: 3340, Natural disaster type: Tropical Storm
- Pennsylvania Severe Storms, Flooding, and Mudslides, Incident Period: June 23, 2006 to July 10, 2006, Major Disaster (Presidential) Declared DR-1649: June 30, 2006, FEMA Id: 1649, Natural disaster type: Storm, Mudslide, Flood
- Pennsylvania Hurricane Katrina Evacuation, Incident Period: August 29, 2005 to October 01, 2005, Emergency Declared EM-3235: September 10, 2005, FEMA Id: 3235, Natural disaster type: Hurricane
- Pennsylvania Tropical Depression Ivan, Incident Period: September 17, 2004 to October 01, 2004, Major Disaster (Presidential) Declared DR-1557: September 19, 2004, FEMA Id: 1557, Natural disaster type: Tropical Depression
- Pennsylvania Snowstorm, Incident Period: February 14, 2003 to February 19, 2003, Emergency Declared EM-3180: March 14, 2003, FEMA Id: 3180, Natural disaster type: Snowstorm
- Pennsylvania Flooding, Incident Period: January 19, 1996 to February 01, 1996, Major Disaster (Presidential) Declared DR-1093: January 21, 1996, FEMA Id: 1093, Natural disaster type: Flood
- Pennsylvania Blizzard, Incident Period: January 06, 1996 to January 12, 1996, Major Disaster (Presidential) Declared DR-1085: January 13, 1996, FEMA Id: 1085, Natural disaster type: Blizzard
- Pennsylvania Winter Storm, Severe Storm, Incident Period: January 04, 1994 to February 25, 1994, Major Disaster (Presidential) Declared DR-1015: March 10, 1994, FEMA Id: 1015, Natural disaster type: Winter Storm, Storm
- 6 other natural disasters have been reported since 1953.
The number of natural disasters in Carbon County (16) is near the US average (15).
Major Disasters (Presidential) Declared: 11
Emergencies Declared: 5
Causes of natural disasters: Floods: 3, Hurricanes: 3, Storms: 3, Snowstorms: 2, Tropical Storms: 2, Winter Storms: 2, Blizzard: 1, Mudslide: 1, Snowfall: 1, Tropical Depression: 1, Water Shortage: 1, Other: 1 (Note: some incidents may be assigned to more than one category).
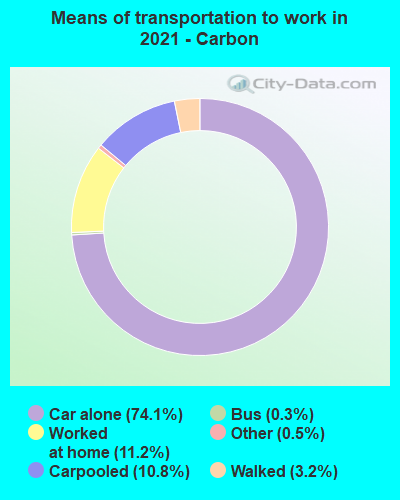
Means of transportation to work:
- Drove a car alone: 11,810 (70.7%)
- Carpooled: 1,828 (10.9%)
- Bus: 15 (0.1%)
- Taxicab, motorcycle, or other means: 133 (0.8%)
- Bicycle: 3 (0.0%)
- Walked: 397 (2.4%)
- Worked at home: 2,630 (15.7%)
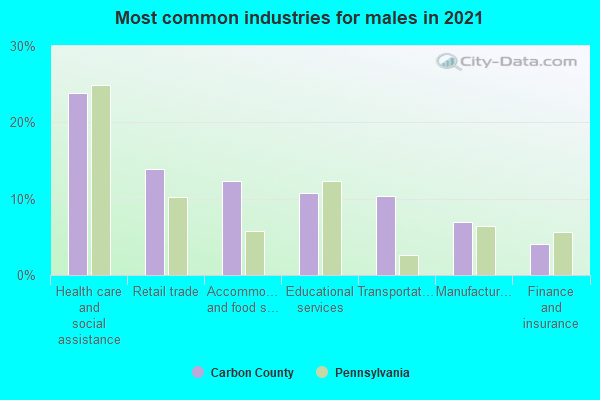
- Health care and social assistance (25%)
- Retail trade (13%)
- Educational services (10%)
- Professional, scientific, and technical services (8%)
- Manufacturing (7%)
- Accommodation and food services (4%)
- Other services, except public administration (4%)

- Health care and social assistance (29%)
- Retail trade (15%)
- Educational services (11%)
- Professional, scientific, and technical services (10%)
- Manufacturing (8%)
- Accommodation and food services (5%)
- Other services, except public administration (5%)
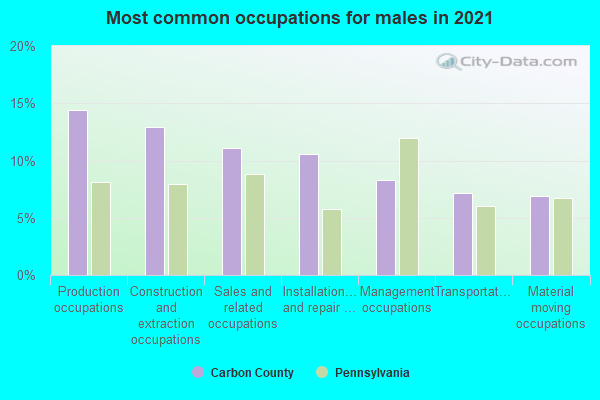
- Production occupations (17%)
- Material moving occupations (9%)
- Installation, maintenance, and repair occupations (9%)
- Management occupations (8%)
- Construction and extraction occupations (8%)
- Building and grounds cleaning and maintenance occupations (8%)
- Transportation occupations (6%)
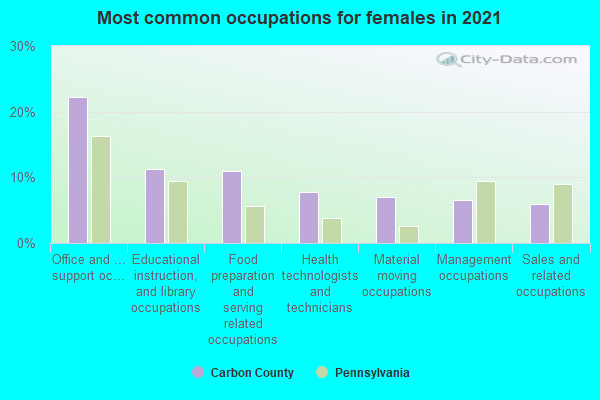
- Office and administrative support occupations (19%)
- Educational instruction, and library occupations (11%)
- Sales and related occupations (11%)
- Healthcare support occupations (9%)
- Management occupations (8%)
- Food preparation and serving related occupations (7%)
- Health technologists and technicians (5%)
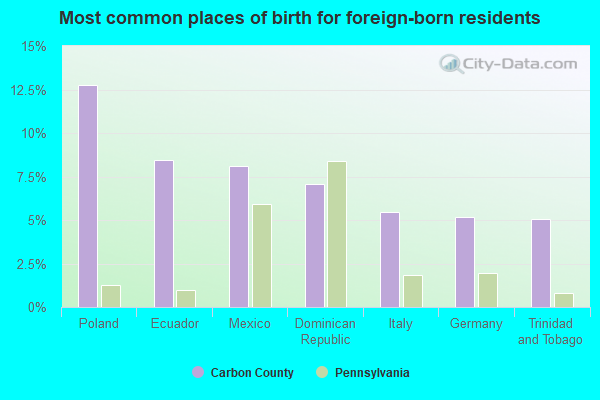
- Poland (15%)
- Mexico (11%)
- Dominican Republic (9%)
- Ecuador (8%)
- Canada (4%)
- Guyana (4%)
- Germany (4%)

- German (31%)
- Irish (10%)
- American (10%)
- Italian (8%)
- Pennsylvania German (6%)
- Polish (5%)
- English (4%)
People in group quarters in Carbon County, Pennsylvania in 2010:
- 430 people in nursing facilities/skilled-nursing facilities
- 159 people in local jails and other municipal confinement facilities
- 33 people in group homes intended for adults
- 26 people in correctional facilities intended for juveniles
- 18 people in group homes for juveniles (non-correctional)
- 17 people in other noninstitutional facilities
- 10 people in residential treatment centers for juveniles (non-correctional)
- 6 people in workers' group living quarters and job corps centers
People in group quarters in Carbon County, Pennsylvania in 2000:
- 389 people in nursing homes
- 137 people in local jails and other confinement facilities (including police lockups)
- 117 people in other noninstitutional group quarters
- 89 people in mental (psychiatric) hospitals or wards
- 69 people in training schools for juvenile delinquents
- 42 people in other nonhousehold living situations
- 29 people in homes for the mentally retarded
- 26 people in religious group quarters
- 19 people in homes for abused, dependent, and neglected children
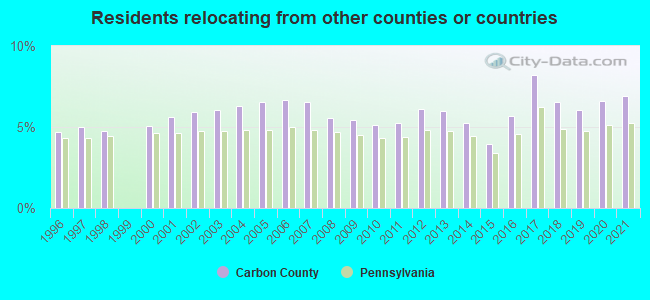
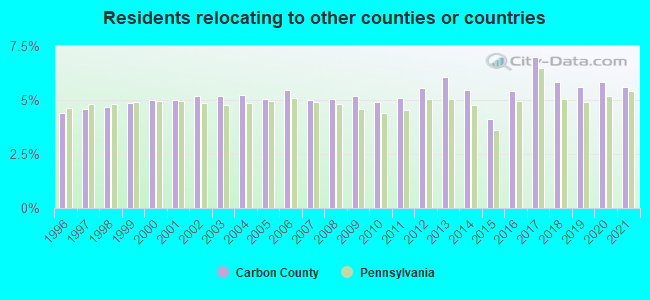
6.94% of this county's 2021 resident taxpayers lived in other counties in 2020 ($56,541 average adjusted gross income)
| Here: | 6.94% |
| Pennsylvania average: | 5.27% |
10 or fewer of this county's residents moved from foreign countries.
5.26% relocated from other counties in Pennsylvania ($37,055 average AGI)
1.68% relocated from other states ($19,486 average AGI)
Carbon County: 1.68% Pennsylvania average: 2.30%
Top counties from which taxpayers relocated into this county between 2020 and 2021:
| from Lehigh County, PA | |
| from Northampton County, PA | |
| from Luzerne County, PA | |
| from Schuylkill County, PA | |
| from Monroe County, PA | |
| from Bucks County, PA | |
| from Montgomery County, PA |
5.59% of this county's 2020 resident taxpayers moved to other counties in 2021 ($55,378 average adjusted gross income)
| Here: | 5.59% |
| Pennsylvania average: | 5.44% |
10 or fewer of this county's residents moved to foreign countries.
4.00% relocated to other counties in Pennsylvania ($33,982 average AGI)
1.59% relocated to other states ($21,396 average AGI)
Carbon County: 1.59% Pennsylvania average: 2.47%
Top counties to which taxpayers relocated from this county between 2020 and 2021:
| to Lehigh County, PA | |
| to Schuylkill County, PA | |
| to Northampton County, PA | |
| to Luzerne County, PA | |
| to Monroe County, PA | |
| to Berks County, PA | |
| to Montgomery County, PA |
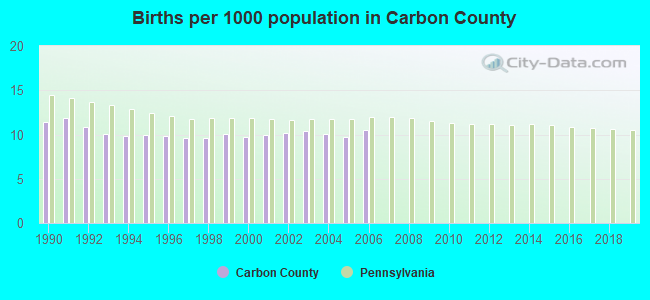
Births per 1000 population from 1990 to 1999: 10.3
Births per 1000 population from 2000 to 2006: 10.1
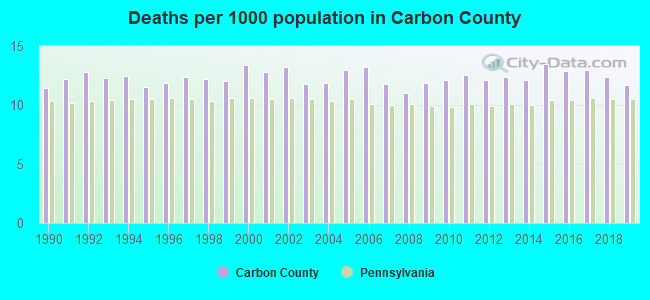
Deaths per 1000 population from 1990 to 1999: 12.1
Deaths per 1000 population from 2000 to 2009: 12.4
Deaths per 1000 population from 2010 to 2020: 12.7
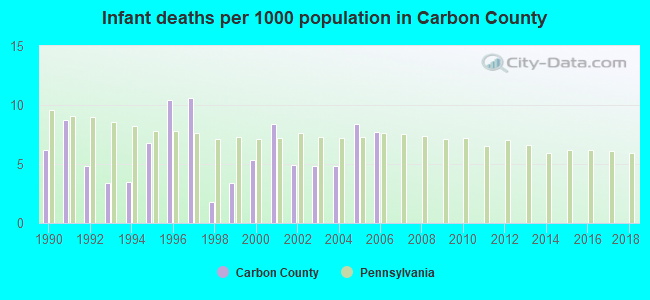
Infant deaths per 1000 live births from 1990 to 1999: 6.0
Infant deaths per 1000 live births from 2000 to 2006: 6.3
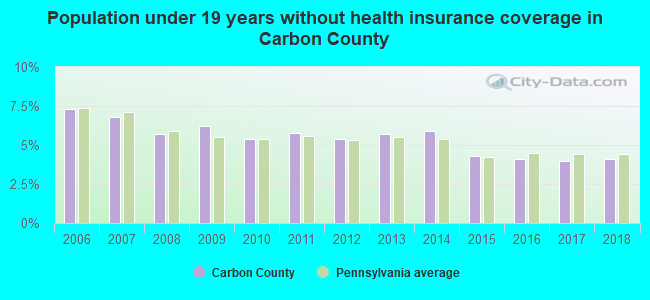
Persons under 19 years old without health insurance coverage in 2018: 4.1%
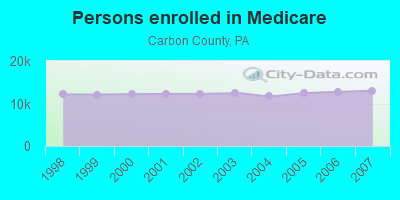
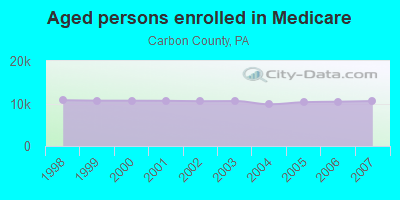
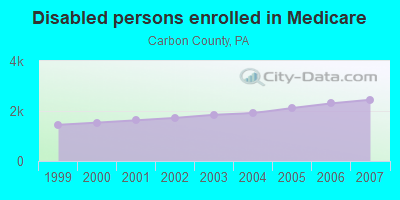
Persons enrolled in hospital insurance and/or supplemental medical insurance (Medicare) in July 1, 2007: 13,028 (10,578 aged, 2,450 disabled)
Children under 18 without health insurance coverage in 2007: 896 (6%)
Most common underlying causes of death in Carbon County, Pennsylvania in 1999 - 2019:
- Atherosclerotic heart disease (1,295)
- Acute myocardial infarction, unspecified (938)
- Bronchus or lung, unspecified - Malignant neoplasms (938)
- Chronic obstructive pulmonary disease, unspecified (616)
- Unspecified dementia (484)
- Alzheimer disease, unspecified (413)
- Stroke, not specified as haemorrhage or infarction (410)
- Congestive heart failure (345)
- Unspecified diabetes mellitus, without complications (304)
- Colon, unspecified - Malignant neoplasms (288)
Population without health insurance coverage in 2000: 9%
Children under 18 without health insurance coverage in 2000: 7%
Short term general hospital admissions per 100,000 population in 2004: 11,911
Short term general hospital beds per 100,000 population in 2004: 444
Emergency room visits per 100,000 population in 2004: 54,154
General practice office based MDs per 100,000 population in 2005: 994
Medical specialist MDs per 100,000 population in 2005: 1,235
Dentists per 100,000 population in 1998: 16
Total births per 100,000 population, July 2005 - July 2006 : 49
Total deaths per 100,000 population, July 2005 - July 2006: 50
Limited-service eating places per 100,000 population in 2005 : 10
Beer, wine & liquor stores per 100,000 population in 2005: 1
Suicides per 1,000,000 population from 2000 to 2006: 149.4. This is more than state average.
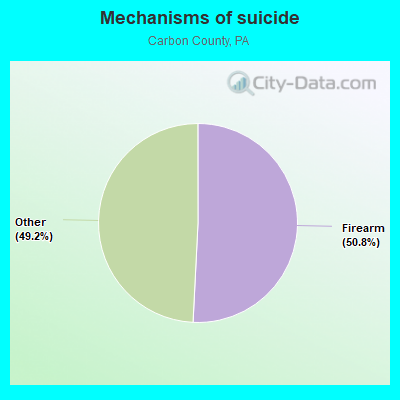
- Firearm - 75.9
- Other - 73.5
Household type by relationship:
Households: 65,460- Male householders: 14,573 (3,563 living alone), Female householders: 13,393 (3,587 living alone)
13,779 spouses (13,529 opposite-sex spouses), 3,469 unmarried partners, (3,469 opposite-sex unmarried partners), 16,811 children (15,310 natural, 483 adopted, 1,018 stepchildren), 923 grandchildren, 343 brothers or sisters, 524 parents, 0 foster children, 383 other relatives, 432 non-relatives
- In group quarters: 830
Size of family households: 8,781 2-persons, 5,345 3-persons, 1,466 4-persons, 2,371 5-persons, 510 6-persons, 70 7-or-more-persons.
Size of nonfamily households: 7,150 1-person, 2,182 2-persons, 91 3-persons.
7,273 married couples with children.
4,082 single-parent households (1,841 men, 2,241 women).
93.5% of residents of Carbon speak English at home.
3.7% of residents speak Spanish at home (78% speak English very well, 15% speak English well, 5% speak English not well, 2% don't speak English at all).
2.3% of residents speak other Indo-European language at home (60% speak English very well, 36% speak English well, 4% speak English not well).
0.2% of residents speak Asian or Pacific Island language at home (37% speak English very well, 50% speak English well, 12% speak English not well).
In fiscal year 2004:
Federal Government expenditure: $398,121,000 ($6,506 per capita)
Department of Defense expenditure: $53,981,000
Federal direct payments to individuals for retirement and disability: $192,247,000
Federal other direct payments to individuals: $104,761,000
Federal direct payments not to individuals: $789,000
Federal grants: $41,880,000
Federal procurement contracts: $50,626,000 ($48,028,000 Department of Defense)
Federal salaries and wages: $7,817,000 ($637,000 Department of Defense)
Federal Government direct loans: $42,000
Federal guaranteed/insured loans: $16,574,000
Federal Government insurance: $20,083,000
Population change from April 1, 2000 to July 1, 2005:
Births: 3,205| Here: | 52 per 1000 residents |
| State: | 61 per 1000 residents |
Deaths: 3,955
| Here: | 64 per 1000 residents |
| State: | 54 per 1000 residents |
Net international migration: +82
| Here: | +1 per 1000 residents |
| State: | +8 per 1000 residents |
Net internal migration: +3,904
| Here: | |
| State: |
Total withdrawal of fresh water for public supply: 23.51 millions of gallons per day (13% from ground, 87% from surface)
| Here: | 6.5 |
| State: | 6.8 |
| Here: | 5.4 |
| State: | 4.3 |
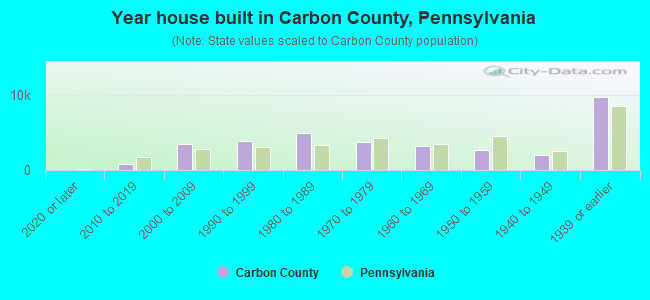
- Year house built in Carbon County, Pennsylvania
- 1702020 or later
- 1,0832010 to 2019
- 4,0532000 to 2009
- 3,6951990 to 1999
- 3,6201980 to 1989
- 4,6331970 to 1979
- 1,6141960 to 1969
- 1,9071950 to 1959
- 1,9771940 to 1949
- 11,6421939 or earlier
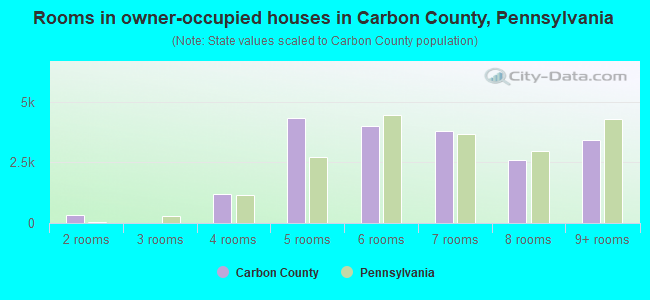
- Rooms in owner-occupied houses in Carbon County, Pennsylvania
- 1991 room
- 02 rooms
- 3973 rooms
- 2,1914 rooms
- 4,0935 rooms
- 4,0626 rooms
- 4,1407 rooms
- 3,0688 rooms
- 3,3969+ rooms
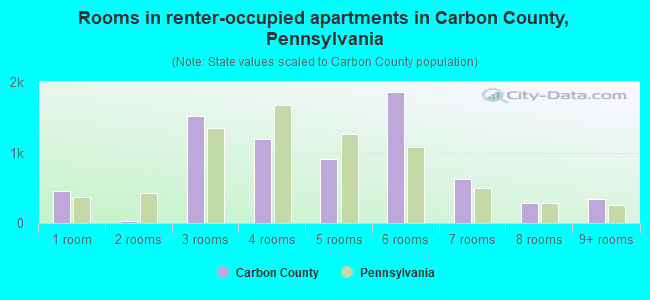
- Rooms in renter-occupied apartments in Carbon County, Pennsylvania
- 1771 room
- 2182 rooms
- 3983 rooms
- 8244 rooms
- 1,6995 rooms
- 9056 rooms
- 9667 rooms
- 2108 rooms
- 1,0239+ rooms
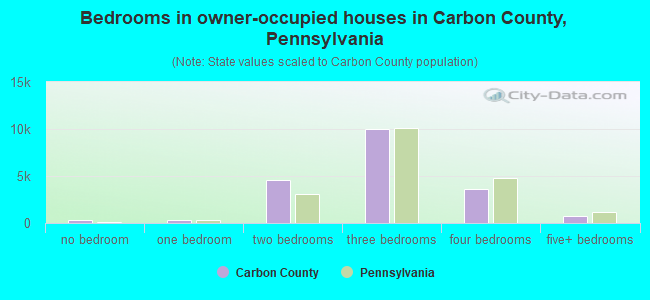
- Bedrooms in owner-occupied houses in Carbon County, Pennsylvania
- 199no bedroom
- 4461 bedroom
- 4,7082 bedrooms
- 11,3093 bedrooms
- 3,9664 bedrooms
- 9185+ bedrooms

- Bedrooms in renter-occupied apartments in Carbon County, Pennsylvania
- 177no bedroom
- 1,1271 bedroom
- 1,6212 bedrooms
- 2,4113 bedrooms
- 8794 bedrooms
- 2055+ bedrooms
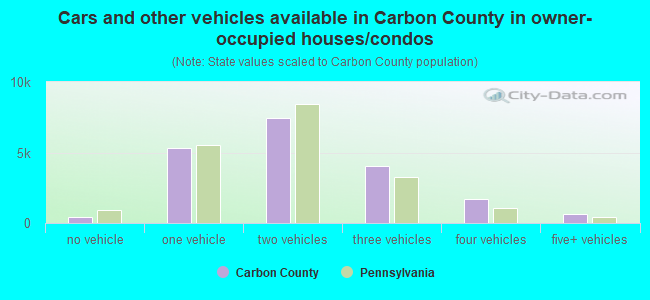
- Cars and other vehicles available in Carbon County in owner-occupied houses/condos
- 630no vehicle
- 5,9511 vehicle
- 7,9152 vehicles
- 5,0743 vehicles
- 1,6194 vehicles
- 3575+ vehicles
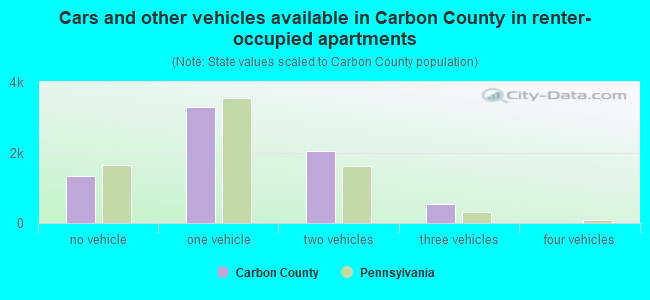
- Cars and other vehicles available in Carbon County in renter-occupied apartments
- 738no vehicle
- 2,9031 vehicle
- 1,6122 vehicles
- 7013 vehicles
- 1274 vehicles
- 3395+ vehicles
91.0% of Carbon County residents lived in the same house 1 years ago.
Out of people who lived in different houses, 29% lived in this county.
Out of people who lived in different counties, 74% lived in Pennsylvania.
| Carbon County: | 91.0% |
| State average: | 89.3% |
Place of birth for U.S.-born residents:
- This state: 52,060
- Other state: 10,433
- Northeast: 6,412
- Midwest: 1,743
- South: 1,698
- West: 580
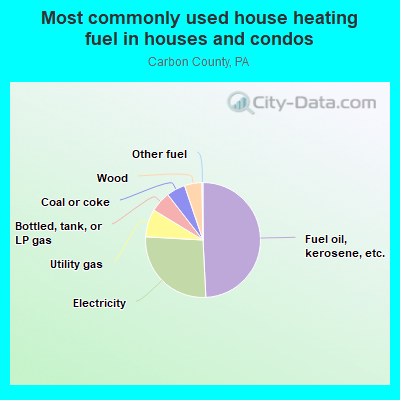
- 44.1%Fuel oil, kerosene, etc.
- 27.3%Electricity
- 13.9%Utility gas
- 5.4%Coal or coke
- 5.0%Bottled, tank, or LP gas
- 2.8%Wood
- 0.9%Other fuel
- 0.5%No fuel used
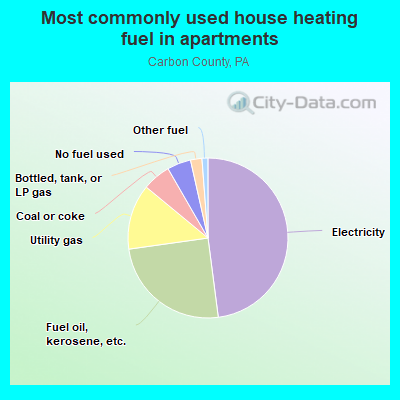
- 52.7%Electricity
- 22.8%Fuel oil, kerosene, etc.
- 9.2%Utility gas
- 5.8%Other fuel
- 4.9%Coal or coke
- 4.6%Bottled, tank, or LP gas
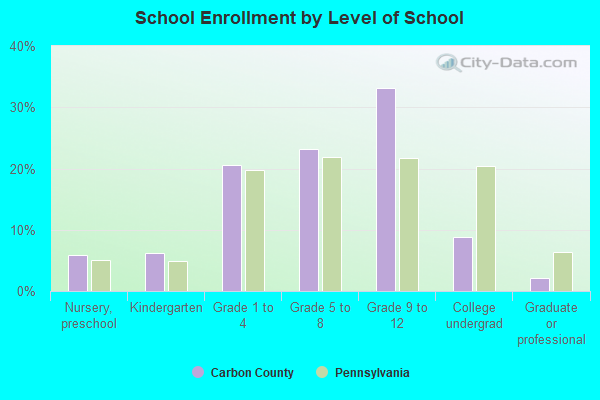
Private vs. public school enrollment:
| Here: | 7.7% |
| Pennsylvania: | 15.7% |
| Here: | 12.3% |
| Pennsylvania: | 13.4% |
| Here: | 27.0% |
| Pennsylvania: | 39.8% |
Carbon County government finances - Expenditure in 2018:
- Bond Funds - Cash and Securities: $9,086,000
- Charges - Other: $4,709,000
Parks and Recreation: $451,000
Parking Facilities: $429,000
- Construction - Central Staff Services: $1,309,000
Regular Highways: $614,000
- Current Operations - Public Welfare - Other: $7,381,000
Judicial and Legal Services: $7,148,000
Correctional Institutions: $4,972,000
Central Staff Services: $4,804,000
General - Other: $2,464,000
Housing and Community Development: $2,364,000
Financial Administration: $1,741,000
Corrections - Other: $1,648,000
Parks and Recreation: $621,000
Parking Facilities: $312,000
General Public Buildings: $207,000
Regular Highways: $185,000
Natural Resources - Other: $38,000
- General - Interest on Debt: $451,000
- Long Term Debt - Beginning Outstanding - Unspecified Public Purpose: $12,686,000
Outstanding Unspecified Public Purpose: $12,319,000
Retired Unspecified Public Purpose: $4,612,000
Issue, Unspecified Public Purpose: $4,245,000
- Miscellaneous - Fines and Forfeits: $2,210,000
General Revenue - Other: $515,000
Interest Earnings: $268,000
Donations From Private Sources: $176,000
Rents: $9,000
Sale of Property: $8,000
- Other Capital Outlay - Regular Highways: $57,000
- Other Funds - Cash and Securities: $18,554,000
- Sinking Funds - Cash and Securities: $1,315,000
- State Intergovernmental - Public Welfare: $7,538,000
Other: $5,793,000
General Local Government Support: $752,000
Housing and Community Development: $629,000
Highways: $340,000
- Tax - Property: $17,152,000
Other Selective Sales: $714,000
- Total Salaries and Wages: $12,643,000
Carbon County government finances - Revenue in 2018:
- Bond Funds - Cash and Securities: $9,086,000
- Charges - Other: $4,709,000
Parks and Recreation: $451,000
Parking Facilities: $429,000
- Construction - Central Staff Services: $1,309,000
Regular Highways: $614,000
- Current Operations - Public Welfare - Other: $7,381,000
Judicial and Legal Services: $7,148,000
Correctional Institutions: $4,972,000
Central Staff Services: $4,804,000
General - Other: $2,464,000
Housing and Community Development: $2,364,000
Financial Administration: $1,741,000
Corrections - Other: $1,648,000
Parks and Recreation: $621,000
Parking Facilities: $312,000
General Public Buildings: $207,000
Regular Highways: $185,000
Natural Resources - Other: $38,000
- General - Interest on Debt: $451,000
- Long Term Debt - Beginning Outstanding - Unspecified Public Purpose: $12,686,000
Outstanding Unspecified Public Purpose: $12,319,000
Retired Unspecified Public Purpose: $4,612,000
Issue, Unspecified Public Purpose: $4,245,000
- Miscellaneous - Fines and Forfeits: $2,210,000
General Revenue - Other: $515,000
Interest Earnings: $268,000
Donations From Private Sources: $176,000
Rents: $9,000
Sale of Property: $8,000
- Other Capital Outlay - Regular Highways: $57,000
- Other Funds - Cash and Securities: $18,554,000
- Sinking Funds - Cash and Securities: $1,315,000
- State Intergovernmental - Public Welfare: $7,538,000
Other: $5,793,000
General Local Government Support: $752,000
Housing and Community Development: $629,000
Highways: $340,000
- Tax - Property: $17,152,000
Other Selective Sales: $714,000
- Total Salaries and Wages: $12,643,000
Carbon County government finances - Debt in 2018:
- Bond Funds - Cash and Securities: $9,086,000
- Charges - Other: $4,709,000
Parks and Recreation: $451,000
Parking Facilities: $429,000
- Construction - Central Staff Services: $1,309,000
Regular Highways: $614,000
- Current Operations - Public Welfare - Other: $7,381,000
Judicial and Legal Services: $7,148,000
Correctional Institutions: $4,972,000
Central Staff Services: $4,804,000
General - Other: $2,464,000
Housing and Community Development: $2,364,000
Financial Administration: $1,741,000
Corrections - Other: $1,648,000
Parks and Recreation: $621,000
Parking Facilities: $312,000
General Public Buildings: $207,000
Regular Highways: $185,000
Natural Resources - Other: $38,000
- General - Interest on Debt: $451,000
- Long Term Debt - Beginning Outstanding - Unspecified Public Purpose: $12,686,000
Outstanding Unspecified Public Purpose: $12,319,000
Retired Unspecified Public Purpose: $4,612,000
Issue, Unspecified Public Purpose: $4,245,000
- Miscellaneous - Fines and Forfeits: $2,210,000
General Revenue - Other: $515,000
Interest Earnings: $268,000
Donations From Private Sources: $176,000
Rents: $9,000
Sale of Property: $8,000
- Other Capital Outlay - Regular Highways: $57,000
- Other Funds - Cash and Securities: $18,554,000
- Sinking Funds - Cash and Securities: $1,315,000
- State Intergovernmental - Public Welfare: $7,538,000
Other: $5,793,000
General Local Government Support: $752,000
Housing and Community Development: $629,000
Highways: $340,000
- Tax - Property: $17,152,000
Other Selective Sales: $714,000
- Total Salaries and Wages: $12,643,000
Carbon County government finances - Cash and Securities in 2018:
- Bond Funds - Cash and Securities: $9,086,000
- Charges - Other: $4,709,000
Parks and Recreation: $451,000
Parking Facilities: $429,000
- Construction - Central Staff Services: $1,309,000
Regular Highways: $614,000
- Current Operations - Public Welfare - Other: $7,381,000
Judicial and Legal Services: $7,148,000
Correctional Institutions: $4,972,000
Central Staff Services: $4,804,000
General - Other: $2,464,000
Housing and Community Development: $2,364,000
Financial Administration: $1,741,000
Corrections - Other: $1,648,000
Parks and Recreation: $621,000
Parking Facilities: $312,000
General Public Buildings: $207,000
Regular Highways: $185,000
Natural Resources - Other: $38,000
- General - Interest on Debt: $451,000
- Long Term Debt - Beginning Outstanding - Unspecified Public Purpose: $12,686,000
Outstanding Unspecified Public Purpose: $12,319,000
Retired Unspecified Public Purpose: $4,612,000
Issue, Unspecified Public Purpose: $4,245,000
- Miscellaneous - Fines and Forfeits: $2,210,000
General Revenue - Other: $515,000
Interest Earnings: $268,000
Donations From Private Sources: $176,000
Rents: $9,000
Sale of Property: $8,000
- Other Capital Outlay - Regular Highways: $57,000
- Other Funds - Cash and Securities: $18,554,000
- Sinking Funds - Cash and Securities: $1,315,000
- State Intergovernmental - Public Welfare: $7,538,000
Other: $5,793,000
General Local Government Support: $752,000
Housing and Community Development: $629,000
Highways: $340,000
- Tax - Property: $17,152,000
Other Selective Sales: $714,000
- Total Salaries and Wages: $12,643,000
Supplemental Security Income (SSI) in 2006:
- Total number of recipients: 1,198
- Number of aged recipients: 88
- Number of blind and disabled recipients: 1,110
- Number of recipients under 18: 206
- Number of recipients between 18 and 64: 812
- Number of recipients older than 64: 180
- Number of recipients also receiving OASDI: 455
- Amount of payments (thousands of dollars): 526
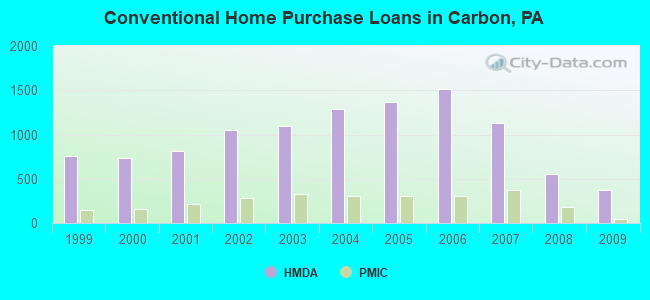
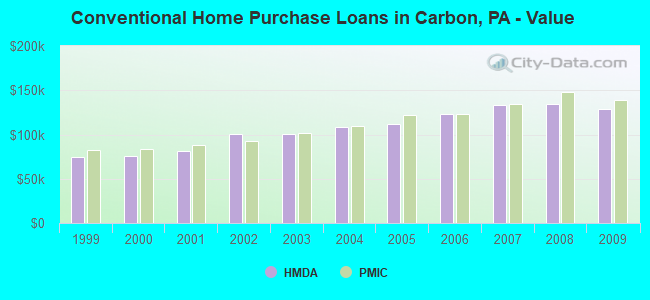
| Home Mortgage Disclosure Act Aggregated Statistics For Year 2009 (Based on 10 full tracts) | ||||||||||||||
| A) FHA, FSA/RHS & VA Home Purchase Loans | B) Conventional Home Purchase Loans | C) Refinancings | D) Home Improvement Loans | E) Loans on Dwellings For 5+ Families | F) Non-occupant Loans on < 5 Family Dwellings (A B C & D) | G) Loans On Manufactured Home Dwelling (A B C & D) | ||||||||
|---|---|---|---|---|---|---|---|---|---|---|---|---|---|---|
| Number | Average Value | Number | Average Value | Number | Average Value | Number | Average Value | Number | Average Value | Number | Average Value | Number | Average Value | |
| LOANS ORIGINATED | 273 | $115,502 | 378 | $129,230 | 1,401 | $129,231 | 261 | $43,483 | 3 | $189,333 | 365 | $135,510 | 33 | $80,030 |
| APPLICATIONS APPROVED, NOT ACCEPTED | 6 | $171,833 | 22 | $108,091 | 122 | $141,795 | 27 | $33,741 | 1 | $132,000 | 32 | $128,562 | 5 | $54,400 |
| APPLICATIONS DENIED | 54 | $137,000 | 102 | $112,471 | 731 | $143,349 | 108 | $45,296 | 1 | $370,000 | 103 | $139,087 | 25 | $62,320 |
| APPLICATIONS WITHDRAWN | 33 | $112,455 | 43 | $121,767 | 367 | $140,613 | 25 | $57,480 | 0 | $0 | 60 | $146,617 | 2 | $153,500 |
| FILES CLOSED FOR INCOMPLETENESS | 8 | $144,250 | 15 | $127,067 | 90 | $139,022 | 9 | $60,222 | 0 | $0 | 18 | $124,944 | 2 | $114,500 |
| Private Mortgage Insurance Companies Aggregated Statistics For Year 2009 (Based on 9 full tracts) | ||||||
| A) Conventional Home Purchase Loans | B) Refinancings | C) Non-occupant Loans on < 5 Family Dwellings (A & B) | ||||
|---|---|---|---|---|---|---|
| Number | Average Value | Number | Average Value | Number | Average Value | |
| LOANS ORIGINATED | 49 | $139,041 | 26 | $151,000 | 7 | $123,429 |
| APPLICATIONS APPROVED, NOT ACCEPTED | 13 | $202,538 | 29 | $197,069 | 6 | $201,667 |
| APPLICATIONS DENIED | 11 | $156,909 | 10 | $193,500 | 4 | $138,250 |
| APPLICATIONS WITHDRAWN | 3 | $172,333 | 7 | $179,000 | 0 | $0 |
| FILES CLOSED FOR INCOMPLETENESS | 4 | $194,250 | 2 | $153,000 | 0 | $0 |
| Most common first names in Carbon County, PA among deceased individuals | ||
| Name | Count | Lived (average) |
|---|---|---|
| Mary | 1,045 | 80.0 years |
| John | 1,017 | 73.9 years |
| Anna | 644 | 80.9 years |
| Joseph | 611 | 74.1 years |
| William | 484 | 74.1 years |
| Helen | 447 | 79.4 years |
| George | 428 | 75.4 years |
| Michael | 348 | 74.7 years |
| Charles | 327 | 74.6 years |
| Robert | 316 | 70.0 years |
| Most common last names in Carbon County, PA among deceased individuals | ||
| Last name | Count | Lived (average) |
|---|---|---|
| Smith | 229 | 73.5 years |
| Miller | 222 | 76.4 years |
| Snyder | 172 | 76.4 years |
| Williams | 106 | 76.7 years |
| Rehrig | 87 | 76.8 years |
| Strohl | 83 | 72.6 years |
| Green | 82 | 74.0 years |
| Christman | 79 | 74.2 years |
| Rex | 73 | 73.4 years |
| Brown | 71 | 75.9 years |
| Businesses in Carbon County, PA | ||||
| Name | Count | Name | Count | |
|---|---|---|---|---|
| AT&T | 1 | La-Z-Boy | 1 | |
| Advance Auto Parts | 1 | Long John Silver's | 2 | |
| Arby's | 2 | MasterBrand Cabinets | 6 | |
| Best Western | 1 | McDonald's | 3 | |
| Burger King | 1 | Payless | 1 | |
| CVS | 2 | Penske | 1 | |
| Comfort Inn | 1 | Pizza Hut | 1 | |
| Curves | 1 | Quiznos | 2 | |
| Dunkin Donuts | 2 | RadioShack | 1 | |
| Econo Lodge | 1 | Rite Aid | 5 | |
| FedEx | 2 | Starbucks | 1 | |
| Ford | 2 | Subway | 7 | |
| GNC | 1 | T-Mobile | 1 | |
| Giant | 1 | True Value | 3 | |
| H&R Block | 3 | U-Haul | 9 | |
| Hilton | 1 | UPS | 2 | |
| Holiday Inn | 1 | Walmart | 1 | |
| Kroger | 3 | |||
Carbon County on our top lists:
- #60 on the list of "Top 101 counties with the highest number of deaths per 1000 residents 2007-2013 (pop. 50,000+)"