Chester County, Tennessee (TN)
County owner-occupied free and clear houses and condos in 2010: 1,909
County owner-occupied houses and condos in 2000: 4,375
Renter-occupied apartments: 1,674 (it was 1,285 in 2000)
| % of renters here: | 23% |
| State: | 32% |
Land area: 289 sq. mi.
Water area: 0.2 sq. mi.
Population density: 61 people per square mile (average).
Industries providing employment: Educational, health and social services (21.7%), Retail trade (21.2%), Manufacturing (20.6%).
Type of workers:
- Private wage or salary: 78%
- Government: 18%
- Self-employed, not incorporated: 4%
- Unpaid family work: 0%
- OSM Map
- General Map
- Google Map
- MSN Map


- 14,84184.2%White Non-Hispanic Alone
- 1,7519.9%Black Non-Hispanic Alone
- 5483.1%Hispanic or Latino
- 3211.8%Two or more races
- 1240.7%Some other race alone
- 310.2%Asian alone

| Median resident age: | 38.3 years |
| Tennessee median age: | 39.2 years |
| Males: 8,535 | |
| Females: 9,177 |

 | COVID-19 in Tennessee (237 replies) |
| Tennessee Population Estimates 2016 (28 replies) |
| Thoughts on Jackson area? (18 replies) |
| Martin Tn (26 replies) |
| Sold property in IL, ready to look near Jackson, TN (40 replies) |
| Amish Store and Sandwich Shop (14 replies) |
| Chester County: | 2.0 people |
| Tennessee: | 2 people |
Estimated median household income in 2022: $58,565 ($34,349 in 1999)
| This county: | $58,565 |
| Tennessee: | $65,254 |
Median contract rent in 2022 for apartments: $507 (lower quartile is $389, upper quartile is $621)
| This county: | $507 |
| State: | $884 |
Estimated median house or condo value in 2022: $167,739 (it was $71,700 in 2000)
| Chester: | $167,739 |
| Tennessee: | $284,800 |
Mean price in 2022:
Median monthly housing costs for homes and condos with a mortgage: $1,122Detached houses: $197,312
Here: $197,312 State: $374,382 Mobile homes: $78,691
Here: $78,691 State: $101,421
Median monthly housing costs for units without a mortgage: $339
Institutionalized population: 167
Crime in 2021 (reported by the sheriff's office or county police, not the county total):
- Murders: 0
- Rapes: 1
- Robberies: 0
- Assaults: 7
- Burglaries: 3
- Thefts: 3
- Auto thefts: 1
Crime in 2020 (reported by the sheriff's office or county police, not the county total):
- Murders: 1
- Rapes: 1
- Robberies: 0
- Assaults: 16
- Burglaries: 12
- Thefts: 17
- Auto thefts: 8

Single-family new house construction building permits:
- 2022: 32 buildings, average cost: $170,100
- 2021: 13 buildings, average cost: $144,400
- 2020: 20 buildings, average cost: $129,500
- 2019: 23 buildings, average cost: $125,600
- 2018: 21 buildings, average cost: $95,900
- 2017: 22 buildings, average cost: $91,300
- 2016: 20 buildings, average cost: $135,000
- 2015: 13 buildings, average cost: $96,600
- 2014: 8 buildings, average cost: $97,500
- 2013: 14 buildings, average cost: $113,000
- 2012: 19 buildings, average cost: $78,600
- 2011: 11 buildings, average cost: $113,600
- 2010: 27 buildings, average cost: $83,000
- 2009: 30 buildings, average cost: $84,900
- 2008: 27 buildings, average cost: $87,700
- 2007: 38 buildings, average cost: $62,000
- 2006: 45 buildings, average cost: $70,600
- 2005: 115 buildings, average cost: $69,400
- 2004: 40 buildings, average cost: $74,700
- 2003: 39 buildings, average cost: $81,500
- 2002: 40 buildings, average cost: $65,000
- 2001: 34 buildings, average cost: $70,100
- 2000: 63 buildings, average cost: $80,000
- 1999: 75 buildings, average cost: $72,400
- 1998: 78 buildings, average cost: $51,300
- 1997: 41 buildings, average cost: $75,800


Median real estate property taxes paid for housing units with mortgages in 2022: $980 (0.5%)
Median real estate property taxes paid for housing units with no mortgage in 2022: $680 (0.5%)


| Chester County: | 15.0% |
| Tennessee: | 13.3% |
Median age of residents in 2022: 38.3 years old
(Males: 38.2 years old, Females: 38.3 years old)
(Median age for: White residents: 40.0 years old, Black residents: 34.7 years old, Asian residents: 18.9 years old, Hispanic or Latino residents: 21.9 years old, Other race residents: 32.3 years old)
Area name: Jackson, TN MSA
Fair market rent in 2006 for a 1-bedroom apartment in Chester County is $470 a month.
Fair market rent for a 2-bedroom apartment is $593 a month.
Fair market rent for a 3-bedroom apartment is $794 a month.
Cities in this county include: West Chester, Henderson, East Chester, Enville.
Neighboring counties: Armstrong County, Texas  , Crockett County
  , Harnett County, North Carolina
  , Loudon County , Deaf Smith County, Texas , Transylvania County, North Carolina .
| Here: | 2.9% |
| Tennessee: | 3.0% |


Current college students: 1,525
People 25 years of age or older with a high school degree or higher: 85.6%
People 25 years of age or older with a bachelor's degree or higher: 16.4%
Number of foreign born residents: 213 (68.5% naturalized citizens)
| Chester County: | 1.2% |
| Whole state: | 5.6% |

- Year of entry for the foreign-born population
- 1012010 or later
- 252000 to 2009
- 711990 to 1999
- 51980 to 1989
- 81970 to 1979
- 3Before 1970
Mean travel time to work (commute): minutes
Percentage of county residents living and working in this county: 98.6%


Housing units in structures:
- One, detached: 5,706
- One, attached: 35
- Two: 240
- 3 or 4: 20
- 5 to 9: 64
- 10 to 19: 62
- 50 or more: 88
- Mobile homes: 1,141
- Boats, RVs, vans, etc.: 35
Housing units in Chester County with a mortgage: 2,667 (107 second mortgage, 0 home equity loan, 75 both second mortgage and home equity loan)
Houses without a mortgage: 35
| Here: | 5.4% with mortgage |
| State: | 97.8% with mortgage |
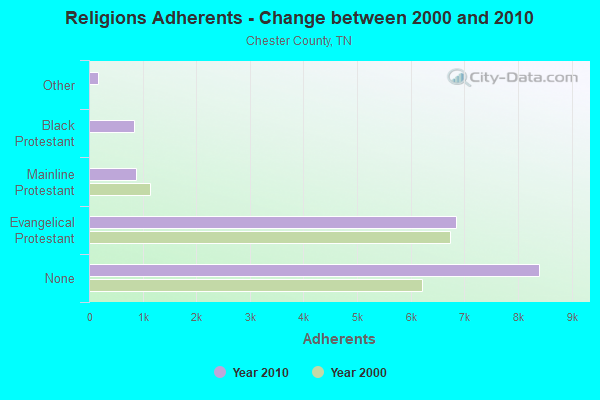
Religion statistics for Chester County
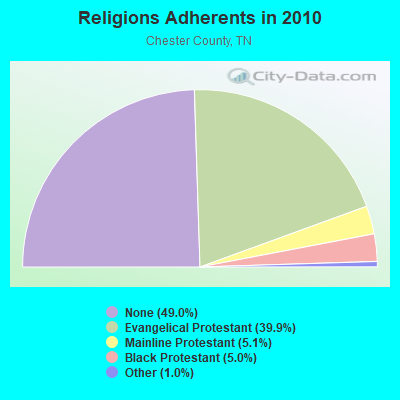
| Religion | Adherents | Congregations |
|---|---|---|
| Evangelical Protestant | 6,837 | 30 |
| Mainline Protestant | 869 | 9 |
| Black Protestant | 848 | 7 |
| Other | 176 | 3 |
| None | 8,401 | - |
Source: Clifford Grammich, Kirk Hadaway, Richard Houseal, Dale E.Jones, Alexei Krindatch, Richie Stanley and Richard H.Taylor. 2012. 2010 U.S.Religion Census: Religious Congregations & Membership Study. Association of Statisticians of American Religious Bodies. Jones, Dale E., et al. 2002. Congregations and Membership in the United States 2000. Nashville, TN: Glenmary Research Center.
Food Environment Statistics:
| Chester County: | 3.11 / 10,000 pop. |
| State: | 1.99 / 10,000 pop. |
| Chester County: | 4.97 / 10,000 pop. |
| Tennessee: | 5.16 / 10,000 pop. |
| This county: | 2.49 / 10,000 pop. |
| State: | 6.56 / 10,000 pop. |
| Chester County: | 13.1% |
| Tennessee: | 11.4% |
| Chester County: | 30.9% |
| State: | 30.2% |
| Here: | 11.3% |
| State: | 13.5% |
Agriculture in Chester County:
Average size of farms: 154 acresAverage value of agricultural products sold per farm: $9,402
Average value of crops sold per acre for harvested cropland: $130.23
The value of nursery, greenhouse, floriculture, and sod as a percentage of the total market value of agricultural products sold: 0.49%
The value of livestock, poultry, and their products as a percentage of the total market value of agricultural products sold: 33.22%
Average total farm production expenses per farm: $11,264
Harvested cropland as a percentage of land in farms: 31.32%
Irrigated harvested cropland as a percentage of land in farms: 0.05%
Average market value of all machinery and equipment per farm: $29,251
The percentage of farms operated by a family or individual: 97.27%
Average age of principal farm operators: 57 years
Average number of cattle and calves per 100 acres of all land in farms: 10.61
Corn for grain: 4824 harvested acres
All wheat for grain: 989 harvested acres
Upland cotton: 1280 harvested acres
Soybeans for beans: 9895 harvested acres
Vegetables: 67 harvested acres
Land in orchards: 8 acres
Earthquake activity:
Chester County-area historical earthquake activity is significantly above Tennessee state average. It is 304% greater than the overall U.S. average.On 3/25/1976 at 00:41:20, a magnitude 5.0 (4.9 MB, 5.0 LG, Class: Moderate, Intensity: VI - VII) earthquake occurred 97.8 miles away from Chester County center
On 5/4/1991 at 01:18:54, a magnitude 5.0 (4.4 MB, 4.6 LG, 5.0 LG, Depth: 3.1 mi) earthquake occurred 104.0 miles away from the county center
On 9/26/1990 at 13:18:51, a magnitude 5.0 (4.7 MB, 4.8 LG, 5.0 LG, Depth: 7.7 mi) earthquake occurred 131.1 miles away from the county center
On 4/18/2008 at 09:36:59, a magnitude 5.4 (5.1 MB, 4.8 MS, 5.4 MW, 5.2 MW) earthquake occurred 213.1 miles away from the county center
On 4/27/1989 at 16:47:49, a magnitude 4.7 (4.6 MB, 4.7 LG, 4.3 LG, Class: Light, Intensity: IV - V) earthquake occurred 76.5 miles away from Chester County center
On 4/18/2008 at 09:36:59, a magnitude 5.2 (5.2 MW, Depth: 8.9 mi) earthquake occurred 213.1 miles away from the county center
Magnitude types: regional Lg-wave magnitude (LG), body-wave magnitude (MB), surface-wave magnitude (MS), moment magnitude (MW)
Most recent natural disasters:
- Tennessee Covid-19 Pandemic, Incident Period: January 20, 2020, FEMA Id: 4514, Natural disaster type: Other
- Tennessee Severe Storms, Tornadoes, Straight-line Winds, and Associated Flooding, Incident Period: April 25, 2011 to April 28, 2011, Major Disaster (Presidential) Declared DR-1974: May 01, 2011, FEMA Id: 1974, Natural disaster type: Storm, Tornado, Flood, Wind
- Tennessee Severe Storms, Flooding, Tornadoes, and Straight-Line Winds, Incident Period: April 04, 2011, Major Disaster (Presidential) Declared DR-1978: May 09, 2011, FEMA Id: 1978, Natural disaster type: Storm, Tornado, Flood, Wind
- Tennessee Severe Storms, Flooding, Straight-Line Winds, and Tornadoes, Incident Period: April 30, 2010 to May 18, 2010, Major Disaster (Presidential) Declared DR-1909: May 04, 2010, FEMA Id: 1909, Natural disaster type: Storm, Tornado, Flood, Wind
- Tennessee Severe Storms and Flooding, Incident Period: July 15, 2009 to July 17, 2009, Major Disaster (Presidential) Declared DR-1856: August 21, 2009, FEMA Id: 1856, Natural disaster type: Storm, Flood
- Tennessee Hurricane Katrina Evacuation, Incident Period: August 29, 2005 to October 01, 2005, Emergency Declared EM-3217: September 05, 2005, FEMA Id: 3217, Natural disaster type: Hurricane
- Tennessee Severe Storms, Tornadoes and Flooding, Incident Period: May 04, 2003 to May 30, 2003, Major Disaster (Presidential) Declared DR-1464: May 08, 2003, FEMA Id: 1464, Natural disaster type: Storm, Tornado, Flood
- Tennessee Severe Storms, Tornadoes and Flooding, Incident Period: May 05, 1999 to May 19, 1999, Major Disaster (Presidential) Declared DR-1275: May 12, 1999, FEMA Id: 1275, Natural disaster type: Storm, Tornado, Flood
- Tennessee Severe Storms and Flooding, Incident Period: January 06, 1998 to February 12, 1998, Major Disaster (Presidential) Declared DR-1197: January 13, 1998, FEMA Id: 1197, Natural disaster type: Storm, Flood
- Tennessee Severe Storms/Flooding, Incident Period: February 28, 1997 to March 24, 1997, Major Disaster (Presidential) Declared DR-1167: March 07, 1997, FEMA Id: 1167, Natural disaster type: Storm, Flood
- 2 other natural disasters have been reported since 1953.
The number of natural disasters in Chester County (12) is smaller than the US average (15).
Major Disasters (Presidential) Declared: 10
Emergencies Declared: 1
Causes of natural disasters: Floods: 9, Storms: 9, Tornadoes: 5, Winds: 3, Flash Flood: 1, Hurricane: 1, Ice Storm: 1, Winter Storm: 1, Other: 1 (Note: some incidents may be assigned to more than one category).

Means of transportation to work:
- Drove a car alone: 3,366 (75.5%)
- Carpooled: 295 (6.6%)
- Taxicab, motorcycle, or other means: 17 (0.4%)
- Bicycle: 24 (0.5%)
- Walked: 128 (2.9%)
- Worked at home: 635 (14.2%)


- Retail trade (25%)
- Health care and social assistance (23%)
- Educational services (10%)
- Manufacturing (7%)
- Other services, except public administration (5%)
- Accommodation and food services (5%)
- Public administration (5%)

- Retail trade (27%)
- Health care and social assistance (25%)
- Educational services (11%)
- Manufacturing (7%)
- Other services, except public administration (6%)
- Accommodation and food services (5%)
- Public administration (5%)

- Production occupations (27%)
- Sales and related occupations (12%)
- Installation, maintenance, and repair occupations (9%)
- Management occupations (7%)
- Material moving occupations (6%)
- Construction and extraction occupations (6%)
- Law enforcement workers including supervisors (5%)

- Office and administrative support occupations (19%)
- Sales and related occupations (14%)
- Health diagnosing and treating practitioners and other technical occupations (8%)
- Healthcare support occupations (7%)
- Production occupations (7%)
- Food preparation and serving related occupations (6%)
- Educational instruction, and library occupations (6%)

- Venezuela (84%)
- Honduras (23%)
- Canada (20%)
- Germany (12%)
- Philippines (2%)
- China, excluding Hong Kong and Taiwan (1%)
- Malaysia (0%)

- American (19%)
- Irish (13%)
- English (9%)
- African (8%)
- European (8%)
- German (7%)
- Italian (5%)


People in group quarters in Chester County, Tennessee in 2010:
- 1,087 people in college/university student housing
- 127 people in nursing facilities/skilled-nursing facilities
- 23 people in local jails and other municipal confinement facilities
- 10 people in residential treatment centers for juveniles (non-correctional)
- 8 people in workers' group living quarters and job corps centers
- 7 people in correctional facilities intended for juveniles
People in group quarters in Chester County, Tennessee in 2000:
- 935 people in college dormitories (includes college quarters off campus)
- 136 people in nursing homes
- 25 people in local jails and other confinement facilities (including police lockups)
- 25 people in other noninstitutional group quarters
7.81% of this county's 2021 resident taxpayers lived in other counties in 2020 ($51,828 average adjusted gross income)
| Here: | 7.81% |
| Tennessee average: | 8.49% |
10 or fewer of this county's residents moved from foreign countries.
5.53% relocated from other counties in Tennessee ($35,225 average AGI)
2.29% relocated from other states ($16,603 average AGI)
Chester County: 2.29% Tennessee average: 4.34%

Top counties from which taxpayers relocated into this county between 2020 and 2021:
| from Madison County, TN | |
| from Henderson County, TN | |
| from McNairy County, TN |
7.16% of this county's 2020 resident taxpayers moved to other counties in 2021 ($39,835 average adjusted gross income)
| Here: | 7.16% |
| Tennessee average: | 7.40% |
10 or fewer of this county's residents moved to foreign countries.
5.74% relocated to other counties in Tennessee ($31,314 average AGI)
1.43% relocated to other states ($8,520 average AGI)
Chester County: 1.43% Tennessee average: 3.20%

Top counties to which taxpayers relocated from this county between 2020 and 2021:
| to Madison County, TN | |
| to McNairy County, TN | |
| to Henderson County, TN |
Births per 1000 population from 1990 to 1999: 12.2
Births per 1000 population from 2000 to 2006: 11.5

Deaths per 1000 population from 1990 to 1999: 9.8
Deaths per 1000 population from 2000 to 2009: 9.5
Deaths per 1000 population from 2010 to 2020: 11.0

Infant deaths per 1000 live births from 1990 to 1999: 7.5
Infant deaths per 1000 live births from 2000 to 2006: 11.1

Persons under 19 years old without health insurance coverage in 2018: 5.4%


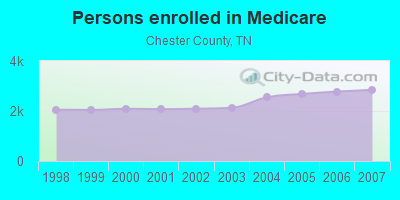
Persons enrolled in hospital insurance and/or supplemental medical insurance (Medicare) in July 1, 2007: 2,847 (2,251 aged, 596 disabled)
Children under 18 without health insurance coverage in 2007: 340 (9%)


Most common underlying causes of death in Chester County, Tennessee in 1999 - 2019:
- Acute myocardial infarction, unspecified (366)
- Atherosclerotic heart disease (156)
- Bronchus or lung, unspecified - Malignant neoplasms (153)
- Chronic obstructive pulmonary disease, unspecified (34)
- Alzheimer disease, unspecified (28)
Population without health insurance coverage in 2000: 13%
Children under 18 without health insurance coverage in 2000: 8%
Medical specialist MDs per 100,000 population in 2005: 834
Total births per 100,000 population, July 2005 - July 2006 : 20
Total deaths per 100,000 population, July 2005 - July 2006: 69
Limited-service eating places per 100,000 population in 2005 : 6
Household type by relationship:
Households: 17,712- Male householders: 3,486 (930 living alone), Female householders: 2,912 (737 living alone)
3,413 spouses (3,348 opposite-sex spouses), 298 unmarried partners, (275 opposite-sex unmarried partners), 4,637 children (4,154 natural, 124 adopted, 349 stepchildren), 615 grandchildren, 11 brothers or sisters, 439 parents, 15 foster children, 91 other relatives, 411 non-relatives
- In group quarters: 1,255
Size of family households: 1,994 2-persons, 751 3-persons, 1,201 4-persons, 404 5-persons, 53 6-persons, 47 7-or-more-persons.
Size of nonfamily households: 1,661 1-person, 252 2-persons, 10 3-persons, 19 4-persons.
2,262 married couples with children.
931 single-parent households (331 men, 600 women).
98.0% of residents of Chester speak English at home.
1.2% of residents speak Spanish at home (42% speak English very well, 34% speak English well, 25% speak English not well).
0.2% of residents speak other Indo-European language at home (100% speak English very well).
0.2% of residents speak Asian or Pacific Island language at home (69% speak English very well, 31% speak English well).
0.2% of residents speak other language at home (100% speak English very well).
In fiscal year 2004:
Federal Government expenditure: $86,681,000 ($5,496 per capita)
Department of Defense expenditure: $4,735,000
Federal direct payments to individuals for retirement and disability: $31,495,000
Federal other direct payments to individuals: $18,866,000
Federal direct payments not to individuals: $863,000
Federal grants: $31,275,000
Federal procurement contracts: $305,000 ($7,000 Department of Defense)
Federal salaries and wages: $3,877,000 ($2,746,000 Department of Defense)
Federal Government direct loans: $176,000
Federal guaranteed/insured loans: $6,174,000
Federal Government insurance: $1,975,000
Population change from April 1, 2000 to July 1, 2005:
Births: 969| Here: | 61 per 1000 residents |
| State: | 69 per 1000 residents |
Deaths: 805
| Here: | 50 per 1000 residents |
| State: | 50 per 1000 residents |
Net international migration: +32
| Here: | +2 per 1000 residents |
| State: | +8 per 1000 residents |
Net internal migration: +235
| Here: | +15 per 1000 residents |
| State: | +18 per 1000 residents |

Total withdrawal of fresh water for public supply: 1.15 millions of gallons per day (all from ground)
| Here: | 6.1 |
| State: | 6.5 |
| Here: | 4.2 |
| State: | 4.4 |

- Year house built in Chester County, Tennessee
- 82020 or later
- 8212010 to 2019
- 1,4452000 to 2009
- 1,4351990 to 1999
- 1,2211980 to 1989
- 8991970 to 1979
- 4841960 to 1969
- 3781950 to 1959
- 3161940 to 1949
- 2541939 or earlier

- Rooms in owner-occupied houses in Chester County, Tennessee
- 01 room
- 632 rooms
- 473 rooms
- 2874 rooms
- 1,0885 rooms
- 1,5816 rooms
- 7967 rooms
- 4428 rooms
- 5789+ rooms

- Rooms in renter-occupied apartments in Chester County, Tennessee
- 291 room
- 182 rooms
- 3453 rooms
- 4444 rooms
- 4115 rooms
- 636 rooms
- 907 rooms
- 128 rooms
- 659+ rooms

- Bedrooms in owner-occupied houses in Chester County, Tennessee
- 8no bedroom
- 991 bedroom
- 5402 bedrooms
- 3,2043 bedrooms
- 9084 bedrooms
- 1515+ bedrooms

- Bedrooms in renter-occupied apartments in Chester County, Tennessee
- 30no bedroom
- 971 bedroom
- 9642 bedrooms
- 2863 bedrooms
- 1134 bedrooms
- 05+ bedrooms

- Cars and other vehicles available in Chester County in owner-occupied houses/condos
- 75no vehicle
- 9301 vehicle
- 2,1562 vehicles
- 8183 vehicles
- 7624 vehicles
- 1725+ vehicles

- Cars and other vehicles available in Chester County in renter-occupied apartments
- 167no vehicle
- 6751 vehicle
- 5202 vehicles
- 1163 vehicles
- 04 vehicles
- 05+ vehicles
93.7% of Chester County residents lived in the same house 1 years ago.
Out of people who lived in different houses, 15% lived in this county.
Out of people who lived in different counties, 59% lived in Tennessee.
| Chester County: | 93.7% |
| State average: | 87.0% |
Place of birth for U.S.-born residents:
- This state: 12,609
- Other state: 4,715
- Northeast: 453
- Midwest: 1,417
- South: 2,355
- West: 472


- 53.4%Utility gas
- 37.4%Electricity
- 7.4%Bottled, tank, or LP gas
- 0.9%Wood
- 0.8%Fuel oil, kerosene, etc.

- 71.0%Electricity
- 24.5%Utility gas
- 4.3%Bottled, tank, or LP gas
- 0.1%Wood
Private vs. public school enrollment:
| Here: | 5.3% |
| Tennessee: | 15.0% |
| Here: | 0.4% |
| Tennessee: | 16.2% |
| Here: | 90.5% |
| Tennessee: | 23.5% |


Chester County government finances - Expenditure in 2017:
- Charges - Elementary and Secondary Education - Other: $1,074,000
Solid Waste Management: $322,000
Elementary and Secondary Education School Lunch: $318,000
Elementary and Secondary Education School Tuition and Transportation: $36,000
- Construction - Elementary and Secondary Education: $221,000
- Current Operations - Elementary and Secondary Education: $23,236,000
Solid Waste Management: $1,731,000
Police Protection: $1,590,000
Correctional Institutions: $1,347,000
Regular Highways: $849,000
Financial Administration: $783,000
Judicial and Legal Services: $618,000
General Public Buildings: $448,000
Central Staff Services: $436,000
Health - Other: $381,000
Local Fire Protection: $135,000
Libraries: $106,000
Natural Resources - Other: $51,000
- General - Interest on Debt: $366,000
- Local Intergovernmental - Education: $15,000
- Long Term Debt - Beginning Outstanding - Unspecified Public Purpose: $9,150,000
Outstanding Unspecified Public Purpose: $8,780,000
Retired Unspecified Public Purpose: $370,000
- Miscellaneous - General Revenue - Other: $2,122,000
Fines and Forfeits: $83,000
Interest Earnings: $41,000
Sale of Property: $8,000
- Other Capital Outlay - Elementary and Secondary Education: $525,000
- Other Funds - Cash and Securities: $4,766,000
- Short Term Debt Outstanding - Beginning: $256,000
End of Fiscal Year: $194,000
- State Intergovernmental - Education: $20,212,000
Highways: $3,815,000
- Tax - Property: $4,065,000
Motor Vehicle License: $813,000
Public Utilities Sales: $273,000
General Sales and Gross Receipts: $164,000
Alcoholic Beverage Sales: $60,000
- Total Salaries and Wages: $14,737,000
Chester County government finances - Revenue in 2017:
- Charges - Elementary and Secondary Education - Other: $1,074,000
Solid Waste Management: $322,000
Elementary and Secondary Education School Lunch: $318,000
Elementary and Secondary Education School Tuition and Transportation: $36,000
- Construction - Elementary and Secondary Education: $221,000
- Current Operations - Elementary and Secondary Education: $23,236,000
Solid Waste Management: $1,731,000
Police Protection: $1,590,000
Correctional Institutions: $1,347,000
Regular Highways: $849,000
Financial Administration: $783,000
Judicial and Legal Services: $618,000
General Public Buildings: $448,000
Central Staff Services: $436,000
Health - Other: $381,000
Local Fire Protection: $135,000
Libraries: $106,000
Natural Resources - Other: $51,000
- General - Interest on Debt: $366,000
- Local Intergovernmental - Education: $15,000
- Long Term Debt - Beginning Outstanding - Unspecified Public Purpose: $9,150,000
Outstanding Unspecified Public Purpose: $8,780,000
Retired Unspecified Public Purpose: $370,000
- Miscellaneous - General Revenue - Other: $2,122,000
Fines and Forfeits: $83,000
Interest Earnings: $41,000
Sale of Property: $8,000
- Other Capital Outlay - Elementary and Secondary Education: $525,000
- Other Funds - Cash and Securities: $4,766,000
- Short Term Debt Outstanding - Beginning: $256,000
End of Fiscal Year: $194,000
- State Intergovernmental - Education: $20,212,000
Highways: $3,815,000
- Tax - Property: $4,065,000
Motor Vehicle License: $813,000
Public Utilities Sales: $273,000
General Sales and Gross Receipts: $164,000
Alcoholic Beverage Sales: $60,000
- Total Salaries and Wages: $14,737,000
Chester County government finances - Debt in 2017:
- Charges - Elementary and Secondary Education - Other: $1,074,000
Solid Waste Management: $322,000
Elementary and Secondary Education School Lunch: $318,000
Elementary and Secondary Education School Tuition and Transportation: $36,000
- Construction - Elementary and Secondary Education: $221,000
- Current Operations - Elementary and Secondary Education: $23,236,000
Solid Waste Management: $1,731,000
Police Protection: $1,590,000
Correctional Institutions: $1,347,000
Regular Highways: $849,000
Financial Administration: $783,000
Judicial and Legal Services: $618,000
General Public Buildings: $448,000
Central Staff Services: $436,000
Health - Other: $381,000
Local Fire Protection: $135,000
Libraries: $106,000
Natural Resources - Other: $51,000
- General - Interest on Debt: $366,000
- Local Intergovernmental - Education: $15,000
- Long Term Debt - Beginning Outstanding - Unspecified Public Purpose: $9,150,000
Outstanding Unspecified Public Purpose: $8,780,000
Retired Unspecified Public Purpose: $370,000
- Miscellaneous - General Revenue - Other: $2,122,000
Fines and Forfeits: $83,000
Interest Earnings: $41,000
Sale of Property: $8,000
- Other Capital Outlay - Elementary and Secondary Education: $525,000
- Other Funds - Cash and Securities: $4,766,000
- Short Term Debt Outstanding - Beginning: $256,000
End of Fiscal Year: $194,000
- State Intergovernmental - Education: $20,212,000
Highways: $3,815,000
- Tax - Property: $4,065,000
Motor Vehicle License: $813,000
Public Utilities Sales: $273,000
General Sales and Gross Receipts: $164,000
Alcoholic Beverage Sales: $60,000
- Total Salaries and Wages: $14,737,000
Chester County government finances - Cash and Securities in 2017:
- Charges - Elementary and Secondary Education - Other: $1,074,000
Solid Waste Management: $322,000
Elementary and Secondary Education School Lunch: $318,000
Elementary and Secondary Education School Tuition and Transportation: $36,000
- Construction - Elementary and Secondary Education: $221,000
- Current Operations - Elementary and Secondary Education: $23,236,000
Solid Waste Management: $1,731,000
Police Protection: $1,590,000
Correctional Institutions: $1,347,000
Regular Highways: $849,000
Financial Administration: $783,000
Judicial and Legal Services: $618,000
General Public Buildings: $448,000
Central Staff Services: $436,000
Health - Other: $381,000
Local Fire Protection: $135,000
Libraries: $106,000
Natural Resources - Other: $51,000
- General - Interest on Debt: $366,000
- Local Intergovernmental - Education: $15,000
- Long Term Debt - Beginning Outstanding - Unspecified Public Purpose: $9,150,000
Outstanding Unspecified Public Purpose: $8,780,000
Retired Unspecified Public Purpose: $370,000
- Miscellaneous - General Revenue - Other: $2,122,000
Fines and Forfeits: $83,000
Interest Earnings: $41,000
Sale of Property: $8,000
- Other Capital Outlay - Elementary and Secondary Education: $525,000
- Other Funds - Cash and Securities: $4,766,000
- Short Term Debt Outstanding - Beginning: $256,000
End of Fiscal Year: $194,000
- State Intergovernmental - Education: $20,212,000
Highways: $3,815,000
- Tax - Property: $4,065,000
Motor Vehicle License: $813,000
Public Utilities Sales: $273,000
General Sales and Gross Receipts: $164,000
Alcoholic Beverage Sales: $60,000
- Total Salaries and Wages: $14,737,000
Supplemental Security Income (SSI) in 2006:
- Total number of recipients: 410
- Number of aged recipients: 65
- Number of blind and disabled recipients: 345
- Number of recipients under 18: 49
- Number of recipients between 18 and 64: 245
- Number of recipients older than 64: 116
- Number of recipients also receiving OASDI: 178
- Amount of payments (thousands of dollars): 184
| Most common first names in Chester County, TN among deceased individuals | ||
| Name | Count | Lived (average) |
|---|---|---|
| James | 107 | 73.5 years |
| Mary | 103 | 81.2 years |
| William | 98 | 72.1 years |
| John | 95 | 76.5 years |
| Robert | 76 | 76.5 years |
| Willie | 47 | 77.2 years |
| Joe | 34 | 76.3 years |
| Thomas | 31 | 76.2 years |
| Charles | 24 | 69.0 years |
| Ruby | 23 | 80.8 years |
| Most common last names in Chester County, TN among deceased individuals | ||
| Last name | Count | Lived (average) |
|---|---|---|
| Smith | 107 | 76.3 years |
| Johnson | 68 | 76.4 years |
| Jones | 48 | 72.2 years |
| Davis | 42 | 75.8 years |
| Ross | 37 | 76.1 years |
| Morris | 30 | 78.9 years |
| Moore | 28 | 75.9 years |
| Young | 27 | 76.3 years |
| Thomas | 26 | 77.1 years |
| Plunk | 25 | 74.2 years |
| Businesses in Chester County, TN | ||||
| Name | Count | Name | Count | |
|---|---|---|---|---|
| AutoZone | 1 | McDonald's | 1 | |
| Baskin-Robbins | 1 | Pizza Hut | 1 | |
| Burger King | 1 | RadioShack | 1 | |
| Chevrolet | 1 | SONIC Drive-In | 1 | |
| Domino's Pizza | 1 | Sears | 1 | |
| FedEx | 1 | Subway | 1 | |
| Ford | 1 | Taco Bell | 1 | |
| H&R Block | 1 | U-Haul | 1 | |
| La-Z-Boy | 1 | UPS | 1 | |