Cumberland County, Virginia (VA)
County owner-occupied free and clear houses and condos in 2010: 1,118
County owner-occupied houses and condos in 2000: 2,723
Renter-occupied apartments: 988 (it was 805 in 2000)
| % of renters here: | 23% |
| State: | 33% |
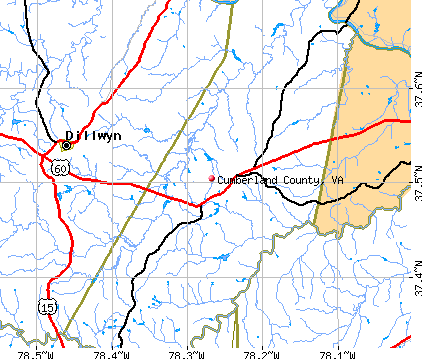
Land area: 298 sq. mi.
Water area: 1.3 sq. mi.
Population density: 33 people per square mile (low).
Industries providing employment: Educational, health and social services (23.9%), Construction (14.5%), Public administration (12.7%), Retail trade (10.3%).
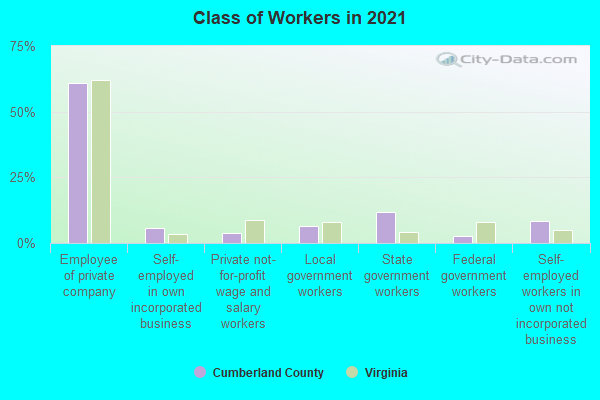
Type of workers:
- Private wage or salary: 67%
- Government: 23%
- Self-employed, not incorporated: 9%
- Unpaid family work: 0%
- OSM Map
- General Map
- Google Map
- MSN Map

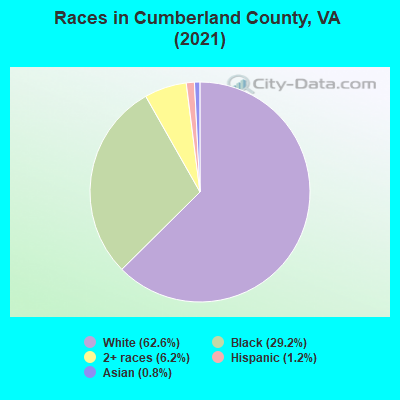
- 6,08862.9%White Non-Hispanic Alone
- 2,89830.0%Black Non-Hispanic Alone
- 4734.9%Two or more races
- 1191.2%Hispanic or Latino
- 810.8%Asian alone
- 120.1%Native Hawaiian and Other
Pacific Islander alone - 40.04%American Indian and Alaska Native alone
| Median resident age: | 46.7 years |
| Virginia median age: | 39.0 years |
| Males: 4,921 | |
| Females: 4,842 |

 | Most important city in Virginia? (31 replies) |
| Looking to move from CT to VA (10 replies) |
| I cant think of anything negative to post (29 replies) |
| cumberland va (3 replies) |
| Want to get the H outta NoVA - but where to go? (44 replies) |
| Need some help on where to raise a family (9 replies) |
| Cumberland County: | 2.0 people |
| Virginia: | 3 people |
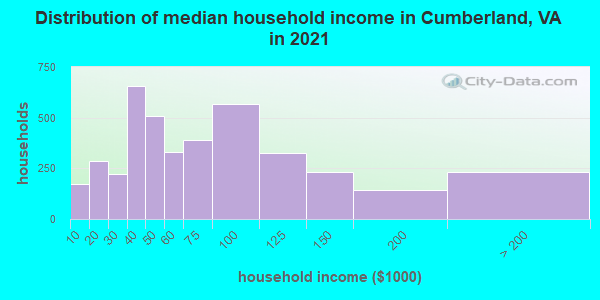
Estimated median household income in 2022: $55,605 ($31,816 in 1999)
| This county: | $55,605 |
| Virginia: | $85,873 |
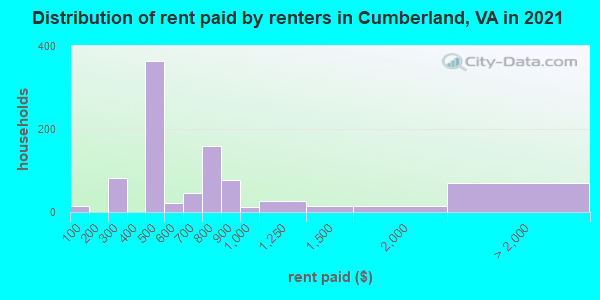
Median contract rent in 2022 for apartments: $645 (lower quartile is $473, upper quartile is $845)
| This county: | $645 |
| State: | $1270 |
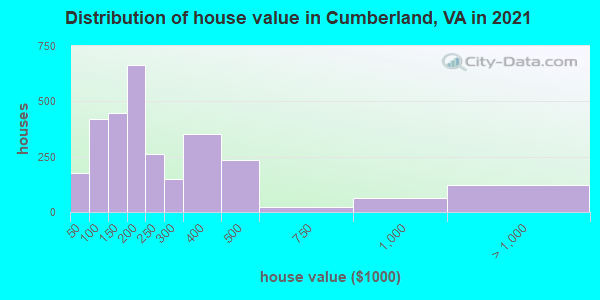
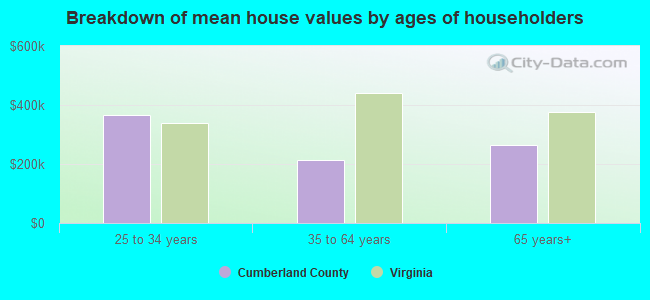
Estimated median house or condo value in 2022: $224,500 (it was $76,600 in 2000)
| Cumberland: | $224,500 |
| Virginia: | $365,700 |
Median monthly housing costs for homes and condos with a mortgage: $1,267
Median monthly housing costs for units without a mortgage: $478
Institutionalized population: 0
Crime in 2021 (reported by the sheriff's office or county police, not the county total):
- Murders: 0
- Rapes: 4
- Robberies: 1
- Assaults: 9
- Burglaries: 7
- Thefts: 30
- Auto thefts: 5
Crime in 2020 (reported by the sheriff's office or county police, not the county total):
- Murders: 0
- Rapes: 4
- Robberies: 0
- Assaults: 18
- Burglaries: 7
- Thefts: 33
- Auto thefts: 2
Health of residents in Cumberland County based on CDC Behavioral Risk Factor Surveillance System Survey Questionnaires from 2013 to 2021:
General health status score of residents in this county from 1 (poor) to 5 (excellent) is 3.5. This is about average.73.5% of residents exercised in the past month. This is about average.
42.1% of residents smoked 100+ cigarettes in their lives. This is about average.
54.8% of adult residents drank alcohol in the past 30 days. This is less than average.
74.3% of residents visited a dentist within the past year. This is about average.
Average weight of males is 200 pounds. This is more than average.
Average weight of females is 167 pounds. This is more than average.
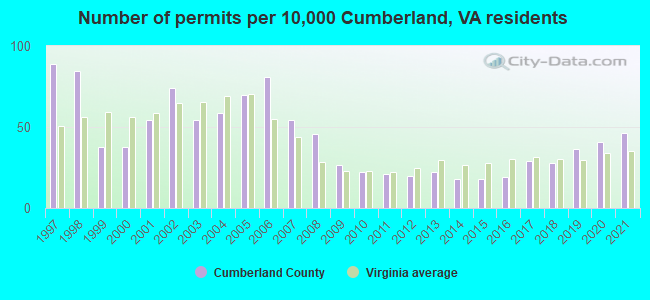
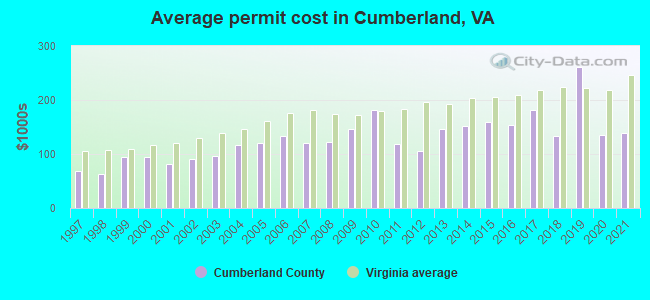
Single-family new house construction building permits:
- 2022: 54 buildings, average cost: $229,800
- 2021: 42 buildings, average cost: $139,300
- 2020: 37 buildings, average cost: $135,900
- 2019: 33 buildings, average cost: $261,200
- 2018: 25 buildings, average cost: $133,800
- 2017: 26 buildings, average cost: $182,400
- 2016: 17 buildings, average cost: $154,400
- 2015: 16 buildings, average cost: $160,400
- 2014: 16 buildings, average cost: $152,000
- 2013: 20 buildings, average cost: $145,800
- 2012: 18 buildings, average cost: $104,600
- 2011: 19 buildings, average cost: $118,700
- 2010: 20 buildings, average cost: $180,500
- 2009: 24 buildings, average cost: $146,300
- 2008: 41 buildings, average cost: $121,800
- 2007: 49 buildings, average cost: $121,400
- 2006: 73 buildings, average cost: $132,600
- 2005: 63 buildings, average cost: $119,800
- 2004: 53 buildings, average cost: $116,800
- 2003: 49 buildings, average cost: $96,200
- 2002: 67 buildings, average cost: $89,500
- 2001: 49 buildings, average cost: $82,300
- 2000: 34 buildings, average cost: $94,200
- 1999: 34 buildings, average cost: $95,300
- 1998: 76 buildings, average cost: $62,500
- 1997: 80 buildings, average cost: $68,400
Median real estate property taxes paid for housing units with mortgages in 2022: $1,392 (0.6%)
Median real estate property taxes paid for housing units with no mortgage in 2022: $1,301 (0.6%)
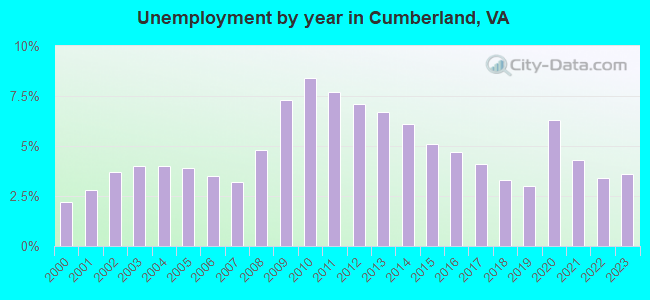
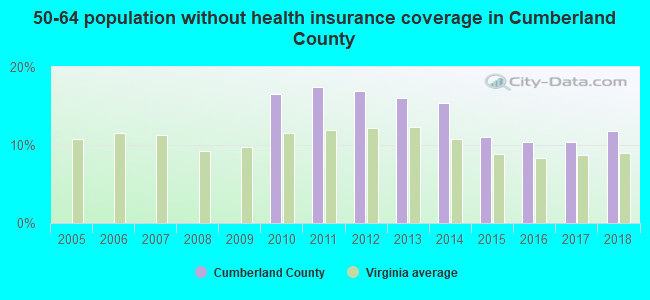
| Cumberland County: | 8.4% |
| Virginia: | 10.6% |
Median age of residents in 2022: 46.7 years old
(Males: 45.8 years old, Females: 47.9 years old)
(Median age for: White residents: 48.4 years old, Black residents: 48.8 years old, Asian residents: 36.9 years old, Hispanic or Latino residents: 17.9 years old)
Area name: Richmond, VA HUD Metro FMR Area
Fair market rent in 2006 for a 1-bedroom apartment in Cumberland County is $678 a month.
Fair market rent for a 2-bedroom apartment is $757 a month.
Fair market rent for a 3-bedroom apartment is $1010 a month.
Cities in this county include: Cumberland.
Notable locations in this county outside city limits:
Notable locations in Cumberland County: Haysi Volunteer Rescue Squad (A), Haysi Volunteer Fire Department (B), Nickelsville Rescue Squad (C), Cleveland Volunteer Fire Department (D), Belfast Rosedale Volunteer Fire Department (E), Dante Volunteer Fire Department (F), Copper Creek Maccasin Volunteer Fire Department (G), Saint Paul Fire Department (H), Castlewood Fire and Rescue Department (I), Lebanon Volunteer Fire Department (J), Saltville Rescue Squad (K), Glade Spring Police Department (L), Saint Paul Police Department (M), Saint Paul Volunteer Fire Department (N). Display/hide their locations on the map
Streams, rivers, and creeks: State Line Branch (A), Trace Fork (B), Piney Fork (C), Dilse Branch (D), Russell Fork (E), Lower Elk Creek (F), Knox Creek (G), Hackney Creek (H), Cow Fork (I). Display/hide their locations on the map
Neighboring counties: Mineral County, Colorado  , Santa Cruz County, California , San Juan County, Colorado , Mathews County
  , Rockcastle County, Kentucky , Buena Vista city
  , Newport News city
  , Williamsburg city .
| Here: | 2.9% |
| Virginia: | 2.7% |
Current college students: 193
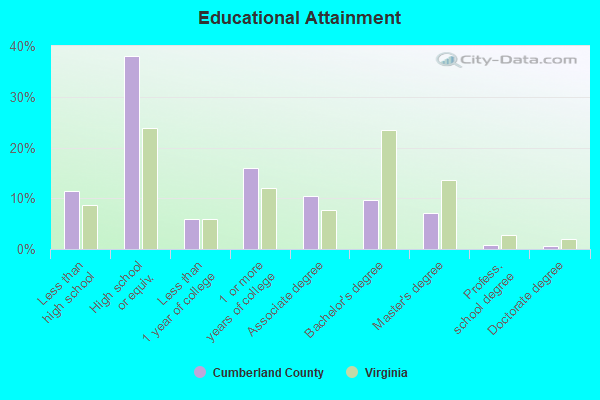
People 25 years of age or older with a high school degree or higher: 86.1%
People 25 years of age or older with a bachelor's degree or higher: 18.5%
Number of foreign born residents: 99 (39.6% naturalized citizens)
| Cumberland County: | 1.0% |
| Whole state: | 12.7% |
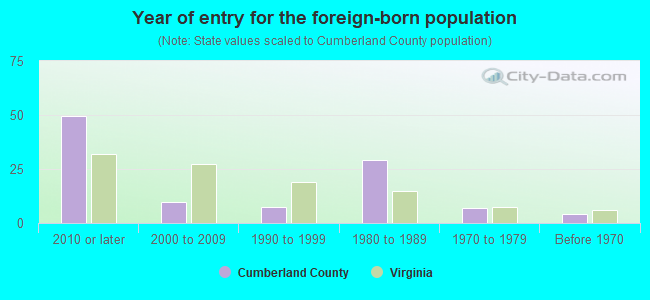
- Year of entry for the foreign-born population
- 542010 or later
- 02000 to 2009
- 131990 to 1999
- 291980 to 1989
- 71970 to 1979
- 4Before 1970
Mean travel time to work (commute): ( minutes
Percentage of county residents living and working in this county: 100.4%
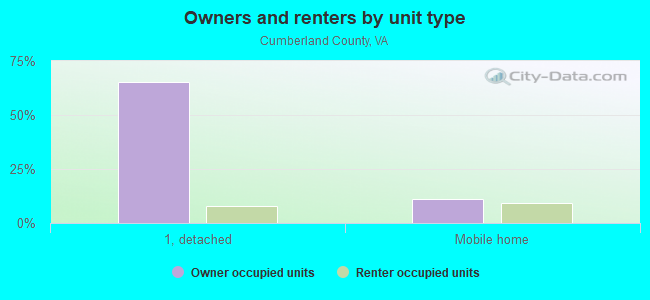
Housing units in structures:
- One, detached: 3,630
- One, attached: 40
- Two: 90
- 3 or 4: 14
- 5 to 9: 19
- 20 or more: 37
- Mobile homes: 868
Housing units in Cumberland County with a mortgage: 1,585 (127 second mortgage, 35 home equity loan, 91 both second mortgage and home equity loan)
Houses without a mortgage: 51
| Here: | 1.9% with mortgage |
| State: | 97.2% with mortgage |
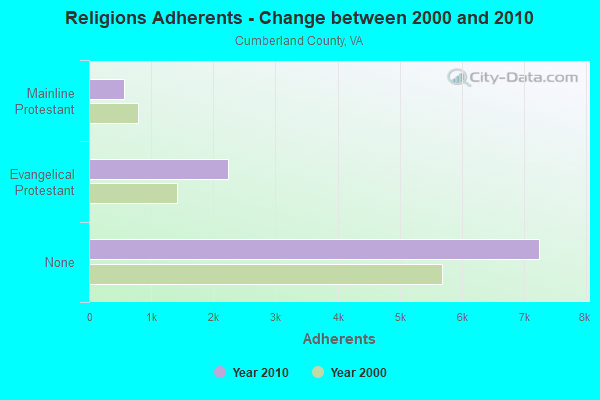
Religion statistics for Cumberland County
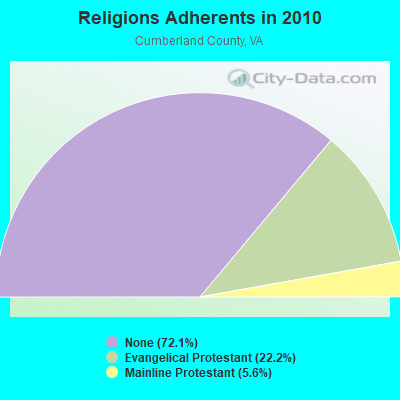
| Religion | Adherents | Congregations |
|---|---|---|
| Evangelical Protestant | 2,235 | 10 |
| Mainline Protestant | 563 | 8 |
| Other | 8 | - |
| None | 7,246 | - |
Source: Clifford Grammich, Kirk Hadaway, Richard Houseal, Dale E.Jones, Alexei Krindatch, Richie Stanley and Richard H.Taylor. 2012. 2010 U.S.Religion Census: Religious Congregations & Membership Study. Association of Statisticians of American Religious Bodies. Jones, Dale E., et al. 2002. Congregations and Membership in the United States 2000. Nashville, TN: Glenmary Research Center.
Food Environment Statistics:
| Cumberland County: | 2.09 / 10,000 pop. |
| State: | 2.03 / 10,000 pop. |
| Cumberland County: | 7.30 / 10,000 pop. |
| Virginia: | 4.03 / 10,000 pop. |
| This county: | 4.17 / 10,000 pop. |
| State: | 7.65 / 10,000 pop. |
| Cumberland County: | 11.3% |
| Virginia: | 9.3% |
| Cumberland County: | 30.1% |
| State: | 26.7% |
| Here: | 21.1% |
| State: | 18.6% |
Agriculture in Cumberland County:
Average size of farms: 221 acresAverage value of agricultural products sold per farm: $100,016
Average value of crops sold per acre for harvested cropland: $188.73
The value of nursery, greenhouse, floriculture, and sod as a percentage of the total market value of agricultural products sold: 1.60%
The value of livestock, poultry, and their products as a percentage of the total market value of agricultural products sold: 90.95%
Average total farm production expenses per farm: $74,470
Harvested cropland as a percentage of land in farms: 21.66%
Average market value of all machinery and equipment per farm: $44,544
The percentage of farms operated by a family or individual: 88.34%
Average age of principal farm operators: 57 years
Average number of cattle and calves per 100 acres of all land in farms: 18.39
Milk cows as a percentage of all cattle and calves: 4.67%
Corn for grain: 80 harvested acres
All wheat for grain: 297 harvested acres
Soybeans for beans: 193 harvested acres
Vegetables: 165 harvested acres
Land in orchards: 35 acres
Earthquake activity:
Cumberland County-area historical earthquake activity is significantly above Virginia state average. It is 48% smaller than the overall U.S. average.On 8/23/2011 at 17:51:04, a magnitude 5.8 (5.8 MW, Depth: 3.7 mi, Class: Moderate, Intensity: VI - VII) earthquake occurred 33.4 miles away from Cumberland County center
On 12/9/2003 at 20:59:18, a magnitude 4.5 (4.5 ML, Depth: 6.2 mi, Class: Light, Intensity: IV - V) earthquake occurred 20.8 miles away from the county center
On 12/9/2003 at 20:59:14, a magnitude 4.5 (4.5 MB, 4.5 LG) earthquake occurred 20.8 miles away from the county center
On 8/25/2011 at 05:07:52, a magnitude 4.5 (4.5 ML, Depth: 4.2 mi) earthquake occurred 34.8 miles away from the county center
On 8/9/2020 at 12:07:37, a magnitude 5.1 (5.1 MW, Depth: 4.7 mi) earthquake occurred 171.5 miles away from Cumberland County center
On 8/24/2011 at 00:04:36, a magnitude 4.2 (4.2 ML) earthquake occurred 33.2 miles away from the county center
Magnitude types: regional Lg-wave magnitude (LG), body-wave magnitude (MB), local magnitude (ML), moment magnitude (MW)
Most recent natural disasters:
- Virginia Covid-19 Pandemic, Incident Period: January 20, 2020, Major Disaster (Presidential) Declared DR-4512-VA: April 2, 2020, FEMA Id: 4512, Natural disaster type: Other
- Virginia Tropical Storm Michael, Incident Period: October 9, 2018 - October 16, 2018, FEMA Id: 4411, Natural disaster type: Tropical Storm
- Virginia Hurricane Sandy, Incident Period: October 26, 2012 to November 01, 2012, Emergency Declared EM-3359: October 29, 2012, FEMA Id: 3359, Natural disaster type: Hurricane
- Virginia Severe Storms and Straight-line Winds, Incident Period: June 29, 2012 to July 01, 2012, Major Disaster (Presidential) Declared DR-4072: July 27, 2012, FEMA Id: 4072, Natural disaster type: Storm, Wind
- Virginia Hurricane Katrina Evacuation, Incident Period: August 29, 2005 to October 01, 2005, Emergency Declared EM-3240: September 12, 2005, FEMA Id: 3240, Natural disaster type: Hurricane
- Virginia Hurricane Isabel, Incident Period: September 18, 2003 to October 01, 2003, Major Disaster (Presidential) Declared DR-1491: September 18, 2003, FEMA Id: 1491, Natural disaster type: Hurricane
- Virginia Severe Storms and Tornado, Incident Period: April 28, 2002 to May 03, 2002, Major Disaster (Presidential) Declared DR-1411: May 05, 2002, FEMA Id: 1411, Natural disaster type: Storm, Tornado
- Virginia Winter Storm, Incident Period: January 25, 2000 to January 30, 2000, Major Disaster (Presidential) Declared DR-1318: February 28, 2000, FEMA Id: 1318, Natural disaster type: Winter Storm
- Virginia Hurricane Fran, Incident Period: September 05, 1996 to September 23, 1996, Major Disaster (Presidential) Declared DR-1135: September 06, 1996, FEMA Id: 1135, Natural disaster type: Hurricane
- Virginia Blizzard, Incident Period: January 06, 1996 to January 12, 1996, Major Disaster (Presidential) Declared DR-1086: January 13, 1996, FEMA Id: 1086, Natural disaster type: Blizzard
- 7 other natural disasters have been reported since 1953.
The number of natural disasters in Cumberland County (17) is near the US average (15).
Major Disasters (Presidential) Declared: 11
Emergencies Declared: 5
Causes of natural disasters: Storms: 5, Hurricanes: 4, Floods: 3, Droughts: 2, Tropical Storms: 2, Winter Storms: 2, Blizzard: 1, Ice Storm: 1, Tornado: 1, Wind: 1, Other: 1 (Note: some incidents may be assigned to more than one category).
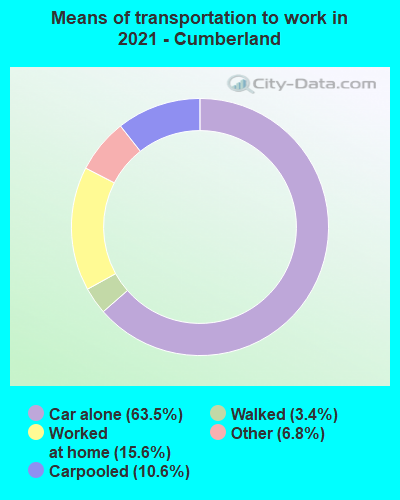
Means of transportation to work:
- Drove a car alone: 1,479 (61.3%)
- Carpooled: 228 (9.5%)
- Taxicab, motorcycle, or other means: 138 (5.7%)
- Walked: 69 (2.9%)
- Worked at home: 563 (23.3%)

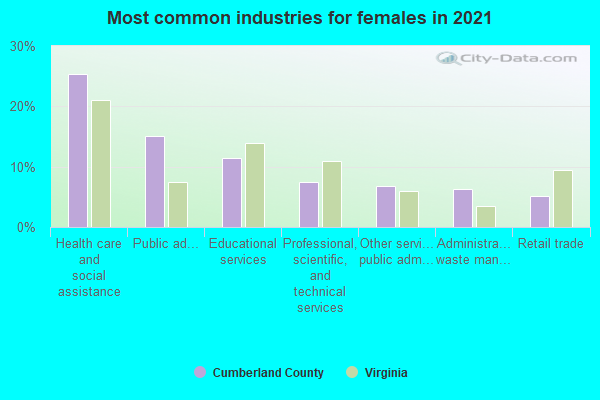
- Health care and social assistance (22%)
- Public administration (16%)
- Educational services (15%)
- Retail trade (7%)
- Other services, except public administration (6%)
- Finance and insurance (6%)
- Professional, scientific, and technical services (6%)
- Health care and social assistance (22%)
- Public administration (16%)
- Educational services (15%)
- Retail trade (6%)
- Other services, except public administration (6%)
- Finance and insurance (6%)
- Professional, scientific, and technical services (6%)
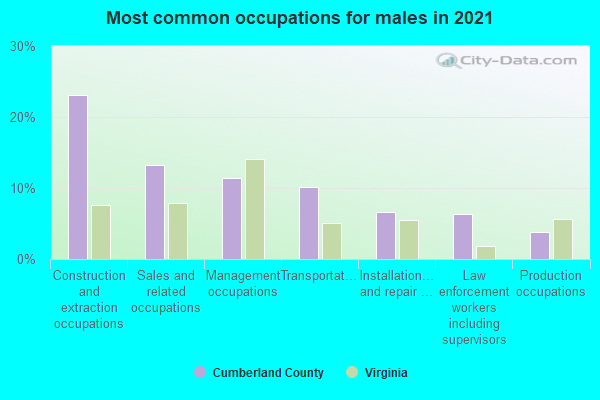
- Construction and extraction occupations (18%)
- Management occupations (16%)
- Sales and related occupations (14%)
- Installation, maintenance, and repair occupations (8%)
- Transportation occupations (7%)
- Law enforcement workers including supervisors (6%)
- Material moving occupations (5%)
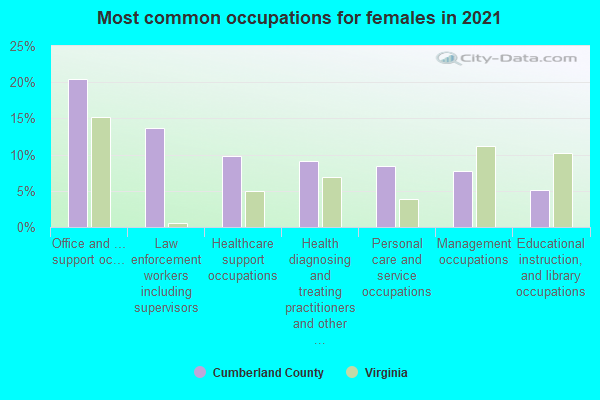
- Office and administrative support occupations (22%)
- Law enforcement workers including supervisors (11%)
- Management occupations (10%)
- Health diagnosing and treating practitioners and other technical occupations (8%)
- Healthcare support occupations (7%)
- Personal care and service occupations (6%)
- Educational instruction, and library occupations (5%)
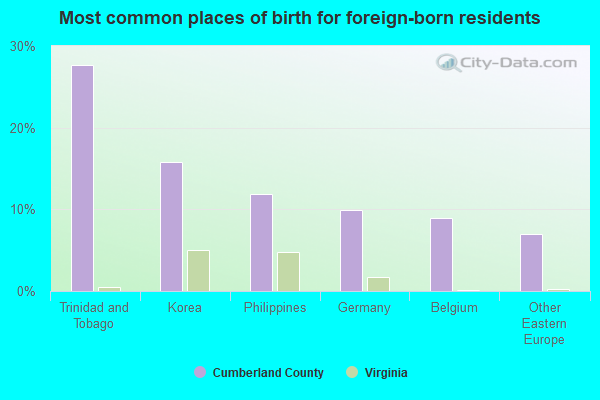
- Trinidad and Tobago (45%)
- Philippines (12%)
- Germany (11%)
- Other South America (10%)
- Korea (9%)
- Norway (0%)
- Sweden (0%)
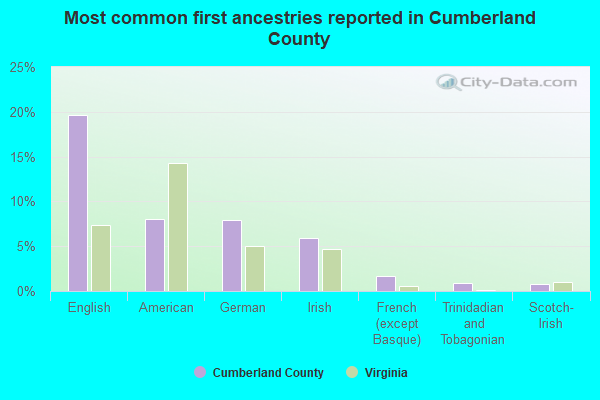
- English (20%)
- American (10%)
- German (7%)
- Irish (5%)
- French (except Basque) (1%)
- Trinidadian and Tobagonian (1%)
- Eastern European (1%)
3 people in residential treatment centers for adults
People in group quarters in Cumberland County, Virginia in 2000:
- 18 people in other noninstitutional group quarters
- 14 people in nursing homes
- 4 people in agriculture workers' dormitories on farms
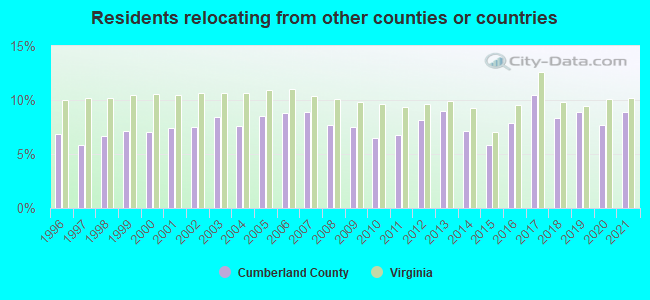
8.86% of this county's 2021 resident taxpayers lived in other counties in 2020 ($42,904 average adjusted gross income)
| Here: | 8.86% |
| Virginia average: | 10.16% |
10 or fewer of this county's residents moved from foreign countries.
7.52% relocated from other counties in Virginia ($36,321 average AGI)
1.34% relocated from other states ($6,583 average AGI)
Cumberland County: 1.34% Virginia average: 3.91%
Top counties from which taxpayers relocated into this county between 2020 and 2021:
| from Prince Edward County, VA | |
| from Chesterfield County, VA | |
| from Buckingham County, VA | |
| from Powhatan County, VA | |
| from Henrico County, VA |
7.37% of this county's 2020 resident taxpayers moved to other counties in 2021 ($39,543 average adjusted gross income)
| Here: | 7.37% |
| Virginia average: | 10.20% |
10 or fewer of this county's residents moved to foreign countries.
6.50% relocated to other counties in Virginia ($34,566 average AGI)
0.86% relocated to other states ($4,977 average AGI)
Cumberland County: 0.86% Virginia average: 3.98%

Top counties to which taxpayers relocated from this county between 2020 and 2021:
| to Prince Edward County, VA | |
| to Buckingham County, VA | |
| to Powhatan County, VA | |
| to Chesterfield County, VA |
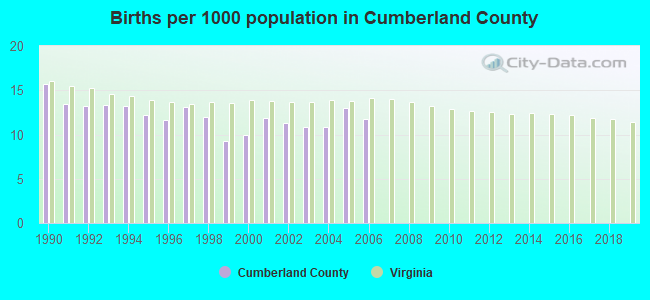
Births per 1000 population from 1990 to 1999: 12.7
Births per 1000 population from 2000 to 2006: 11.4
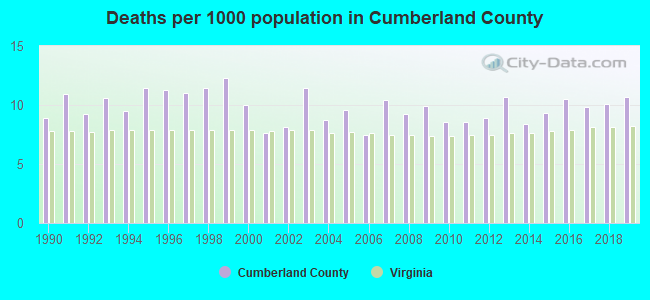
Deaths per 1000 population from 1990 to 1999: 10.7
Deaths per 1000 population from 2000 to 2009: 9.2
Deaths per 1000 population from 2010 to 2020: 9.7
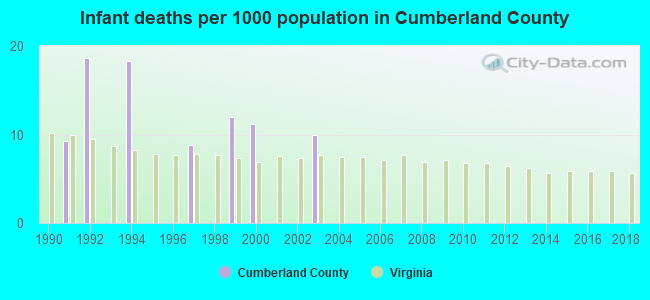
Infant deaths per 1000 live births from 1990 to 1999: 6.7
Infant deaths per 1000 live births from 2000 to 2006: 3.0
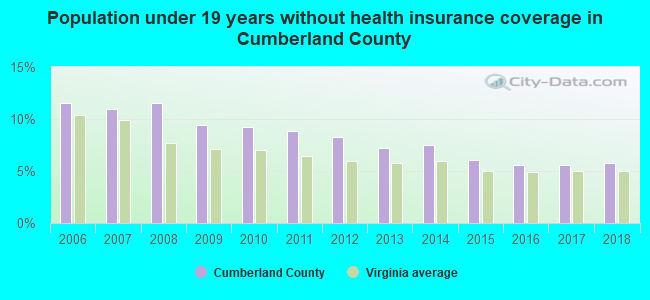
Persons under 19 years old without health insurance coverage in 2018: 5.8%
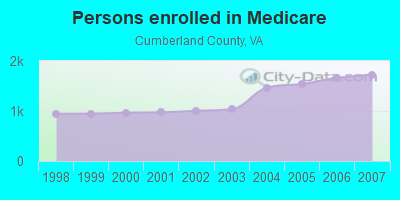
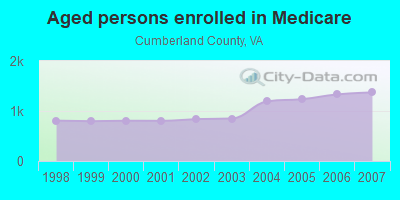
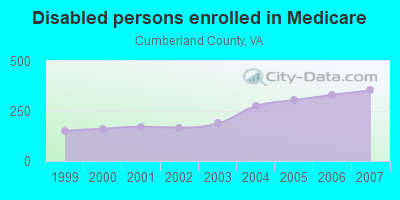
Persons enrolled in hospital insurance and/or supplemental medical insurance (Medicare) in July 1, 2007: 1,726 (1,372 aged, 354 disabled)
Children under 18 without health insurance coverage in 2007: 230 (10%)
Most common underlying causes of death in Cumberland County, Virginia in 1999 - 2019:
- Bronchus or lung, unspecified - Malignant neoplasms (30)
- Atherosclerotic heart disease (10)
- Chronic obstructive pulmonary disease, unspecified (10)
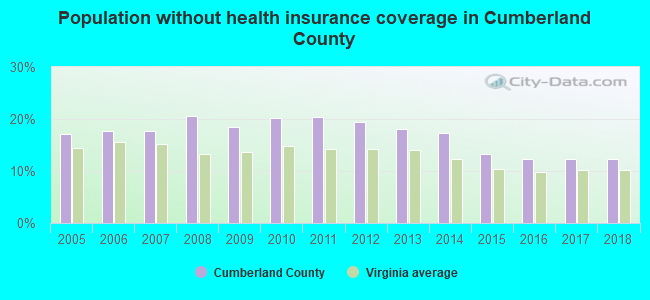
Population without health insurance coverage in 2000: 14%
Children under 18 without health insurance coverage in 2000: 11%
Medical specialist MDs per 100,000 population in 2005: 1,002
Total births per 100,000 population, July 2005 - July 2006 : 13
Total deaths per 100,000 population, July 2005 - July 2006: 11
Crimes per 100,000 population in 1996: 1
Household type by relationship:
Households: 9,763- Male householders: 1,876 (475 living alone), Female householders: 2,292 (544 living alone)
2,014 spouses (1,968 opposite-sex spouses), 224 unmarried partners, (224 opposite-sex unmarried partners), 2,497 children (2,367 natural, 29 adopted, 102 stepchildren), 447 grandchildren, 57 brothers or sisters, 83 parents, 4 foster children, 113 other relatives, 118 non-relatives
- In group quarters: 35
Size of family households: 1,643 2-persons, 670 3-persons, 402 4-persons, 73 5-persons, 35 6-persons, 106 7-or-more-persons.
Size of nonfamily households: 1,019 1-person, 197 2-persons, 26 3-persons.
1,183 married couples with children.
461 single-parent households (36 men, 425 women).
98.1% of residents of Cumberland speak English at home.
0.2% of residents speak Spanish at home (100% speak English very well).
1.1% of residents speak other Indo-European language at home (71% speak English very well, 29% speak English well).
0.5% of residents speak Asian or Pacific Island language at home (83% speak English very well, 17% speak English not well).
0.1% of residents speak other language at home (100% speak English very well).
In fiscal year 2004:
Federal Government expenditure: $40,977,000 ($4,465 per capita)
Department of Defense expenditure: $1,523,000
Federal direct payments to individuals for retirement and disability: $17,994,000
Federal other direct payments to individuals: $7,392,000
Federal direct payments not to individuals: $390,000
Federal grants: $13,421,000
Federal procurement contracts: $850,000 ($368,000 Department of Defense)
Federal salaries and wages: $929,000 ($0,000 Department of Defense)
Federal Government direct loans: $209,000
Federal guaranteed/insured loans: $7,160,000
Federal Government insurance: $836,000
Population change from April 1, 2000 to July 1, 2005:
Births: 527| Here: | 56 per 1000 residents |
| State: | 70 per 1000 residents |
Deaths: 463
| Here: | 49 per 1000 residents |
| State: | 40 per 1000 residents |
Net international migration: +46
| Here: | +5 per 1000 residents |
| State: | +18 per 1000 residents |
Net internal migration: +271
| Here: | +29 per 1000 residents |
| State: | +14 per 1000 residents |
Total withdrawal of fresh water for public supply: 0.01 millions of gallons per day (all from ground)
| Here: | 6.3 |
| State: | 7.0 |
| Here: | 4.9 |
| State: | 4.3 |
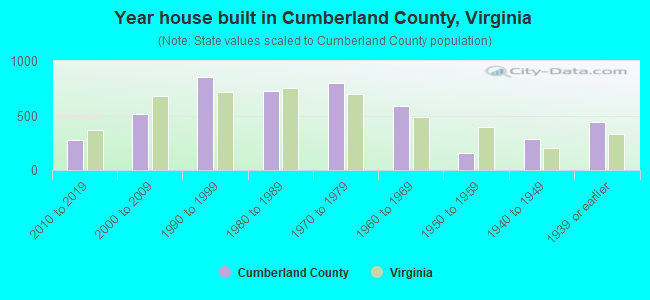
- Year house built in Cumberland County, Virginia
- 02020 or later
- 3432010 to 2019
- 4632000 to 2009
- 8011990 to 1999
- 7511980 to 1989
- 7601970 to 1979
- 5661960 to 1969
- 1571950 to 1959
- 3121940 to 1949
- 4771939 or earlier
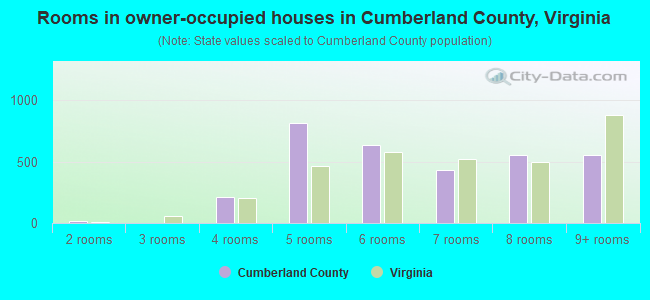
- Rooms in owner-occupied houses in Cumberland County, Virginia
- 01 room
- 02 rooms
- 03 rooms
- 2994 rooms
- 7805 rooms
- 7166 rooms
- 3167 rooms
- 4698 rooms
- 6709+ rooms
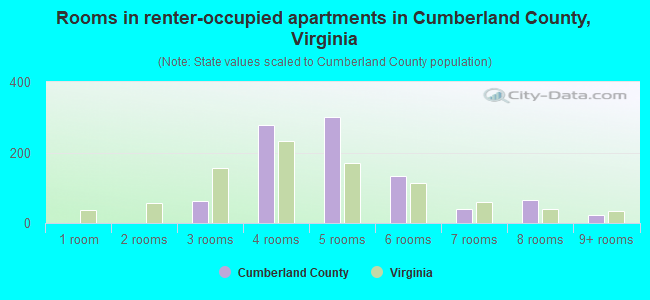
- Rooms in renter-occupied apartments in Cumberland County, Virginia
- 01 room
- 02 rooms
- 553 rooms
- 2284 rooms
- 3265 rooms
- 796 rooms
- 757 rooms
- 1108 rooms
- 269+ rooms
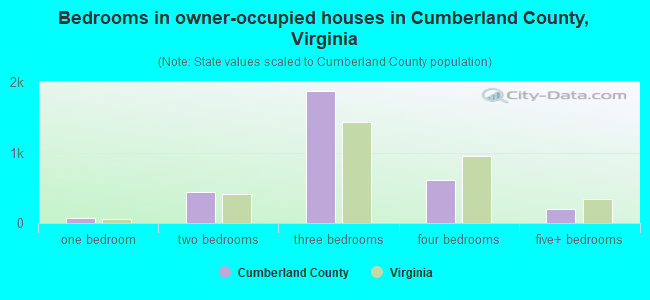
- Bedrooms in owner-occupied houses in Cumberland County, Virginia
- 0no bedroom
- 151 bedroom
- 4922 bedrooms
- 1,9773 bedrooms
- 5234 bedrooms
- 2485+ bedrooms
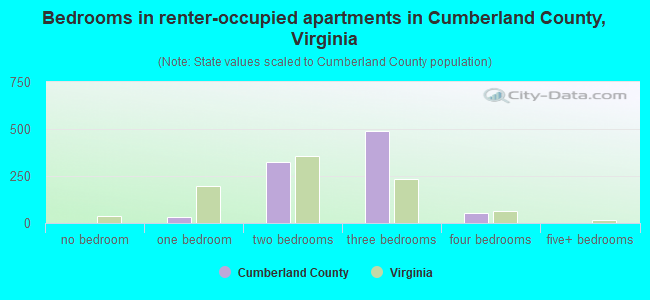
- Bedrooms in renter-occupied apartments in Cumberland County, Virginia
- 0no bedroom
- 371 bedroom
- 2312 bedrooms
- 5693 bedrooms
- 534 bedrooms
- 175+ bedrooms
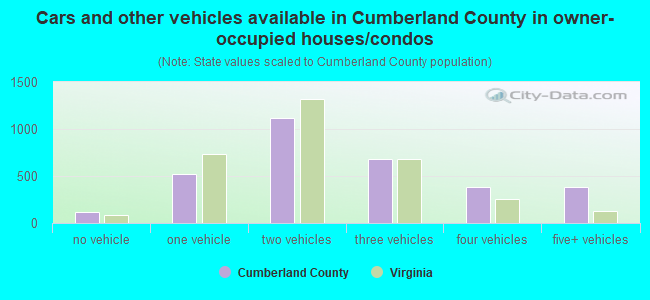
- Cars and other vehicles available in Cumberland County in owner-occupied houses/condos
- 186no vehicle
- 5921 vehicle
- 1,1182 vehicles
- 7683 vehicles
- 3364 vehicles
- 2535+ vehicles
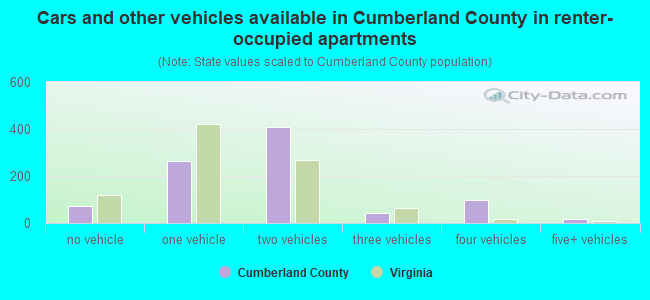
- Cars and other vehicles available in Cumberland County in renter-occupied apartments
- 110no vehicle
- 2481 vehicle
- 4502 vehicles
- 703 vehicles
- 174 vehicles
- 95+ vehicles
95.6% of Cumberland County residents lived in the same house 1 years ago.
Out of people who lived in different houses, 12% lived in this county.
Out of people who lived in different counties, 61% lived in Virginia.
| Cumberland County: | 95.6% |
| State average: | 86.6% |
Place of birth for U.S.-born residents:
- This state: 7,544
- Other state: 1,998
- Northeast: 924
- Midwest: 163
- South: 795
- West: 111
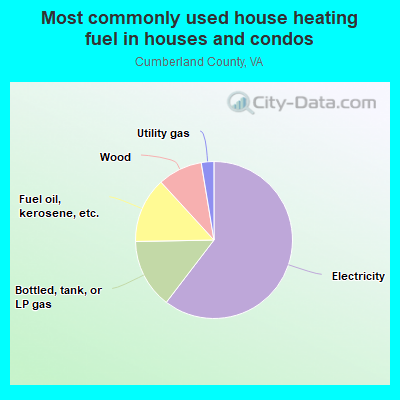
- 56.8%Electricity
- 17.9%Bottled, tank, or LP gas
- 14.0%Fuel oil, kerosene, etc.
- 6.7%Wood
- 4.2%Utility gas
- 0.3%Solar energy
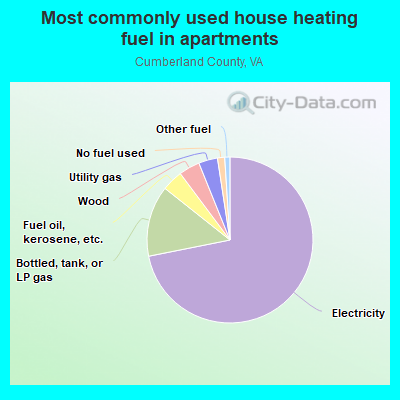
- 78.3%Electricity
- 7.6%Wood
- 4.6%Fuel oil, kerosene, etc.
- 4.5%Bottled, tank, or LP gas
- 2.9%Utility gas
- 1.2%Other fuel
- 0.9%No fuel used
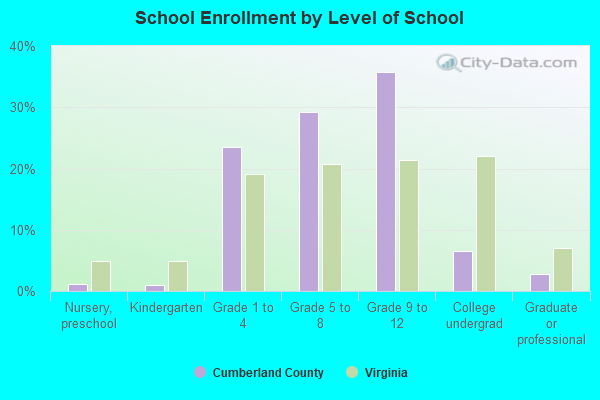
Private vs. public school enrollment:
| Here: | 13.9% |
| Virginia: | 13.2% |
| Here: | 18.0% |
| Virginia: | 10.2% |
| Here: | 35.9% |
| Virginia: | 18.7% |
Cumberland County government finances - Expenditure in 2017:
- Bond Funds - Cash and Securities: $13,000
- Charges - Sewerage: $263,000
Elementary and Secondary Education School Lunch: $249,000
Other: $190,000
Parks and Recreation: $15,000
Elementary and Secondary Education School Tuition and Transportation: $12,000
Solid Waste Management: $1,000
- Construction - Elementary and Secondary Education: $49,000
- Current Operations - Elementary and Secondary Education: $15,477,000
Public Welfare - Other: $2,139,000
Police Protection: $1,687,000
Financial Administration: $945,000
General Public Buildings: $668,000
Solid Waste Management: $661,000
Judicial and Legal Services: $603,000
Local Fire Protection: $565,000
General - Other: $560,000
Central Staff Services: $419,000
Health - Other: $243,000
Correctional Institutions: $232,000
Sewerage: $198,000
Protective Inspection and Regulation - Other: $131,000
Libraries: $115,000
Water Utilities: $93,000
Natural Resources - Other: $59,000
Parks and Recreation: $46,000
Corrections - Other: $1,000
- Federal Intergovernmental - Education: $1,718,000
Public Welfare: $654,000
Other: $70,000
Highways: $22,000
- General - Interest on Debt: $1,240,000
- Intergovernmental to Local - Other - Elementary and Secondary Education: $3,790,000
Other - Other Higher Education: $11,000
- Local Intergovernmental - Education: $3,790,000
Other: $2,401,000
General Local Government Support: $20,000
- Long Term Debt - Beginning Outstanding - Unspecified Public Purpose: $36,751,000
Outstanding Unspecified Public Purpose: $33,145,000
Retired Unspecified Public Purpose: $18,501,000
Issue, Unspecified Public Purpose: $14,895,000
- Miscellaneous - General Revenue - Other: $430,000
Fines and Forfeits: $121,000
Interest Earnings: $62,000
Rents: $10,000
- Other Capital Outlay - Elementary and Secondary Education: $512,000
General - Other: $66,000
Health - Other: $34,000
Regular Highways: $14,000
Local Fire Protection: $12,000
- Other Funds - Cash and Securities: $5,935,000
- Revenue - Water Utilities: $126,000
- State Intergovernmental - Education: $11,505,000
General Local Government Support: $1,114,000
Other: $671,000
Public Welfare: $357,000
- Tax - Property: $9,190,000
General Sales and Gross Receipts: $442,000
Motor Vehicle License: $228,000
Public Utilities Sales: $186,000
Occupation and Business License - Other: $111,000
Death and Gift: $54,000
Other License: $42,000
Documentary and Stock Transfer: $14,000
Other: $12,000
- Total Salaries and Wages: $9,021,000
Cumberland County government finances - Revenue in 2017:
- Bond Funds - Cash and Securities: $13,000
- Charges - Sewerage: $263,000
Elementary and Secondary Education School Lunch: $249,000
Other: $190,000
Parks and Recreation: $15,000
Elementary and Secondary Education School Tuition and Transportation: $12,000
Solid Waste Management: $1,000
- Construction - Elementary and Secondary Education: $49,000
- Current Operations - Elementary and Secondary Education: $15,477,000
Public Welfare - Other: $2,139,000
Police Protection: $1,687,000
Financial Administration: $945,000
General Public Buildings: $668,000
Solid Waste Management: $661,000
Judicial and Legal Services: $603,000
Local Fire Protection: $565,000
General - Other: $560,000
Central Staff Services: $419,000
Health - Other: $243,000
Correctional Institutions: $232,000
Sewerage: $198,000
Protective Inspection and Regulation - Other: $131,000
Libraries: $115,000
Water Utilities: $93,000
Natural Resources - Other: $59,000
Parks and Recreation: $46,000
Corrections - Other: $1,000
- Federal Intergovernmental - Education: $1,718,000
Public Welfare: $654,000
Other: $70,000
Highways: $22,000
- General - Interest on Debt: $1,240,000
- Intergovernmental to Local - Other - Elementary and Secondary Education: $3,790,000
Other - Other Higher Education: $11,000
- Local Intergovernmental - Education: $3,790,000
Other: $2,401,000
General Local Government Support: $20,000
- Long Term Debt - Beginning Outstanding - Unspecified Public Purpose: $36,751,000
Outstanding Unspecified Public Purpose: $33,145,000
Retired Unspecified Public Purpose: $18,501,000
Issue, Unspecified Public Purpose: $14,895,000
- Miscellaneous - General Revenue - Other: $430,000
Fines and Forfeits: $121,000
Interest Earnings: $62,000
Rents: $10,000
- Other Capital Outlay - Elementary and Secondary Education: $512,000
General - Other: $66,000
Health - Other: $34,000
Regular Highways: $14,000
Local Fire Protection: $12,000
- Other Funds - Cash and Securities: $5,935,000
- Revenue - Water Utilities: $126,000
- State Intergovernmental - Education: $11,505,000
General Local Government Support: $1,114,000
Other: $671,000
Public Welfare: $357,000
- Tax - Property: $9,190,000
General Sales and Gross Receipts: $442,000
Motor Vehicle License: $228,000
Public Utilities Sales: $186,000
Occupation and Business License - Other: $111,000
Death and Gift: $54,000
Other License: $42,000
Documentary and Stock Transfer: $14,000
Other: $12,000
- Total Salaries and Wages: $9,021,000
Cumberland County government finances - Debt in 2017:
- Bond Funds - Cash and Securities: $13,000
- Charges - Sewerage: $263,000
Elementary and Secondary Education School Lunch: $249,000
Other: $190,000
Parks and Recreation: $15,000
Elementary and Secondary Education School Tuition and Transportation: $12,000
Solid Waste Management: $1,000
- Construction - Elementary and Secondary Education: $49,000
- Current Operations - Elementary and Secondary Education: $15,477,000
Public Welfare - Other: $2,139,000
Police Protection: $1,687,000
Financial Administration: $945,000
General Public Buildings: $668,000
Solid Waste Management: $661,000
Judicial and Legal Services: $603,000
Local Fire Protection: $565,000
General - Other: $560,000
Central Staff Services: $419,000
Health - Other: $243,000
Correctional Institutions: $232,000
Sewerage: $198,000
Protective Inspection and Regulation - Other: $131,000
Libraries: $115,000
Water Utilities: $93,000
Natural Resources - Other: $59,000
Parks and Recreation: $46,000
Corrections - Other: $1,000
- Federal Intergovernmental - Education: $1,718,000
Public Welfare: $654,000
Other: $70,000
Highways: $22,000
- General - Interest on Debt: $1,240,000
- Intergovernmental to Local - Other - Elementary and Secondary Education: $3,790,000
Other - Other Higher Education: $11,000
- Local Intergovernmental - Education: $3,790,000
Other: $2,401,000
General Local Government Support: $20,000
- Long Term Debt - Beginning Outstanding - Unspecified Public Purpose: $36,751,000
Outstanding Unspecified Public Purpose: $33,145,000
Retired Unspecified Public Purpose: $18,501,000
Issue, Unspecified Public Purpose: $14,895,000
- Miscellaneous - General Revenue - Other: $430,000
Fines and Forfeits: $121,000
Interest Earnings: $62,000
Rents: $10,000
- Other Capital Outlay - Elementary and Secondary Education: $512,000
General - Other: $66,000
Health - Other: $34,000
Regular Highways: $14,000
Local Fire Protection: $12,000
- Other Funds - Cash and Securities: $5,935,000
- Revenue - Water Utilities: $126,000
- State Intergovernmental - Education: $11,505,000
General Local Government Support: $1,114,000
Other: $671,000
Public Welfare: $357,000
- Tax - Property: $9,190,000
General Sales and Gross Receipts: $442,000
Motor Vehicle License: $228,000
Public Utilities Sales: $186,000
Occupation and Business License - Other: $111,000
Death and Gift: $54,000
Other License: $42,000
Documentary and Stock Transfer: $14,000
Other: $12,000
- Total Salaries and Wages: $9,021,000
Cumberland County government finances - Cash and Securities in 2017:
- Bond Funds - Cash and Securities: $13,000
- Charges - Sewerage: $263,000
Elementary and Secondary Education School Lunch: $249,000
Other: $190,000
Parks and Recreation: $15,000
Elementary and Secondary Education School Tuition and Transportation: $12,000
Solid Waste Management: $1,000
- Construction - Elementary and Secondary Education: $49,000
- Current Operations - Elementary and Secondary Education: $15,477,000
Public Welfare - Other: $2,139,000
Police Protection: $1,687,000
Financial Administration: $945,000
General Public Buildings: $668,000
Solid Waste Management: $661,000
Judicial and Legal Services: $603,000
Local Fire Protection: $565,000
General - Other: $560,000
Central Staff Services: $419,000
Health - Other: $243,000
Correctional Institutions: $232,000
Sewerage: $198,000
Protective Inspection and Regulation - Other: $131,000
Libraries: $115,000
Water Utilities: $93,000
Natural Resources - Other: $59,000
Parks and Recreation: $46,000
Corrections - Other: $1,000
- Federal Intergovernmental - Education: $1,718,000
Public Welfare: $654,000
Other: $70,000
Highways: $22,000
- General - Interest on Debt: $1,240,000
- Intergovernmental to Local - Other - Elementary and Secondary Education: $3,790,000
Other - Other Higher Education: $11,000
- Local Intergovernmental - Education: $3,790,000
Other: $2,401,000
General Local Government Support: $20,000
- Long Term Debt - Beginning Outstanding - Unspecified Public Purpose: $36,751,000
Outstanding Unspecified Public Purpose: $33,145,000
Retired Unspecified Public Purpose: $18,501,000
Issue, Unspecified Public Purpose: $14,895,000
- Miscellaneous - General Revenue - Other: $430,000
Fines and Forfeits: $121,000
Interest Earnings: $62,000
Rents: $10,000
- Other Capital Outlay - Elementary and Secondary Education: $512,000
General - Other: $66,000
Health - Other: $34,000
Regular Highways: $14,000
Local Fire Protection: $12,000
- Other Funds - Cash and Securities: $5,935,000
- Revenue - Water Utilities: $126,000
- State Intergovernmental - Education: $11,505,000
General Local Government Support: $1,114,000
Other: $671,000
Public Welfare: $357,000
- Tax - Property: $9,190,000
General Sales and Gross Receipts: $442,000
Motor Vehicle License: $228,000
Public Utilities Sales: $186,000
Occupation and Business License - Other: $111,000
Death and Gift: $54,000
Other License: $42,000
Documentary and Stock Transfer: $14,000
Other: $12,000
- Total Salaries and Wages: $9,021,000
Supplemental Security Income (SSI) in 2006:
- Total number of recipients: 305
- Number of aged recipients: 52
- Number of blind and disabled recipients: 253
- Number of recipients under 18: 64
- Number of recipients between 18 and 64: 152
- Number of recipients older than 64: 89
- Number of recipients also receiving OASDI: 148
- Amount of payments (thousands of dollars): 124
| Businesses in Cumberland County, VA | ||||
| Name | Count | Name | Count | |
|---|---|---|---|---|
| Decora Cabinetry | 2 | Subway | 1 | |
| MasterBrand Cabinets | 2 | True Value | 1 | |
Cumberland County on our top lists:
- #9 on the list of "Top 101 counties with the lowest total withdrawal of fresh water for public supply"
- #38 on the list of "Top 101 counties with the lowest ground withdrawal of fresh water for public supply"