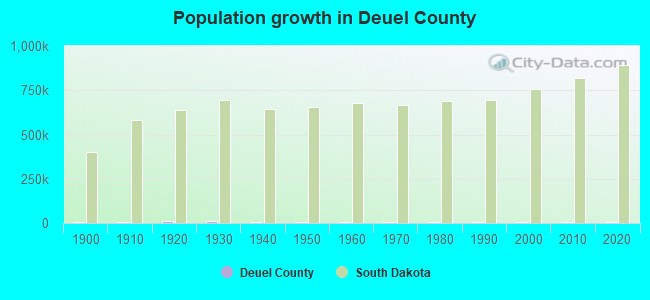
Deuel County, South Dakota (SD)
County owner-occupied free and clear houses and condos in 2010: 728
County owner-occupied houses and condos in 2000: 1,475
Renter-occupied apartments: 337 (it was 368 in 2000)
| % of renters here: | 20% |
| State: | 32% |
Land area: 624 sq. mi.
Water area: 13.2 sq. mi.
Population density: 7 people per square mile (very low).
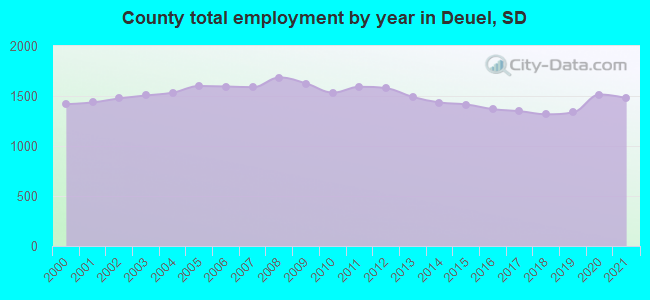
Industries providing employment: Manufacturing (24.2%), Educational, health and social services (17.4%), Agriculture,forestry,fishing and hunting, and mining (14.1%).
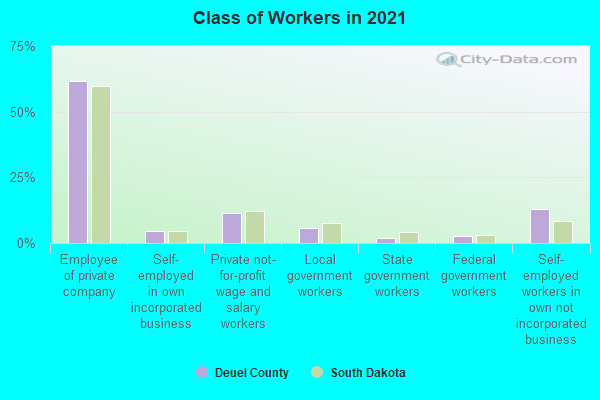
Type of workers:
- Private wage or salary: 80%
- Government: 10%
- Self-employed, not incorporated: 10%
- Unpaid family work: 0%
- OSM Map
- General Map
- Google Map
- MSN Map

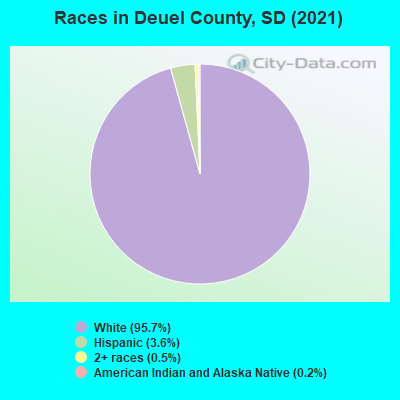
- 4,06492.5%White Non-Hispanic Alone
- 1713.9%Hispanic or Latino
- 1503.4%Two or more races
- 50.1%American Indian and Alaska Native alone
- 30.07%Black Non-Hispanic Alone
| Median resident age: | 43.1 years |
| South Dakota median age: | 38.5 years |
| Males: 2,250 | |
| Females: 2,142 |

 | Winter Weather Alerts, 2012-2013 (First post web cams) (44 replies) |
| Deuel County: | 2.0 people |
| South Dakota: | 2 people |
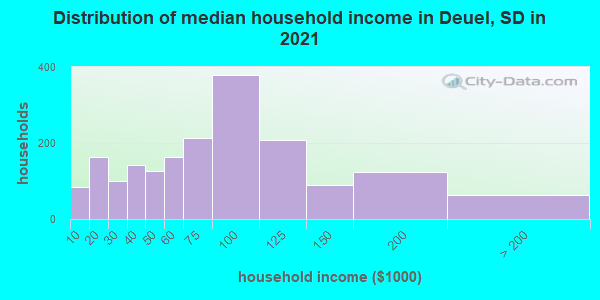
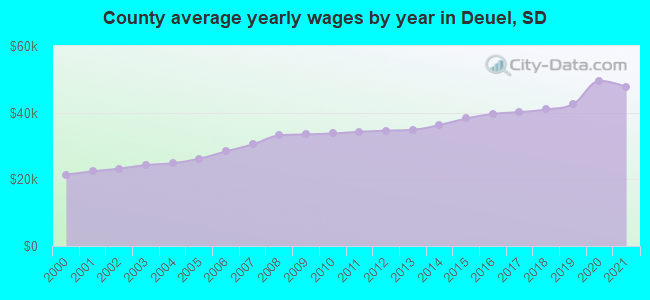
Estimated median household income in 2022: $77,297 ($31,788 in 1999)
| This county: | $77,297 |
| South Dakota: | $69,728 |
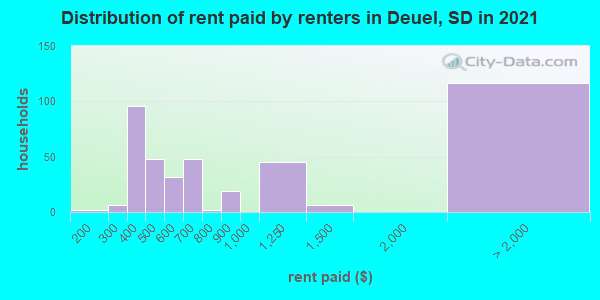
Median contract rent in 2022 for apartments: $507 (lower quartile is $358, upper quartile is $731)
| This county: | $507 |
| State: | $747 |
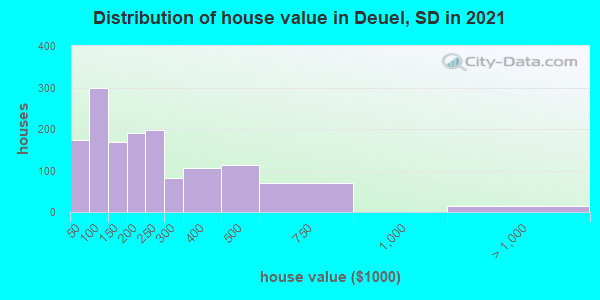
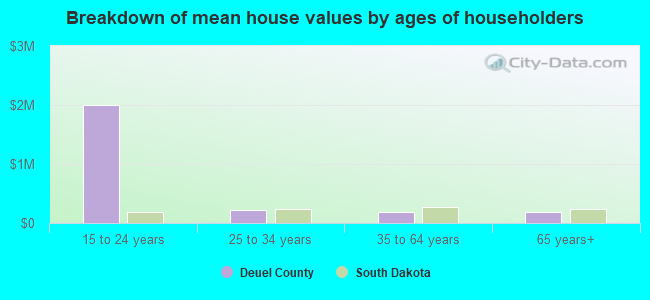
Estimated median house or condo value in 2022: $198,790 (it was $53,000 in 2000)
| Deuel: | $198,790 |
| South Dakota: | $245,000 |
Mean price in 2022:
Median monthly housing costs for homes and condos with a mortgage: $1,268Detached houses: $280,016
Here: $280,016 State: $303,134 Mobile homes: $89,673
Here: $89,673 State: $82,732
Median monthly housing costs for units without a mortgage: $519
Institutionalized population: 50
Crime in 2021 (reported by the sheriff's office or county police, not the county total):
- Murders: 0
- Rapes: 1
- Robberies: 0
- Assaults: 8
- Burglaries: 2
- Thefts: 10
- Auto thefts: 4
Crime in 2020 (reported by the sheriff's office or county police, not the county total):
- Murders: 0
- Rapes: 0
- Robberies: 0
- Assaults: 3
- Burglaries: 2
- Thefts: 5
- Auto thefts: 1
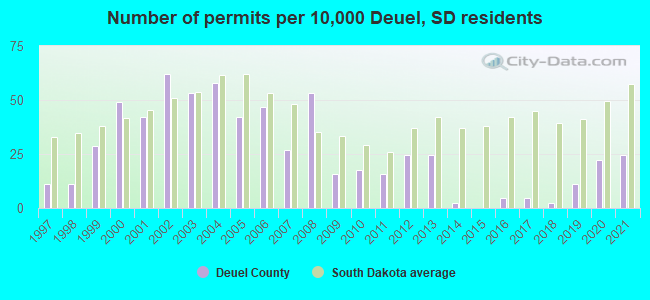
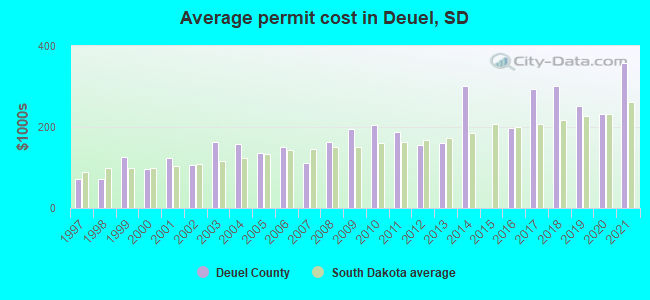
Single-family new house construction building permits:
- 2022: 16 buildings, average cost: $447,600
- 2021: 11 buildings, average cost: $357,100
- 2020: 10 buildings, average cost: $231,500
- 2019: 5 buildings, average cost: $251,400
- 2018: 1 building, cost: $300,000
- 2017: 2 buildings, average cost: $292,500
- 2016: 2 buildings, average cost: $197,000
- 2015: 0 buildings
- 2014: 1 building, cost: $300,000
- 2013: 11 buildings, average cost: $161,100
- 2012: 11 buildings, average cost: $155,600
- 2011: 7 buildings, average cost: $186,500
- 2010: 8 buildings, average cost: $206,300
- 2009: 7 buildings, average cost: $195,000
- 2008: 24 buildings, average cost: $164,000
- 2007: 12 buildings, average cost: $112,100
- 2006: 21 buildings, average cost: $149,700
- 2005: 19 buildings, average cost: $135,800
- 2004: 26 buildings, average cost: $159,100
- 2003: 24 buildings, average cost: $164,200
- 2002: 28 buildings, average cost: $106,400
- 2001: 19 buildings, average cost: $124,300
- 2000: 22 buildings, average cost: $96,300
- 1999: 13 buildings, average cost: $127,300
- 1998: 5 buildings, average cost: $72,300
- 1997: 5 buildings, average cost: $71,700
Median real estate property taxes paid for housing units with mortgages in 2022: $1,670 (0.8%)
Median real estate property taxes paid for housing units with no mortgage in 2022: $1,338 (0.7%)
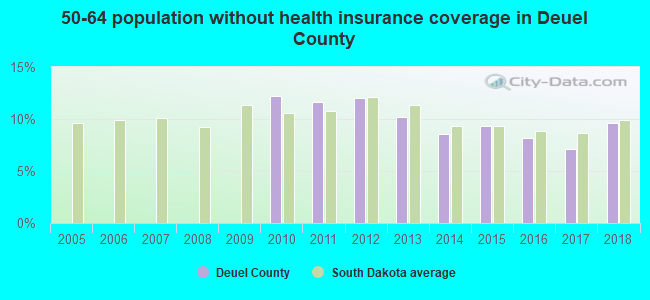
| Deuel County: | 5.9% |
| South Dakota: | 12.5% |
Median age of residents in 2022: 43.1 years old
(Males: 42.3 years old, Females: 45.0 years old)
(Median age for: White residents: 45.0 years old, American Indian residents: 51.2 years old, Hispanic or Latino residents: 23.0 years old, Other race residents: 21.9 years old)
Fair market rent in 2006 for a 1-bedroom apartment in Deuel County is $377 a month.
Fair market rent for a 2-bedroom apartment is $484 a month.
Fair market rent for a 3-bedroom apartment is $654 a month.
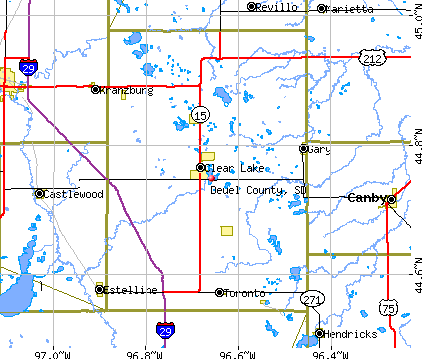
Cities in this county include: Clear Lake, Gary, Toronto, Goodwin, Astoria, Brandt, Altamont.
Notable locations in this county outside city limits:
Creek: Lazarus Creek (A). Display/hide its location on the map
Neighboring counties: Beadle County  , Carver County, Minnesota
  , Clark County
  , Marion County, Oregon , Goodhue County, Minnesota , Hand County , Lincoln County, Minnesota
  .
.
| Here: | 3.5% |
| South Dakota: | 2.0% |

Current college students: 89
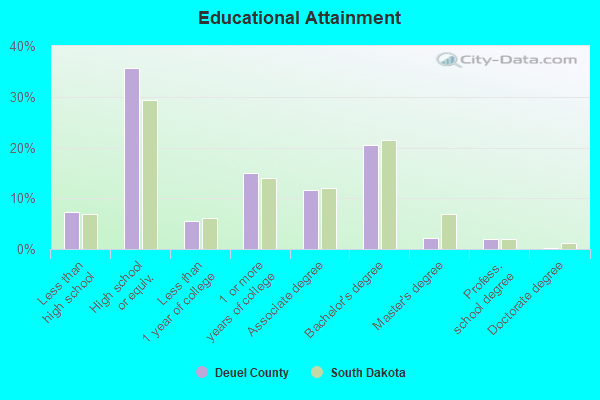
People 25 years of age or older with a high school degree or higher: 92.8%
People 25 years of age or older with a bachelor's degree or higher: 23.7%
Number of foreign born residents: 37 (56.2% naturalized citizens)
| Deuel County: | 0.8% |
| Whole state: | 3.5% |
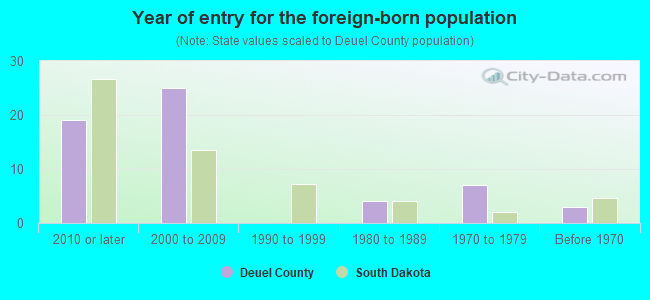
- Year of entry for the foreign-born population
- 12010 or later
- 382000 to 2009
- 01990 to 1999
- 41980 to 1989
- 71970 to 1979
- 3Before 1970
Mean travel time to work (commute): minutes
Percentage of county residents living and working in this county: 91.5%
Housing units in structures:
- One, detached: 1,943
- Two: 13
- 3 or 4: 60
- 5 to 9: 47
- 10 to 19: 65
- 50 or more: 8
- Mobile homes: 48
- Boats, RVs, vans, etc.: 23
Housing units in Deuel County with a mortgage: 679 (49 second mortgage, 0 home equity loan, 51 both second mortgage and home equity loan)
Houses without a mortgage: 5
| Here: | 99.3% with mortgage |
| State: | 98.3% with mortgage |
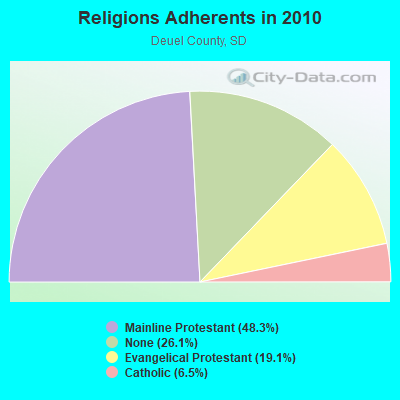
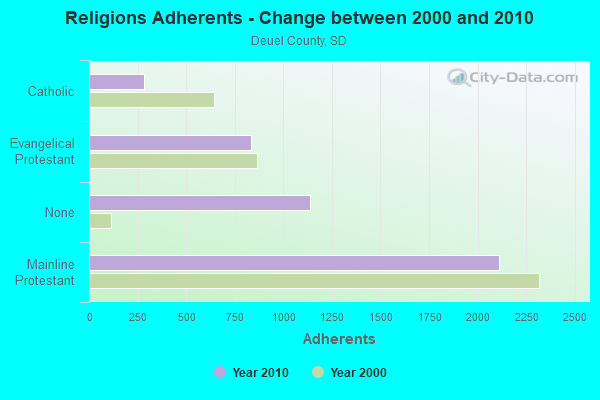
Religion statistics for Deuel County
| Religion | Adherents | Congregations |
|---|---|---|
| Mainline Protestant | 2,108 | 10 |
| Evangelical Protestant | 834 | 7 |
| Catholic | 283 | 2 |
| Other | - | - |
| None | 1,139 | - |
Source: Clifford Grammich, Kirk Hadaway, Richard Houseal, Dale E.Jones, Alexei Krindatch, Richie Stanley and Richard H.Taylor. 2012. 2010 U.S.Religion Census: Religious Congregations & Membership Study. Association of Statisticians of American Religious Bodies. Jones, Dale E., et al. 2002. Congregations and Membership in the United States 2000. Nashville, TN: Glenmary Research Center.
Food Environment Statistics:
| Deuel County: | 7.08 / 10,000 pop. |
| State: | 2.84 / 10,000 pop. |
| Deuel County: | 7.08 / 10,000 pop. |
| South Dakota: | 6.68 / 10,000 pop. |
| This county: | 18.89 / 10,000 pop. |
| State: | 9.21 / 10,000 pop. |
| Deuel County: | 8.0% |
| South Dakota: | 7.7% |
| Deuel County: | 26.9% |
| State: | 27.7% |
Agriculture in Deuel County:
Average size of farms: 562 acresAverage value of agricultural products sold per farm: $112,751
Average value of crops sold per acre for harvested cropland: $139.70
The value of livestock, poultry, and their products as a percentage of the total market value of agricultural products sold: 66.04%
Average total farm production expenses per farm: $98,954
Harvested cropland as a percentage of land in farms: 48.78%
Irrigated harvested cropland as a percentage of land in farms: 0.63%
Average market value of all machinery and equipment per farm: $80,157
The percentage of farms operated by a family or individual: 92.62%
Average age of principal farm operators: 52 years
Average number of cattle and calves per 100 acres of all land in farms: 18.11
Milk cows as a percentage of all cattle and calves: 9.63%
Corn for grain: 43381 harvested acres
All wheat for grain: 12994 harvested acres
Soybeans for beans: 54249 harvested acres
Earthquake activity:
Deuel County-area historical earthquake activity is significantly above South Dakota state average. It is 14% smaller than the overall U.S. average.On 7/9/1975 at 14:54:15, a magnitude 4.6 (4.6 MB, Class: Light, Intensity: IV - V) earthquake occurred 70.5 miles away from Deuel County center
On 3/4/1983 at 06:32:18, a magnitude 4.6 (4.4 MB, 4.6 LG, 4.4 ML) earthquake occurred 140.6 miles away from the county center
On 6/5/1993 at 01:24:53, a magnitude 4.1 (4.1 LG, Depth: 6.2 mi) earthquake occurred 66.6 miles away from the county center
On 8/18/1959 at 06:37:13, a magnitude 7.7 (7.7 UK, Class: Major, Intensity: VIII - XII) earthquake occurred 687.9 miles away from the county center, causing $26,000,000 total damage
On 11/3/2002 at 20:41:56, a magnitude 4.3 (4.3 MB, Depth: 3.1 mi) earthquake occurred 176.7 miles away from Deuel County center
On 10/25/1990 at 06:25:25, a magnitude 3.9 (3.6 MB, 3.9 LG, Depth: 3.1 mi, Class: Light, Intensity: II - III) earthquake occurred 111.4 miles away from the county center
Magnitude types: regional Lg-wave magnitude (LG), body-wave magnitude (MB), local magnitude (ML)
Most recent natural disasters:
- South Dakota Covid-19 Pandemic, Incident Period: January 20, 2020, FEMA Id: 4527, Natural disaster type: Other
- South Dakota Severe Storms And Flooding, Incident Period: May 26, 2019 - June 7, 2019, FEMA Id: 4463, Natural disaster type: Storm, Flood
- South Dakota Severe Winter Storm, Snowstorm, And Flooding, Incident Period: March 13, 2019 - April 26, 2019, FEMA Id: 4440, Natural disaster type: Snowstorm, Winter Storm, Flood
- South Dakota Severe Winter Storm, Incident Period: December 24, 2016 - December 26, 2016, FEMA Id: 4298, Natural disaster type: Winter Storm
- South Dakota Severe Storms, Tornadoes, and Flooding, Incident Period: June 19, 2013 to June 30, 2013, Major Disaster (Presidential) Declared DR-4137: August 02, 2013, FEMA Id: 4137, Natural disaster type: Storm, Tornado, Flood
- South Dakota Flooding, Incident Period: March 11, 2011 to July 22, 2011, Major Disaster (Presidential) Declared DR-1984: May 13, 2011, FEMA Id: 1984, Natural disaster type: Flood
- South Dakota Flooding, Incident Period: March 10, 2010 to June 20, 2010, Major Disaster (Presidential) Declared DR-1915: May 13, 2010, FEMA Id: 1915, Natural disaster type: Flood
- South Dakota Severe Winter Storm, Incident Period: January 20, 2010 to January 26, 2010, Major Disaster (Presidential) Declared DR-1887: March 10, 2010, FEMA Id: 1887, Natural disaster type: Winter Storm
- South Dakota Severe Winter Storm, Incident Period: November 27, 2005 to November 29, 2005, Major Disaster (Presidential) Declared DR-1620: December 20, 2005, FEMA Id: 1620, Natural disaster type: Winter Storm
- South Dakota Hurricane Katrina Evacuation, Incident Period: September 06, 2005 to October 01, 2005, Emergency Declared EM-3234: September 10, 2005, FEMA Id: 3234, Natural disaster type: Hurricane
- 11 other natural disasters have been reported since 1953.
The number of natural disasters in Deuel County (21) is greater than the US average (15).
Major Disasters (Presidential) Declared: 15
Emergencies Declared: 2
Causes of natural disasters: Floods: 12, Storms: 9, Winter Storms: 5, Tornadoes: 3, Blizzard: 1, Drought: 1, Hurricane: 1, Ice Storm: 1, Snowstorm: 1, Other: 1 (Note: some incidents may be assigned to more than one category).

Means of transportation to work:
- Drove a car alone: 1,149 (77.3%)
- Carpooled: 92 (6.2%)
- Taxicab, motorcycle, or other means: 39 (2.6%)
- Bicycle: 2 (0.1%)
- Walked: 47 (3.2%)
- Worked at home: 159 (10.7%)

- Manufacturing (21%)
- Health care and social assistance (20%)
- Educational services (10%)
- Agriculture, forestry, fishing and hunting (6%)
- Retail trade (5%)
- Accommodation and food services (3%)
- Public administration (3%)

- Manufacturing (25%)
- Health care and social assistance (24%)
- Educational services (11%)
- Agriculture, forestry, fishing and hunting (7%)
- Retail trade (6%)
- Accommodation and food services (4%)
- Public administration (4%)
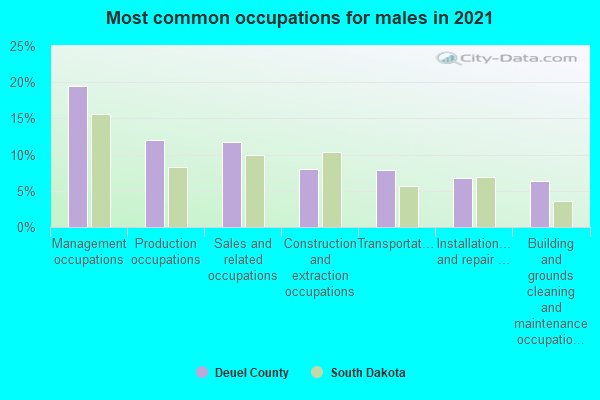
- Management occupations (21%)
- Production occupations (14%)
- Sales and related occupations (13%)
- Transportation occupations (10%)
- Construction and extraction occupations (7%)
- Installation, maintenance, and repair occupations (6%)
- Building and grounds cleaning and maintenance occupations (5%)
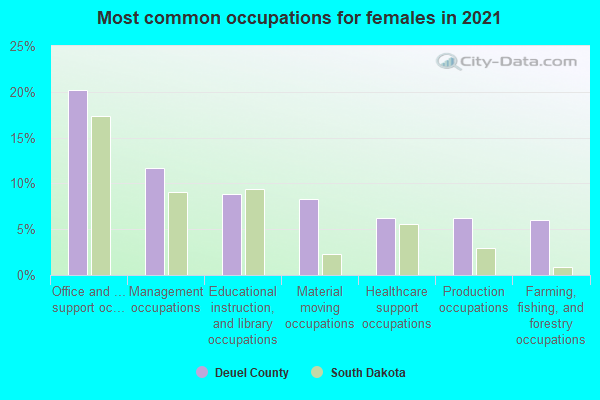
- Office and administrative support occupations (21%)
- Management occupations (12%)
- Educational instruction, and library occupations (10%)
- Production occupations (8%)
- Food preparation and serving related occupations (7%)
- Health diagnosing and treating practitioners and other technical occupations (6%)
- Business and financial operations occupations (5%)
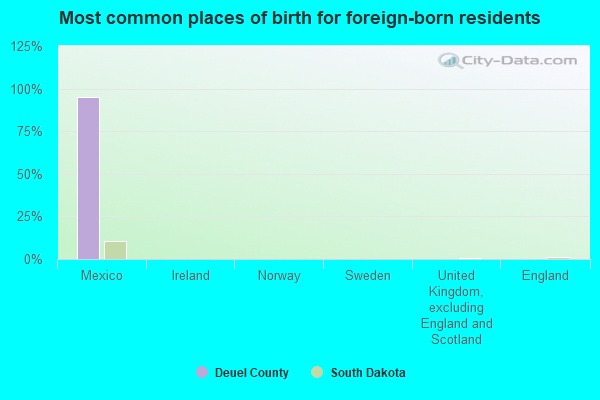
- Mexico (92%)
- Ireland (0%)
- Norway (0%)
- Sweden (0%)
- United Kingdom, excluding England and Scotland (0%)
- England (0%)
- Scotland (0%)
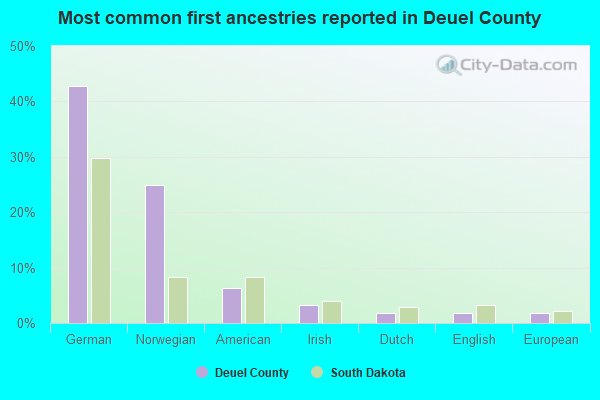
- German (42%)
- Norwegian (28%)
- American (5%)
- Irish (4%)
- European (2%)
- Scandinavian (2%)
- English (1%)
65 people in other group homes
3 people in other noninstitutional group quarters
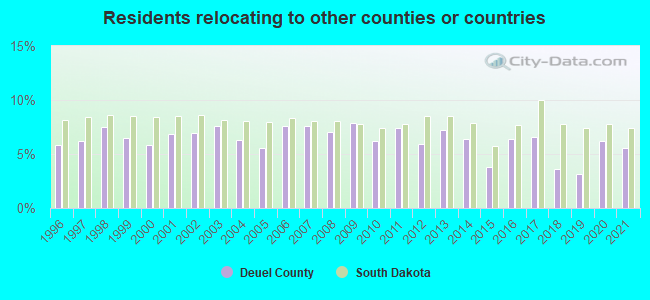
5.65% of this county's 2021 resident taxpayers lived in other counties in 2020 ($47,541 average adjusted gross income)
| Here: | 5.65% |
| South Dakota average: | 8.18% |
10 or fewer of this county's residents moved from foreign countries.
3.64% relocated from other counties in South Dakota ($25,306 average AGI)
2.02% relocated from other states ($22,235 average AGI)
Deuel County: 2.02% South Dakota average: 4.11%

Top counties from which taxpayers relocated into this county between 2020 and 2021:
| from Codington County, SD |
5.55% of this county's 2020 resident taxpayers moved to other counties in 2021 ($55,438 average adjusted gross income)
| Here: | 5.55% |
| South Dakota average: | 7.42% |
10 or fewer of this county's residents moved to foreign countries.
3.70% relocated to other counties in South Dakota ($36,573 average AGI)
1.85% relocated to other states ($18,865 average AGI)
Deuel County: 1.85% South Dakota average: 3.31%
Top counties to which taxpayers relocated from this county between 2020 and 2021:
| to Codington County, SD |
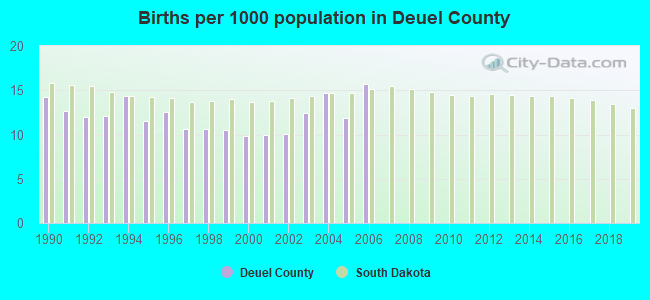
Births per 1000 population from 1990 to 1999: 12.1
Births per 1000 population from 2000 to 2006: 12.1
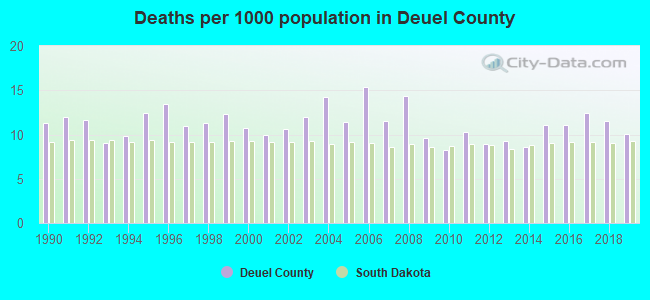
Deaths per 1000 population from 1990 to 1999: 11.4
Deaths per 1000 population from 2000 to 2009: 12.0
Deaths per 1000 population from 2010 to 2020: 10.2
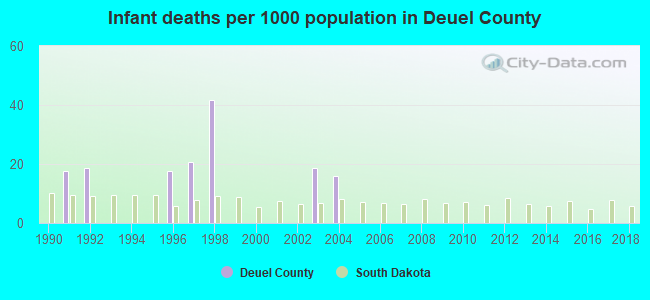
Infant deaths per 1000 live births from 1990 to 1999: 11.6
Infant deaths per 1000 live births from 2000 to 2006: 4.9
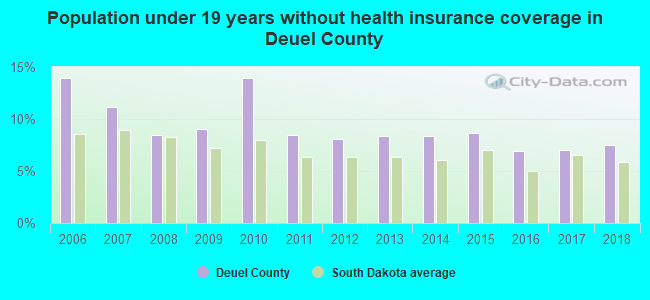
Persons under 19 years old without health insurance coverage in 2018: 7.5%
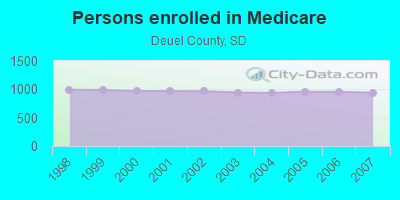
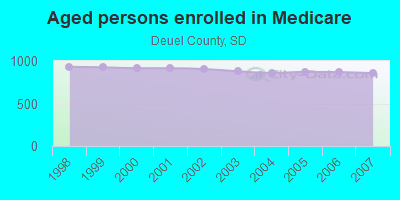
Persons enrolled in hospital insurance and/or supplemental medical insurance (Medicare) in July 1, 2007: 941 (857 aged, 84 disabled)
Children under 18 without health insurance coverage in 2007: 102 (11%)

Most common underlying causes of death in Deuel County, South Dakota in 1999 - 2019:
- Atherosclerotic heart disease (10)
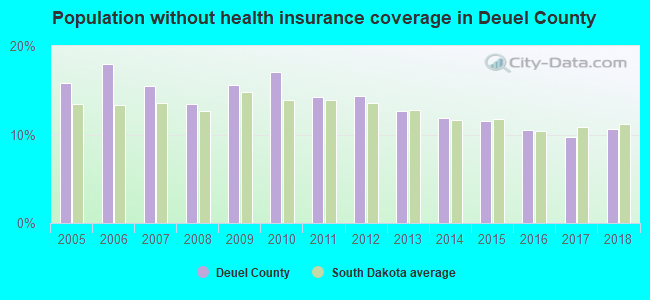
Population without health insurance coverage in 2000: 11%
Children under 18 without health insurance coverage in 2000: 10%
Short term general hospital admissions per 100,000 population in 2004: 4,902
Short term general hospital beds per 100,000 population in 2004: 469
Emergency room visits per 100,000 population in 2004: 10,976
General practice office based MDs per 100,000 population in 2005: 1,676
Medical specialist MDs per 100,000 population in 2005: 1,560
Dentists per 100,000 population in 1998: 23
Total births per 100,000 population, July 2005 - July 2006 : 22
Household type by relationship:
Households: 4,392- Male householders: 1,138 (326 living alone), Female householders: 749 (273 living alone)
1,059 spouses (1,059 opposite-sex spouses), 118 unmarried partners, (118 opposite-sex unmarried partners), 1,189 children (1,000 natural, 103 adopted, 89 stepchildren), 15 grandchildren, 6 brothers or sisters, 27 parents, 0 foster children, 12 other relatives, 41 non-relatives
- In group quarters: 56
Size of family households: 576 2-persons, 227 3-persons, 242 4-persons, 118 5-persons, 41 6-persons, 19 7-or-more-persons.
Size of nonfamily households: 598 1-person, 45 2-persons, 5 4-persons.
854 married couples with children.
206 single-parent households (123 men, 83 women).
96.8% of residents of Deuel speak English at home.
2.5% of residents speak Spanish at home (36% speak English very well, 64% speak English well).
0.8% of residents speak other Indo-European language at home (100% speak English very well).
In fiscal year 2004:
Federal Government expenditure: $32,820,000 ($7,697 per capita)
Department of Defense expenditure: $422,000
Federal direct payments to individuals for retirement and disability: $10,982,000
Federal other direct payments to individuals: $5,591,000
Federal direct payments not to individuals: $9,101,000
Federal grants: $4,949,000
Federal procurement contracts: $456,000 ($49,000 Department of Defense)
Federal salaries and wages: $1,741,000 ($0,000 Department of Defense)
Federal Government direct loans: $501,000
Federal guaranteed/insured loans: $6,350,000
Federal Government insurance: $27,394,000
Population change from April 1, 2000 to July 1, 2005:
Births: 247| Here: | 57 per 1000 residents |
| State: | 72 per 1000 residents |
Deaths: 249
| Here: | 58 per 1000 residents |
| State: | 48 per 1000 residents |
Net international migration: 0
| Here: | 0 per 1000 residents |
| State: | +5 per 1000 residents |
Net internal migration: -186
| Here: | |
| State: |
Total withdrawal of fresh water for public supply: 0.19 millions of gallons per day (all from ground)
| Here: | 6.6 |
| State: | 7.0 |
| Here: | 4.8 |
| State: | 4.1 |

- Year house built in Deuel County, South Dakota
- 132020 or later
- 1642010 to 2019
- 1782000 to 2009
- 2111990 to 1999
- 1591980 to 1989
- 2731970 to 1979
- 2091960 to 1969
- 1271950 to 1959
- 1701940 to 1949
- 6101939 or earlier
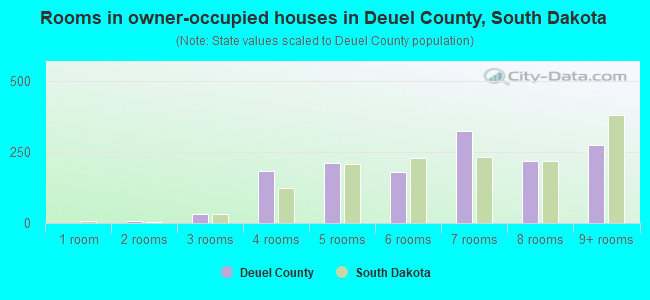
- Rooms in owner-occupied houses in Deuel County, South Dakota
- 01 room
- 62 rooms
- 473 rooms
- 2134 rooms
- 2305 rooms
- 2236 rooms
- 3077 rooms
- 1958 rooms
- 2899+ rooms
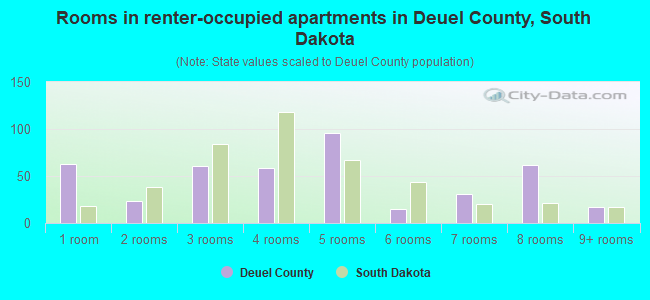
- Rooms in renter-occupied apartments in Deuel County, South Dakota
- 371 room
- 282 rooms
- 433 rooms
- 594 rooms
- 835 rooms
- 186 rooms
- 407 rooms
- 618 rooms
- 139+ rooms
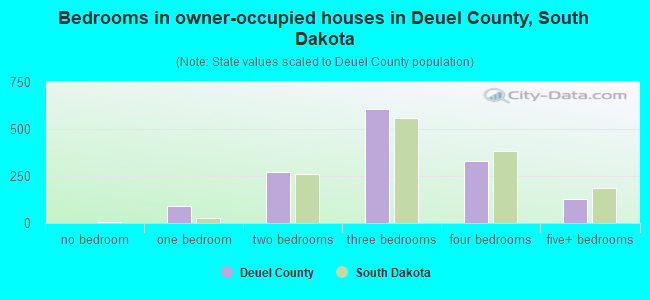
- Bedrooms in owner-occupied houses in Deuel County, South Dakota
- 0no bedroom
- 1081 bedroom
- 3102 bedrooms
- 6313 bedrooms
- 3504 bedrooms
- 1085+ bedrooms
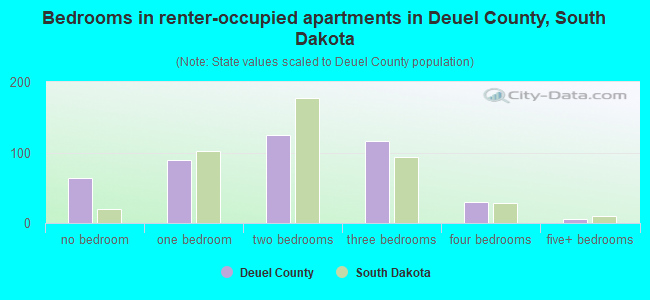
- Bedrooms in renter-occupied apartments in Deuel County, South Dakota
- 38no bedroom
- 961 bedroom
- 952 bedrooms
- 1103 bedrooms
- 304 bedrooms
- 225+ bedrooms
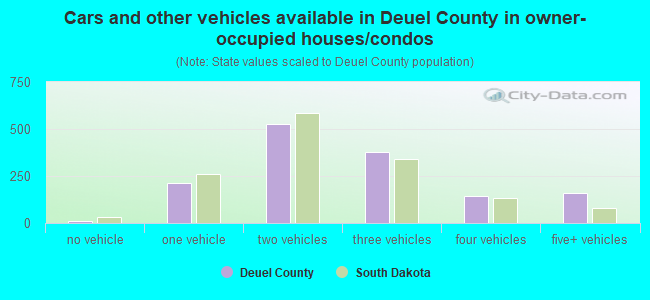
- Cars and other vehicles available in Deuel County in owner-occupied houses/condos
- 19no vehicle
- 2451 vehicle
- 6172 vehicles
- 3443 vehicles
- 1504 vehicles
- 1225+ vehicles
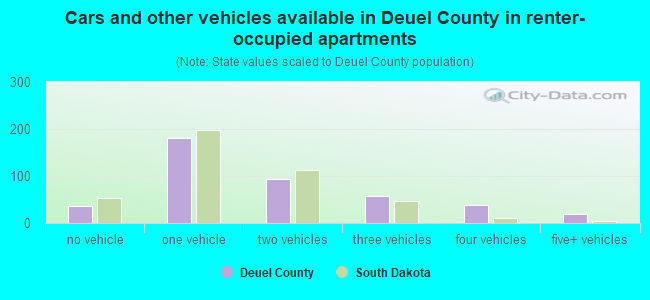
- Cars and other vehicles available in Deuel County in renter-occupied apartments
- 21no vehicle
- 1841 vehicle
- 732 vehicles
- 373 vehicles
- 364 vehicles
- 305+ vehicles
94.4% of Deuel County residents lived in the same house 1 years ago.
Out of people who lived in different houses, 26% lived in this county.
Out of people who lived in different counties, 50% lived in South Dakota.
| Deuel County: | 94.4% |
| State average: | 86.6% |
Place of birth for U.S.-born residents:
- This state: 2,462
- Other state: 1,916
- Northeast: 20
- Midwest: 1,508
- South: 171
- West: 186

- 39.1%Bottled, tank, or LP gas
- 29.7%Electricity
- 26.4%Utility gas
- 3.2%Wood
- 0.8%Fuel oil, kerosene, etc.
- 0.6%Other fuel
- 0.4%No fuel used
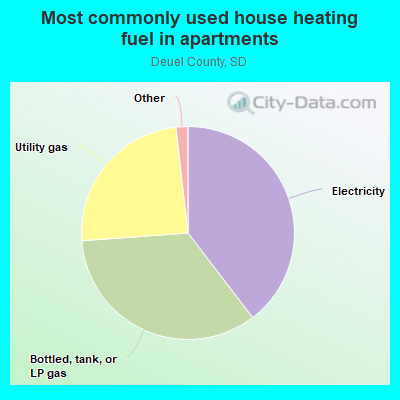
- 42.7%Electricity
- 36.1%Bottled, tank, or LP gas
- 20.4%Utility gas
- 0.8%Fuel oil, kerosene, etc.
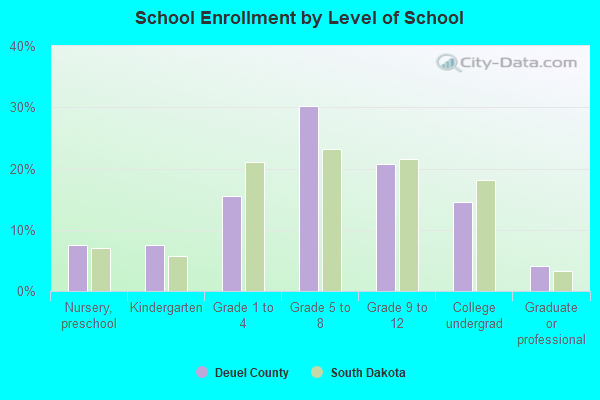
Private vs. public school enrollment:
| Here: | 2.3% |
| South Dakota: | 11.9% |
| Here: | 0.0% |
| South Dakota: | 7.2% |
| Here: | 0.0% |
| South Dakota: | 10.2% |

Deuel County government finances - Expenditure in 2018:
- Charges - Other: $264,000
Regular Highways: $146,000
- Current Operations - Regular Highways: $2,129,000
Police Protection: $411,000
Central Staff Services: $386,000
Financial Administration: $245,000
Natural Resources - Other: $144,000
General Public Buildings: $113,000
Judicial and Legal Services: $108,000
General - Other: $100,000
Protective Inspection and Regulation - Other: $56,000
Correctional Institutions: $52,000
Public Welfare - Other: $41,000
Local Fire Protection: $34,000
Parks and Recreation: $15,000
Health - Other: $6,000
- Federal Intergovernmental - Other: $4,000
- General - Interest on Debt: $6,000
- Miscellaneous - General Revenue - Other: $9,000
Fines and Forfeits: $5,000
Rents: $2,000
- State Intergovernmental - Highways: $932,000
Other: $6,000
- Tax - Property: $2,655,000
Motor Vehicle License: $184,000
Other License: $80,000
Public Utility License: $20,000
Alcoholic Beverage License: $9,000
Deuel County government finances - Revenue in 2018:
- Charges - Other: $264,000
Regular Highways: $146,000
- Current Operations - Regular Highways: $2,129,000
Police Protection: $411,000
Central Staff Services: $386,000
Financial Administration: $245,000
Natural Resources - Other: $144,000
General Public Buildings: $113,000
Judicial and Legal Services: $108,000
General - Other: $100,000
Protective Inspection and Regulation - Other: $56,000
Correctional Institutions: $52,000
Public Welfare - Other: $41,000
Local Fire Protection: $34,000
Parks and Recreation: $15,000
Health - Other: $6,000
- Federal Intergovernmental - Other: $4,000
- General - Interest on Debt: $6,000
- Miscellaneous - General Revenue - Other: $9,000
Fines and Forfeits: $5,000
Rents: $2,000
- State Intergovernmental - Highways: $932,000
Other: $6,000
- Tax - Property: $2,655,000
Motor Vehicle License: $184,000
Other License: $80,000
Public Utility License: $20,000
Alcoholic Beverage License: $9,000
Deuel County government finances - Debt in 2018:
- Charges - Other: $264,000
Regular Highways: $146,000
- Current Operations - Regular Highways: $2,129,000
Police Protection: $411,000
Central Staff Services: $386,000
Financial Administration: $245,000
Natural Resources - Other: $144,000
General Public Buildings: $113,000
Judicial and Legal Services: $108,000
General - Other: $100,000
Protective Inspection and Regulation - Other: $56,000
Correctional Institutions: $52,000
Public Welfare - Other: $41,000
Local Fire Protection: $34,000
Parks and Recreation: $15,000
Health - Other: $6,000
- Federal Intergovernmental - Other: $4,000
- General - Interest on Debt: $6,000
- Miscellaneous - General Revenue - Other: $9,000
Fines and Forfeits: $5,000
Rents: $2,000
- State Intergovernmental - Highways: $932,000
Other: $6,000
- Tax - Property: $2,655,000
Motor Vehicle License: $184,000
Other License: $80,000
Public Utility License: $20,000
Alcoholic Beverage License: $9,000
Deuel County government finances - Cash and Securities in 2018:
- Charges - Other: $264,000
Regular Highways: $146,000
- Current Operations - Regular Highways: $2,129,000
Police Protection: $411,000
Central Staff Services: $386,000
Financial Administration: $245,000
Natural Resources - Other: $144,000
General Public Buildings: $113,000
Judicial and Legal Services: $108,000
General - Other: $100,000
Protective Inspection and Regulation - Other: $56,000
Correctional Institutions: $52,000
Public Welfare - Other: $41,000
Local Fire Protection: $34,000
Parks and Recreation: $15,000
Health - Other: $6,000
- Federal Intergovernmental - Other: $4,000
- General - Interest on Debt: $6,000
- Miscellaneous - General Revenue - Other: $9,000
Fines and Forfeits: $5,000
Rents: $2,000
- State Intergovernmental - Highways: $932,000
Other: $6,000
- Tax - Property: $2,655,000
Motor Vehicle License: $184,000
Other License: $80,000
Public Utility License: $20,000
Alcoholic Beverage License: $9,000
Supplemental Security Income (SSI) in 2006:
- Total number of recipients: 52
- Number of aged recipients: 12
- Number of blind and disabled recipients: 40
- Number of recipients under 18: 9
- Number of recipients between 18 and 64: 26
- Number of recipients older than 64: 17
- Number of recipients also receiving OASDI: 30
- Amount of payments (thousands of dollars): 21
| Most common first names in Deuel County, SD among deceased individuals | ||
| Name | Count | Lived (average) |
|---|---|---|
| John | 38 | 81.4 years |
| William | 29 | 81.1 years |
| Henry | 26 | 80.4 years |
| Clarence | 24 | 78.1 years |
| Albert | 21 | 77.0 years |
| Mary | 19 | 80.4 years |
| George | 17 | 81.0 years |
| Arthur | 17 | 80.2 years |
| Gladys | 16 | 81.0 years |
| Fred | 15 | 82.5 years |
| Most common last names in Deuel County, SD among deceased individuals | ||
| Last name | Count | Lived (average) |
|---|---|---|
| Johnson | 37 | 77.7 years |
| Anderson | 27 | 81.7 years |
| Nelson | 17 | 80.2 years |
| Krause | 16 | 81.1 years |
| Miller | 14 | 79.3 years |
| Peterson | 14 | 80.2 years |
| Tekrony | 13 | 82.0 years |
| Thompson | 11 | 82.8 years |
| Hanson | 11 | 77.7 years |
| Holt | 9 | 83.7 years |
Businesses in Deuel County, SD
- Chevrolet: 1