Dorchester County, South Carolina (SC)
County owner-occupied free and clear houses and condos in 2010: 8,303
County owner-occupied houses and condos in 2000: 26,027
Renter-occupied apartments: 14,186 (it was 8,682 in 2000)
| % of renters here: | 25% |
| State: | 31% |
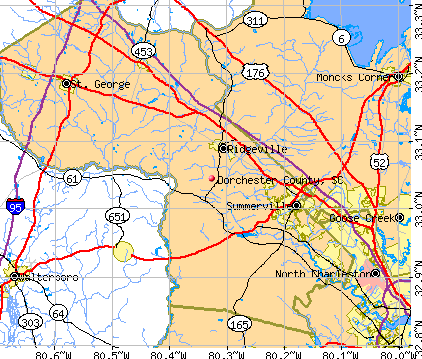
Land area: 575 sq. mi.
Water area: 2.0 sq. mi.
Population density: 289 people per square mile (high).
Industries providing employment: Educational, health and social services (21.3%), Manufacturing (13.0%), Professional, scientific, management, administrative, and waste management services (11.6%), Retail trade (11.1%).
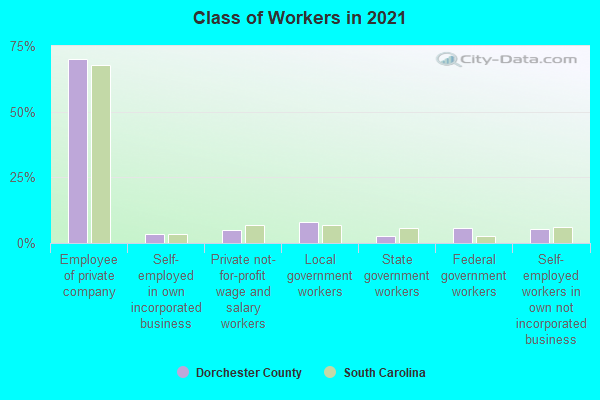
Type of workers:
- Private wage or salary: 73%
- Government: 21%
- Self-employed, not incorporated: 5%
- Unpaid family work: 0%
- OSM Map
- General Map
- Google Map
- MSN Map

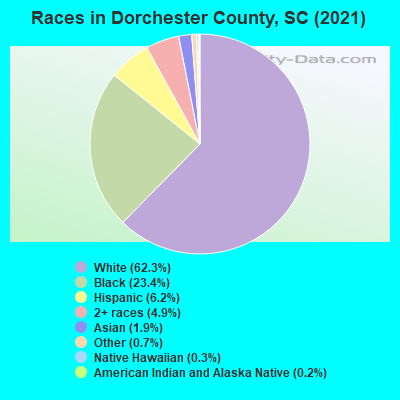
- 101,80861.3%White Non-Hispanic Alone
- 38,64123.3%Black Non-Hispanic Alone
- 10,9046.6%Hispanic or Latino
- 8,0924.9%Two or more races
- 3,7242.2%Asian alone
- 1,5530.9%American Indian and Alaska Native alone
- 1,3150.8%Some other race alone
- 960.06%Native Hawaiian and Other
Pacific Islander alone
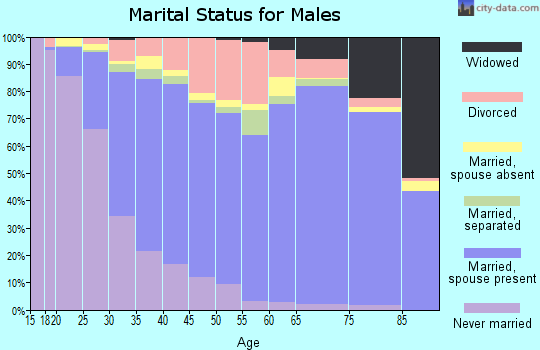
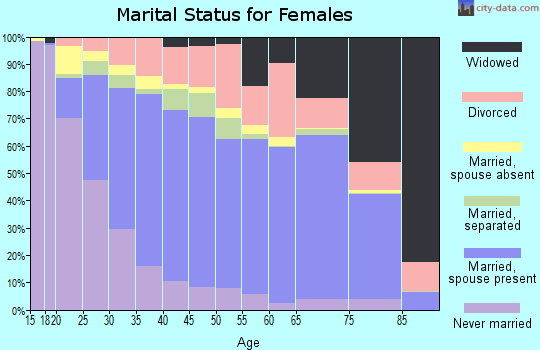
| Median resident age: | 37.6 years |
| South Carolina median age: | 40.5 years |
| Males: 83,148 | |
| Females: 82,985 |

 | In-Person Absentee Early Voting in Dorchester County (33 replies) |
| U.S. Census Bureau’s Estimates of Increases in SC’s MSA Population 2022-2023 (48 replies) |
| 2020 SC Census Number (360 replies) |
| SC was the fastest growing state in 2023 (by %) (33 replies) |
| Dorchester County Tax Bills are in the mail (0 replies) |
| Orangeburg... (48 replies) |
| Dorchester County: | 2.0 people |
| South Carolina: | 2 people |
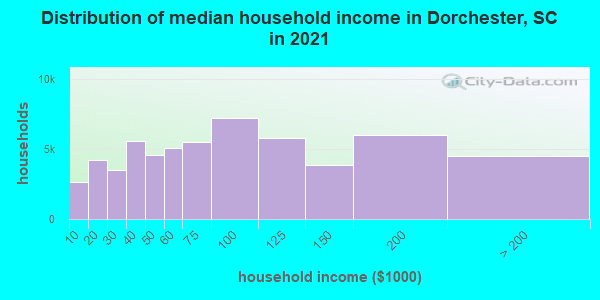
Estimated median household income in 2022: $73,791 ($43,316 in 1999)
| This county: | $73,791 |
| South Carolina: | $64,115 |
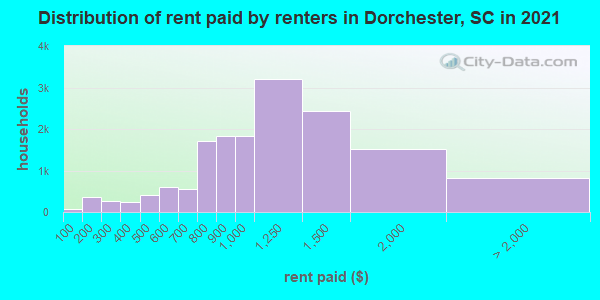
Median contract rent in 2022 for apartments: $1,087 (lower quartile is $735, upper quartile is $1,485)
| This county: | $1087 |
| State: | $893 |
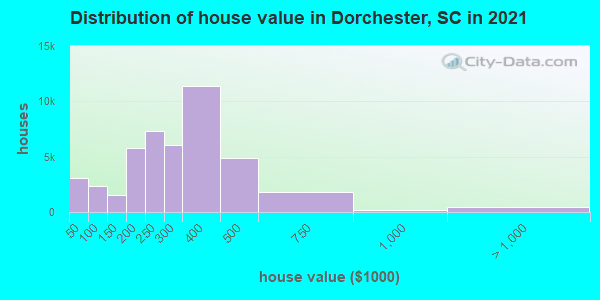
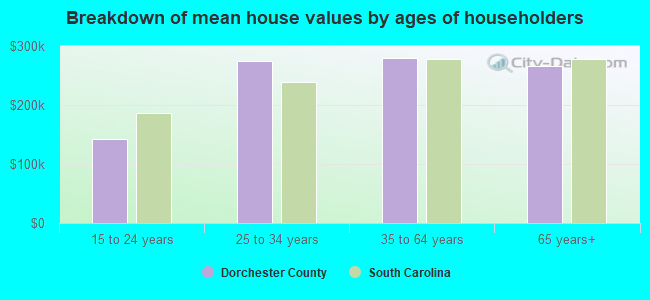
Estimated median house or condo value in 2022: $319,100 (it was $92,200 in 2000)
| Dorchester: | $319,100 |
| South Carolina: | $254,600 |
Mean price in 2022:
Median monthly housing costs for homes and condos with a mortgage: $1,603Detached houses: $371,695
Here: $371,695 State: $368,255 Townhouses or other attached units: $229,488
Here: $229,488 State: $292,023 In 2-unit structures: $227,432
Here: $227,432 State: $358,283 In 3-to-4-unit structures: $152,069
Here: $152,069 State: $230,702 In 5-or-more-unit structures: $318,519
Here: $318,519 State: $326,361 Mobile homes: $150,774
Here: $150,774 State: $102,531 Occupied boats, RVs, vans, etc.: $93,164
Here: $93,164 State: $132,484
Median monthly housing costs for units without a mortgage: $523
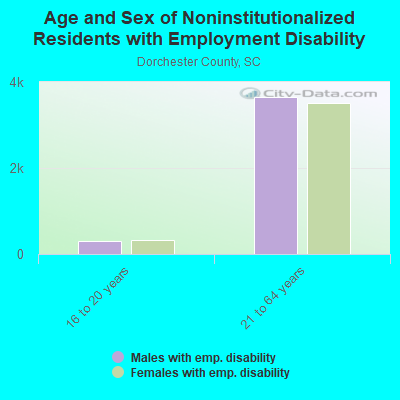
Institutionalized population: 1,948
Crime in 2021 (reported by the sheriff's office or county police, not the county total):
- Murders: 6
- Rapes: 10
- Robberies: 21
- Assaults: 233
- Burglaries: 203
- Thefts: 1071
- Auto thefts: 227
Crime in 2020 (reported by the sheriff's office or county police, not the county total):
- Murders: 4
- Rapes: 25
- Robberies: 43
- Assaults: 249
- Burglaries: 306
- Thefts: 1208
- Auto thefts: 210
Health of residents in Dorchester County based on CDC Behavioral Risk Factor Surveillance System Survey Questionnaires from 2013 to 2021:
General health status score of residents in this county from 1 (poor) to 5 (excellent) is 3.5. This is about average.73.6% of residents exercised in the past month. This is about average.
44.8% of residents smoked 100+ cigarettes in their lives. This is about average.
54.1% of adult residents drank alcohol in the past 30 days. This is less than average.
66.7% of residents visited a dentist within the past year. This is less than average.
Average weight of males is 198 pounds. This is about average.
Average weight of females is 165 pounds. This is about average.
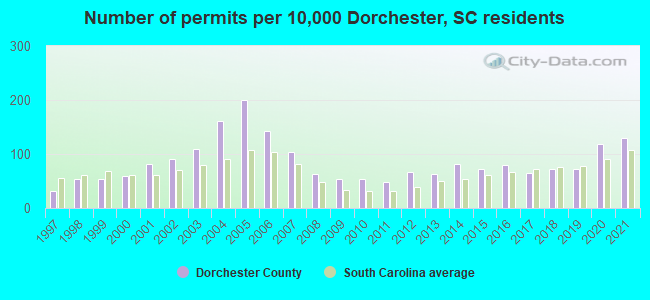
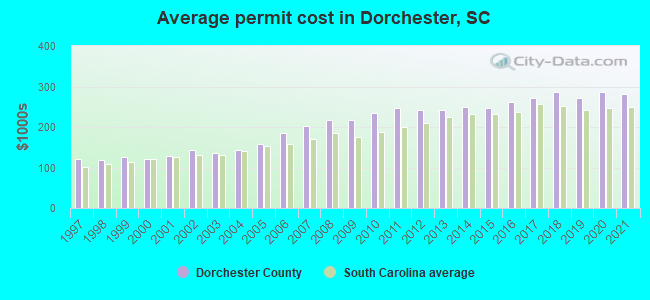
Single-family new house construction building permits:
- 2022: 1534 buildings, average cost: $339,000
- 2021: 1239 buildings, average cost: $281,600
- 2020: 1148 buildings, average cost: $287,400
- 2019: 703 buildings, average cost: $271,500
- 2018: 696 buildings, average cost: $285,500
- 2017: 624 buildings, average cost: $272,000
- 2016: 772 buildings, average cost: $261,300
- 2015: 694 buildings, average cost: $247,200
- 2014: 794 buildings, average cost: $249,000
- 2013: 609 buildings, average cost: $243,300
- 2012: 642 buildings, average cost: $242,000
- 2011: 469 buildings, average cost: $246,400
- 2010: 520 buildings, average cost: $233,900
- 2009: 515 buildings, average cost: $217,100
- 2008: 605 buildings, average cost: $216,600
- 2007: 1007 buildings, average cost: $202,500
- 2006: 1370 buildings, average cost: $185,600
- 2005: 1924 buildings, average cost: $157,100
- 2004: 1557 buildings, average cost: $143,800
- 2003: 1063 buildings, average cost: $135,900
- 2002: 869 buildings, average cost: $143,100
- 2001: 781 buildings, average cost: $128,700
- 2000: 574 buildings, average cost: $121,500
- 1999: 522 buildings, average cost: $125,300
- 1998: 515 buildings, average cost: $118,100
- 1997: 300 buildings, average cost: $119,800
Median real estate property taxes paid for housing units with mortgages in 2022: $1,943 (0.6%)
Median real estate property taxes paid for housing units with no mortgage in 2022: $1,206 (0.4%)
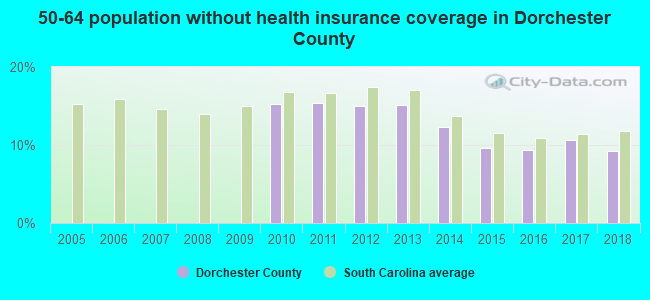
| Dorchester County: | 11.3% |
| South Carolina: | 14.0% |
Median age of residents in 2022: 37.6 years old
(Males: 35.4 years old, Females: 39.9 years old)
(Median age for: White residents: 40.5 years old, Black residents: 34.7 years old, American Indian residents: 52.2 years old, Asian residents: 38.3 years old, Hispanic or Latino residents: 27.1 years old, Other race residents: 31.6 years old)
Area name: Charleston-North Charleston, SC MSA
Fair market rent in 2006 for a 1-bedroom apartment in Dorchester County is $586 a month.
Fair market rent for a 2-bedroom apartment is $663 a month.
Fair market rent for a 3-bedroom apartment is $864 a month.
Cities in this county include: Summerville, St. George, Ridgeville, Harleyville, Reevesville.
Neighboring counties: Choctaw County, Mississippi  , Clay County, Mississippi , Coosa County, Alabama , Hampton County
  , St. Clair County, Alabama , Hopkins County, Texas .
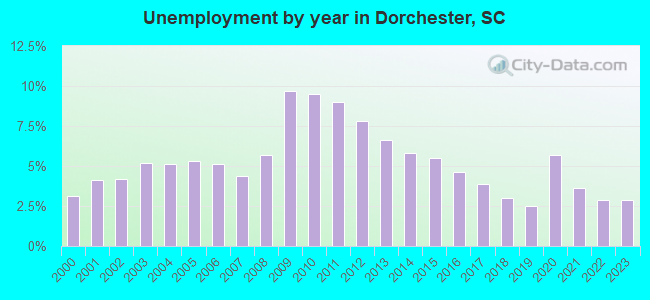
| Here: | 2.6% |
| South Carolina: | 3.1% |
Current college students: 4,471
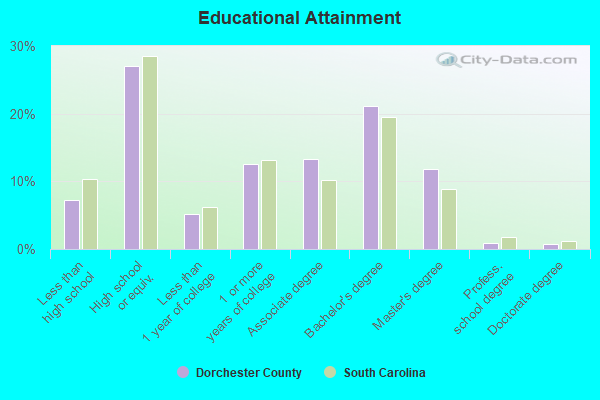
People 25 years of age or older with a high school degree or higher: 92.3%
People 25 years of age or older with a bachelor's degree or higher: 28.1%
Number of foreign born residents: 5,739 (63.8% naturalized citizens)
| Dorchester County: | 3.5% |
| Whole state: | 5.2% |
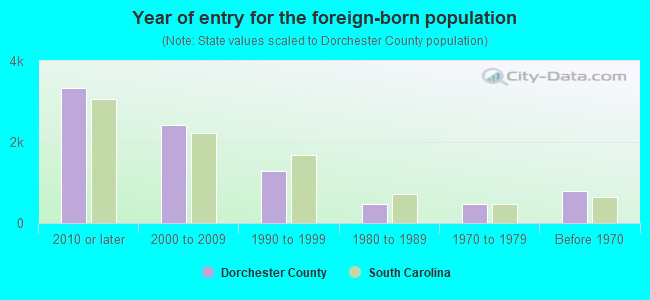
- Year of entry for the foreign-born population
- 2,8682010 or later
- 2,3982000 to 2009
- 1,0931990 to 1999
- 4691980 to 1989
- 4811970 to 1979
- 802Before 1970
Mean travel time to work (commute): minutes
Percentage of county residents living and working in this county: 99.1%
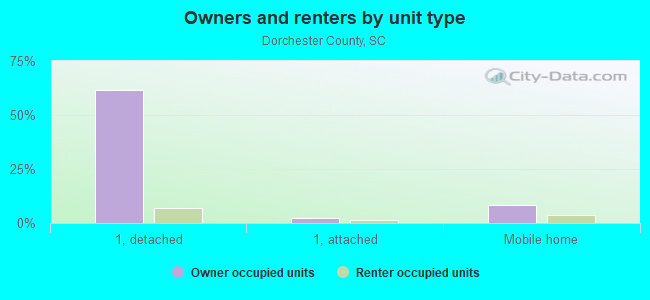
Housing units in structures:
- One, detached: 47,191
- One, attached: 4,472
- Two: 847
- 3 or 4: 923
- 5 to 9: 3,162
- 10 to 19: 1,565
- 20 to 49: 996
- 50 or more: 937
- Mobile homes: 7,728
Housing units in Dorchester County with a mortgage: 35,391 (2,559 second mortgage, 76 home equity loan, 1,369 both second mortgage and home equity loan)
Houses without a mortgage: 582
| Here: | 5.7% with mortgage |
| State: | 97.3% with mortgage |
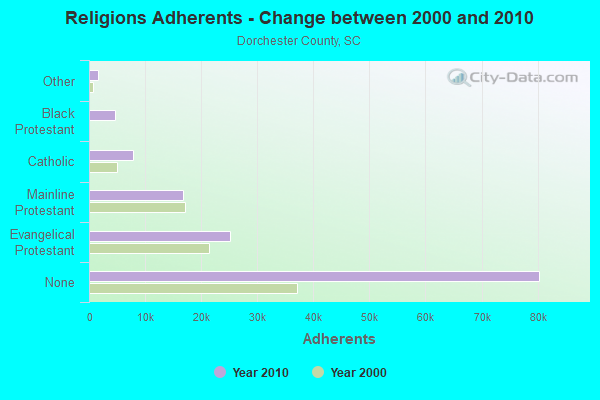
Religion statistics for Dorchester County
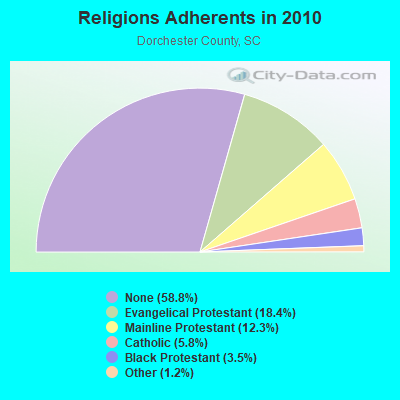
| Religion | Adherents | Congregations |
|---|---|---|
| Evangelical Protestant | 25,075 | 90 |
| Mainline Protestant | 16,775 | 43 |
| Catholic | 7,926 | 2 |
| Black Protestant | 4,722 | 24 |
| Other | 1,653 | 6 |
| Orthodox | 75 | 1 |
| None | 80,329 | - |
Source: Clifford Grammich, Kirk Hadaway, Richard Houseal, Dale E.Jones, Alexei Krindatch, Richie Stanley and Richard H.Taylor. 2012. 2010 U.S.Religion Census: Religious Congregations & Membership Study. Association of Statisticians of American Religious Bodies. Jones, Dale E., et al. 2002. Congregations and Membership in the United States 2000. Nashville, TN: Glenmary Research Center.
Food Environment Statistics:
| Dorchester County: | 1.30 / 10,000 pop. |
| State: | 1.99 / 10,000 pop. |
| Here: | 0.08 / 10,000 pop. |
| South Carolina: | 0.15 / 10,000 pop. |
| This county: | 0.16 / 10,000 pop. |
| South Carolina: | 0.85 / 10,000 pop. |
| Dorchester County: | 3.49 / 10,000 pop. |
| South Carolina: | 5.38 / 10,000 pop. |
| This county: | 4.46 / 10,000 pop. |
| State: | 7.75 / 10,000 pop. |
| Dorchester County: | 9.6% |
| South Carolina: | 10.6% |
| Dorchester County: | 31.1% |
| State: | 29.4% |
| Here: | 12.6% |
| State: | 13.4% |
Agriculture in Dorchester County:
Average size of farms: 158 acresAverage value of agricultural products sold per farm: $34,684
Average value of crops sold per acre for harvested cropland: $145.68
The value of livestock, poultry, and their products as a percentage of the total market value of agricultural products sold: 79.19%
Average total farm production expenses per farm: $38,103
Harvested cropland as a percentage of land in farms: 31.30%
Average market value of all machinery and equipment per farm: $53,131
The percentage of farms operated by a family or individual: 89.04%
Average age of principal farm operators: 56 years
Average number of cattle and calves per 100 acres of all land in farms: 7.46
Corn for grain: 6860 harvested acres
All wheat for grain: 435 harvested acres
Upland cotton: 3653 harvested acres
Soybeans for beans: 2963 harvested acres
Vegetables: 147 harvested acres
Land in orchards: 156 acres
Earthquake activity:
Dorchester County-area historical earthquake activity is significantly above South Carolina state average. It is 46% smaller than the overall U.S. average.On 11/22/1974 at 05:25:55, a magnitude 4.7 (4.7 MB, Class: Light, Intensity: IV - V) earthquake occurred 14.5 miles away from Dorchester County center
On 8/21/1992 at 16:31:55, a magnitude 4.4 (4.1 MB, 4.1 LG, 4.4 LG, Depth: 6.2 mi) earthquake occurred 12.3 miles away from the county center
On 8/2/1974 at 08:52:09, a magnitude 4.9 (4.3 MB, 4.9 LG) earthquake occurred 137.2 miles away from the county center
On 8/23/2011 at 17:51:04, a magnitude 5.8 (5.8 MW, Depth: 3.7 mi, Class: Moderate, Intensity: VI - VII) earthquake occurred 362.5 miles away from the county center
On 8/9/2020 at 12:07:37, a magnitude 5.1 (5.1 MW, Depth: 4.7 mi) earthquake occurred 241.3 miles away from Dorchester County center
On 4/17/1995 at 13:45:57, a magnitude 3.9 (3.9 LG, Depth: 6.2 mi, Class: Light, Intensity: II - III) earthquake occurred 16.5 miles away from the county center
Magnitude types: regional Lg-wave magnitude (LG), body-wave magnitude (MB), moment magnitude (MW)
Most recent natural disasters:
- South Carolina Covid-19 Pandemic, Incident Period: January 20, 2020, FEMA Id: 4492, Natural disaster type: Other
- South Carolina Hurricane Dorian, Incident Period: August 31, 2019 - September 6, 2019, FEMA Id: 4464, Natural disaster type: Hurricane
- South Carolina Hurricane Florence, Incident Period: September 8, 2018 - October 8, 2018, FEMA Id: 4394, Natural disaster type: Hurricane
- South Carolina Hurricane Irma, Incident Period: September 6, 2017 - September 13, 2017, FEMA Id: 4346, Natural disaster type: Hurricane
- South Carolina Hurricane Matthew, Incident Period: October 04, 2016 to October 30, 2016, Emergency Declared EM-3378: October 06, 2016, FEMA Id: 3378, Natural disaster type: Hurricane
- South Carolina Hurricane Matthew, Incident Period: October 04, 2016 to October 30, 2016, Major Disaster (Presidential) Declared DR-4286: October 11, 2016, FEMA Id: 4286, Natural disaster type: Hurricane
- South Carolina Severe Storms and Flooding, Incident Period: October 01, 2015 to October 23, 2015, Emergency Declared EM-3373: October 03, 2015, FEMA Id: 3373, Natural disaster type: Storm, Flood
- South Carolina Severe Storms and Flooding, Incident Period: October 01, 2015 to October 23, 2015, Major Disaster (Presidential) Declared DR-4241: October 05, 2015, FEMA Id: 4241, Natural disaster type: Storm, Flood
- South Carolina Severe Winter Storm, Incident Period: February 10, 2014 to February 19, 2014, Emergency Declared EM-3369: February 12, 2014, FEMA Id: 3369, Natural disaster type: Winter Storm
- South Carolina Severe Winter Storm, Incident Period: February 10, 2014 to February 15, 2014, Major Disaster (Presidential) Declared DR-4166: March 12, 2014, FEMA Id: 4166, Natural disaster type: Winter Storm
- 5 other natural disasters have been reported since 1953.
The number of natural disasters in Dorchester County (15) is near the US average (15).
Major Disasters (Presidential) Declared: 6
Emergencies Declared: 5
Causes of natural disasters: Hurricanes: 9, Winter Storms: 3, Floods: 2, Storms: 2, Other: 1 (Note: some incidents may be assigned to more than one category).
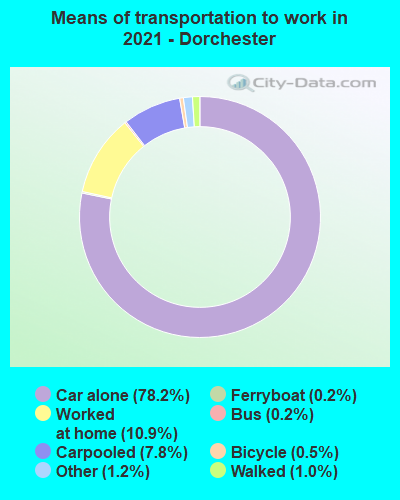
Means of transportation to work:
- Drove a car alone: 37,246 (74.5%)
- Carpooled: 3,712 (7.4%)
- Bus: 58 (0.1%)
- Ferryboat: 63 (0.1%)
- Taxicab, motorcycle, or other means: 668 (1.3%)
- Bicycle: 338 (0.7%)
- Walked: 382 (0.8%)
- Worked at home: 8,190 (16.4%)
- Health care and social assistance (18%)
- Retail trade (12%)
- Educational services (10%)
- Accommodation and food services (9%)
- Professional, scientific, and technical services (7%)
- Manufacturing (6%)
- Transportation and warehousing (6%)

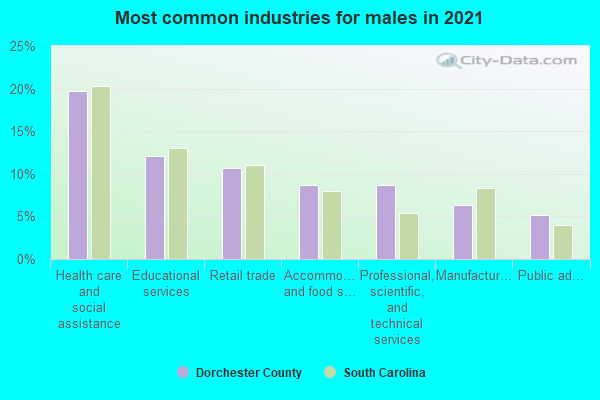
- Health care and social assistance (21%)
- Retail trade (14%)
- Educational services (11%)
- Accommodation and food services (10%)
- Professional, scientific, and technical services (8%)
- Manufacturing (7%)
- Transportation and warehousing (7%)
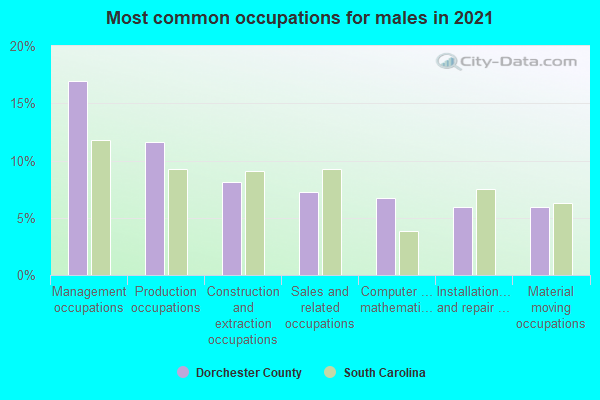
- Management occupations (12%)
- Production occupations (11%)
- Installation, maintenance, and repair occupations (10%)
- Construction and extraction occupations (8%)
- Sales and related occupations (7%)
- Transportation occupations (7%)
- Material moving occupations (6%)
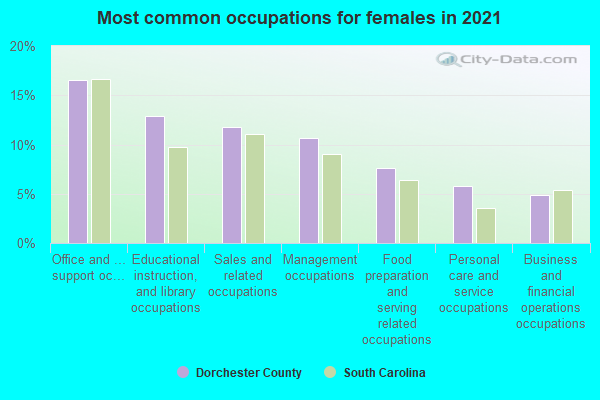
- Office and administrative support occupations (23%)
- Sales and related occupations (11%)
- Management occupations (9%)
- Educational instruction, and library occupations (8%)
- Food preparation and serving related occupations (7%)
- Health diagnosing and treating practitioners and other technical occupations (7%)
- Healthcare support occupations (6%)
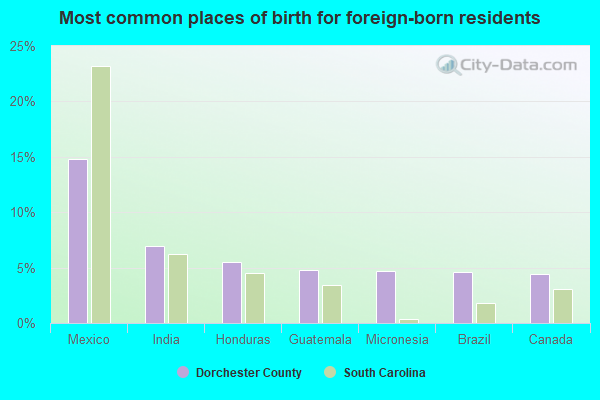
- Mexico (15%)
- India (10%)
- Brazil (6%)
- Canada (6%)
- Philippines (5%)
- Guatemala (4%)
- Honduras (4%)
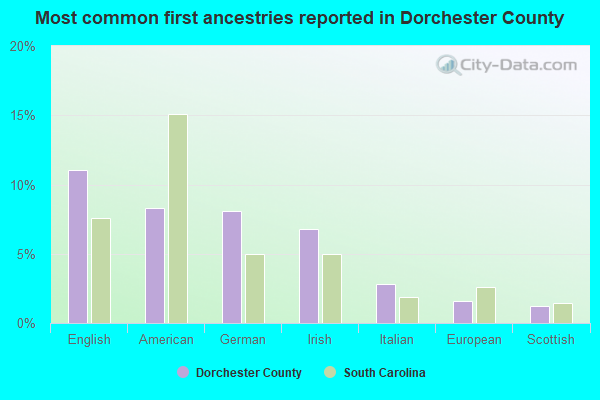
- English (12%)
- American (9%)
- German (8%)
- Irish (7%)
- Italian (3%)
- European (2%)
- Scottish (2%)
People in group quarters in Dorchester County, South Carolina in 2010:
- 1,385 people in state prisons
- 250 people in nursing facilities/skilled-nursing facilities
- 216 people in local jails and other municipal confinement facilities
- 61 people in residential treatment centers for juveniles (non-correctional)
- 36 people in group homes for juveniles (non-correctional)
- 30 people in group homes intended for adults
- 18 people in emergency and transitional shelters (with sleeping facilities) for people experiencing homelessness
- 15 people in residential treatment centers for adults
- 4 people in other noninstitutional facilities
People in group quarters in Dorchester County, South Carolina in 2000:
- 1,127 people in state prisons
- 470 people in nursing homes
- 209 people in homes for the mentally retarded
- 111 people in local jails and other confinement facilities (including police lockups)
- 108 people in other noninstitutional group quarters
- 21 people in homes or halfway houses for drug/alcohol abuse
- 20 people in other nonhousehold living situations
- 14 people in other group homes
- 5 people in other workers' dormitories
- 3 people in homes for the physically handicapped
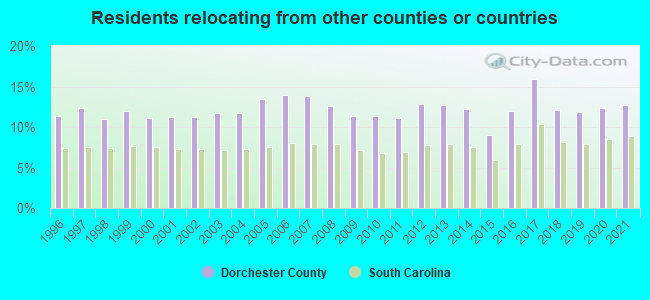
12.66% of this county's 2021 resident taxpayers lived in other counties in 2020 ($54,462 average adjusted gross income)
| Here: | 12.66% |
| South Carolina average: | 8.89% |
0.08% of residents moved from foreign countries ($411 average AGI)
Dorchester County: 0.08% South Carolina average: 0.04%
7.87% relocated from other counties in South Carolina ($29,253 average AGI)
4.72% relocated from other states ($24,797 average AGI)
Dorchester County: 4.72% South Carolina average: 4.96%
Top counties from which taxpayers relocated into this county between 2020 and 2021:
| from Charleston County, SC | |
| from Berkeley County, SC | |
| from Colleton County, SC | |
| from Orangeburg County, SC | |
| from Richland County, SC | |
| from Horry County, SC | |
| from Mecklenburg County, NC |
11.64% of this county's 2020 resident taxpayers moved to other counties in 2021 ($54,836 average adjusted gross income)
| Here: | 11.64% |
| South Carolina average: | 7.46% |
0.08% of residents moved to foreign countries ($507 average AGI)
Dorchester County: 0.08% South Carolina average: 0.03%
7.51% relocated to other counties in South Carolina ($33,117 average AGI)
4.05% relocated to other states ($21,211 average AGI)
Dorchester County: 4.05% South Carolina average: 3.47%

Top counties to which taxpayers relocated from this county between 2020 and 2021:
| to Berkeley County, SC | |
| to Charleston County, SC | |
| to Colleton County, SC | |
| to Orangeburg County, SC | |
| to Richland County, SC | |
| to Greenville County, SC | |
| to Horry County, SC |
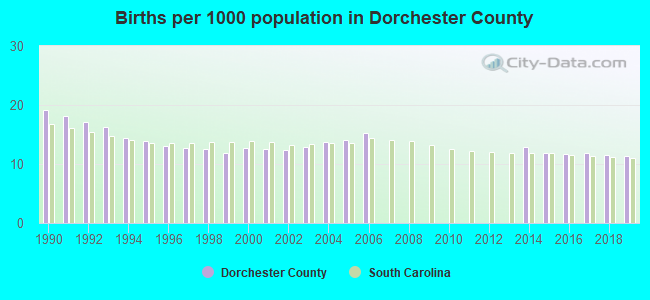
Births per 1000 population from 1990 to 1999: 14.9
Births per 1000 population from 2000 to 2009: 9.4
Births per 1000 population from 2010 to 2022: 6.4
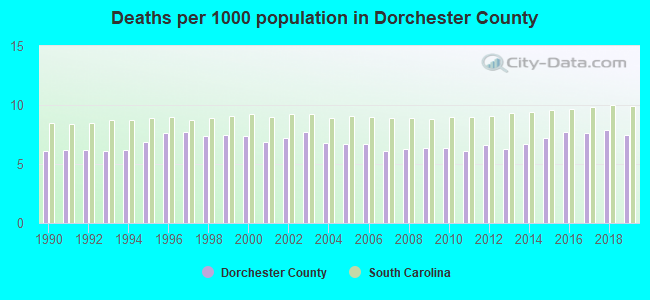
Deaths per 1000 population from 1990 to 1999: 6.8
Deaths per 1000 population from 2000 to 2009: 6.8
Deaths per 1000 population from 2010 to 2020: 7.2
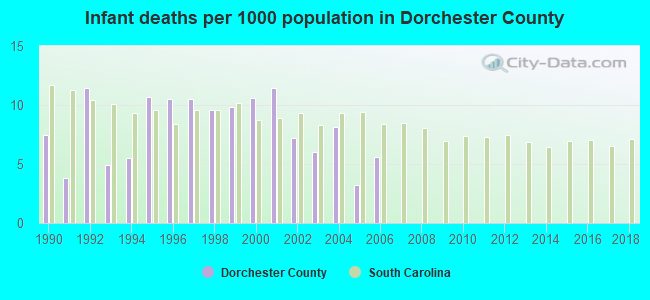
Infant deaths per 1000 live births from 1990 to 1999: 8.4
Infant deaths per 1000 live births from 2000 to 2006: 7.4
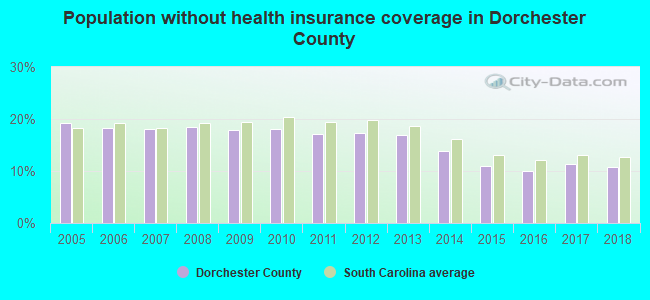
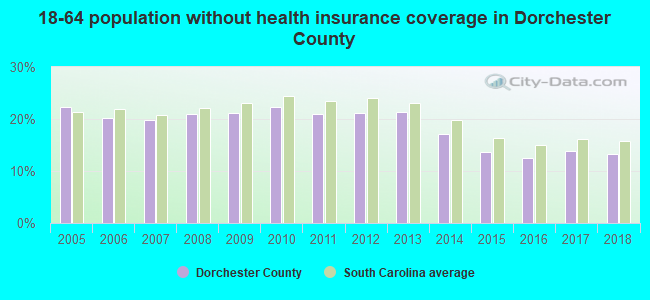
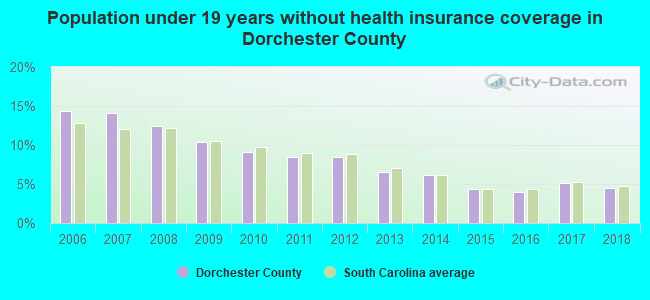
Persons under 19 years old without health insurance coverage in 2018: 4.5%
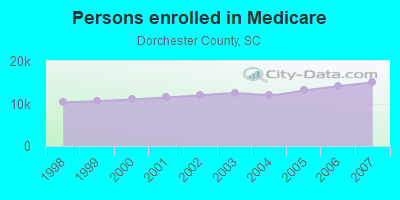
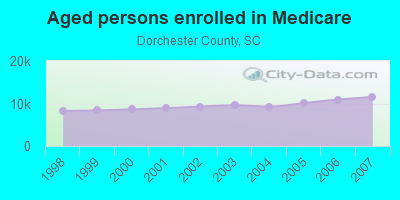
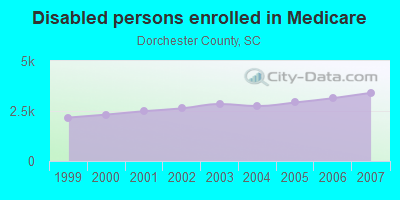
Persons enrolled in hospital insurance and/or supplemental medical insurance (Medicare) in July 1, 2007: 14,962 (11,554 aged, 3,408 disabled)
Children under 18 without health insurance coverage in 2007: 4,544 (13%)
Most common underlying causes of death in Dorchester County, South Carolina in 1999 - 2019:
- Bronchus or lung, unspecified - Malignant neoplasms (1,183)
- Acute myocardial infarction, unspecified (1,130)
- Atherosclerotic heart disease (867)
- Chronic obstructive pulmonary disease, unspecified (843)
- Stroke, not specified as haemorrhage or infarction (748)
- Alzheimer disease, unspecified (600)
- Unspecified dementia (442)
- Congestive heart failure (368)
- Colon, unspecified - Malignant neoplasms (307)
- Breast, unspecified - Malignant neoplasms (288)
Population without health insurance coverage in 2000: 13%
Children under 18 without health insurance coverage in 2000: 10%
Short term general hospital admissions per 100,000 population in 2004: 5,103
Short term general hospital beds per 100,000 population in 2004: 75
Emergency room visits per 100,000 population in 2004: 30,027
General practice office based MDs per 100,000 population in 2005: 1,359
Medical specialist MDs per 100,000 population in 2005: 649
Dentists per 100,000 population in 1998: 5
Total births per 100,000 population, July 2005 - July 2006 : 43
Total deaths per 100,000 population, July 2005 - July 2006: 62
Limited-service eating places per 100,000 population in 2005 : 10
Homicides per 1,000,000 population from 2000 to 2006: 49.0. This is less than state average.
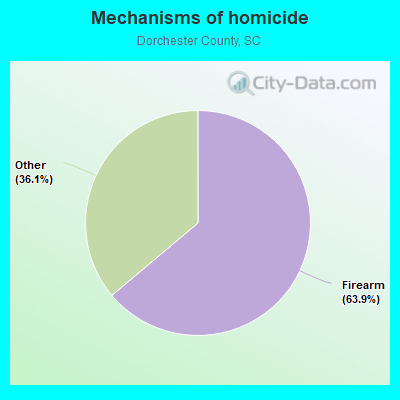
- Firearm - 31.3
- Other - 17.7
Suicides per 1,000,000 population from 2000 to 2006: 107.5. This is less than state average.
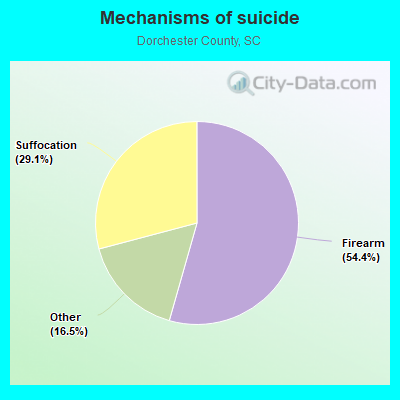
- Firearm - 58.5
- Suffocation - 31.3
- Other - 17.7
Household type by relationship:
Households: 166,133- Male householders: 30,391 (5,784 living alone), Female householders: 33,792 (8,990 living alone)
33,249 spouses (32,766 opposite-sex spouses), 3,319 unmarried partners, (3,242 opposite-sex unmarried partners), 49,977 children (45,815 natural, 1,688 adopted, 2,474 stepchildren), 3,549 grandchildren, 1,754 brothers or sisters, 1,800 parents, 263 foster children, 1,419 other relatives, 4,368 non-relatives
- In group quarters: 2,252
Size of family households: 21,040 2-persons, 10,123 3-persons, 9,148 4-persons, 3,860 5-persons, 1,632 6-persons, 288 7-or-more-persons.
Size of nonfamily households: 14,774 1-person, 2,773 2-persons, 307 3-persons, 238 5-persons.
24,442 married couples with children.
10,330 single-parent households (3,084 men, 7,246 women).
92.6% of residents of Dorchester speak English at home.
3.9% of residents speak Spanish at home (61% speak English very well, 20% speak English well, 17% speak English not well, 2% don't speak English at all).
2.0% of residents speak other Indo-European language at home (78% speak English very well, 14% speak English well, 8% speak English not well).
1.1% of residents speak Asian or Pacific Island language at home (59% speak English very well, 24% speak English well, 15% speak English not well, 2% don't speak English at all).
0.2% of residents speak other language at home (93% speak English very well, 4% speak English well, 3% don't speak English at all).
In fiscal year 2004:
Federal Government expenditure: $504,666,000 ($4,716 per capita)
Department of Defense expenditure: $109,151,000
Federal direct payments to individuals for retirement and disability: $303,569,000
Federal other direct payments to individuals: $74,203,000
Federal direct payments not to individuals: $1,953,000
Federal grants: $77,410,000
Federal procurement contracts: $35,996,000 ($32,874,000 Department of Defense)
Federal salaries and wages: $11,534,000 ($261,000 Department of Defense)
Federal Government direct loans: $1,233,000
Federal guaranteed/insured loans: $117,472,000
Federal Government insurance: $241,780,000
Population change from April 1, 2000 to July 1, 2005:
Births: 6,817| Here: | 60 per 1000 residents |
| State: | 69 per 1000 residents |
Deaths: 3,943
| Here: | 35 per 1000 residents |
| State: | 46 per 1000 residents |
Net international migration: +556
| Here: | +5 per 1000 residents |
| State: | +9 per 1000 residents |
Net internal migration: +13,319
| Here: | +118 per 1000 residents |
| State: | +27 per 1000 residents |
Total withdrawal of fresh water for public supply: 13.16 millions of gallons per day (9% from ground, 91% from surface)
| Here: | 6.6 |
| State: | 6.4 |
| Here: | 4.7 |
| State: | 4.5 |
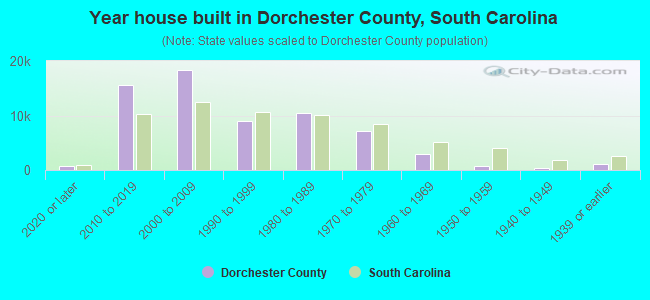
- Year house built in Dorchester County, South Carolina
- 2,5512020 or later
- 12,7162010 to 2019
- 18,3352000 to 2009
- 10,3411990 to 1999
- 10,9221980 to 1989
- 6,9831970 to 1979
- 3,9461960 to 1969
- 3681950 to 1959
- 1,0881940 to 1949
- 5711939 or earlier

- Rooms in owner-occupied houses in Dorchester County, South Carolina
- 2141 room
- 02 rooms
- 5783 rooms
- 2,6854 rooms
- 10,2415 rooms
- 11,1196 rooms
- 9,2687 rooms
- 7,6478 rooms
- 9,5079+ rooms
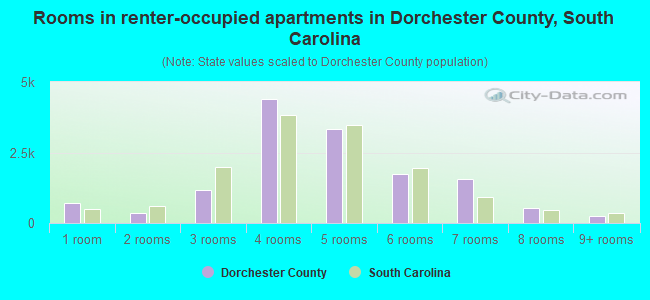
- Rooms in renter-occupied apartments in Dorchester County, South Carolina
- 3251 room
- 3422 rooms
- 1,2843 rooms
- 3,9634 rooms
- 3,0425 rooms
- 2,0196 rooms
- 5397 rooms
- 7278 rooms
- 6839+ rooms
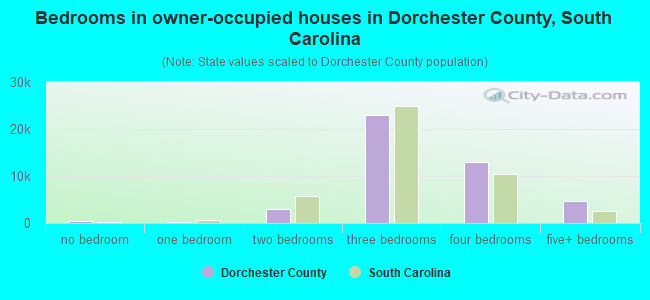
- Bedrooms in owner-occupied houses in Dorchester County, South Carolina
- 229no bedroom
- 1651 bedroom
- 3,6132 bedrooms
- 26,1493 bedrooms
- 17,0134 bedrooms
- 4,0905+ bedrooms
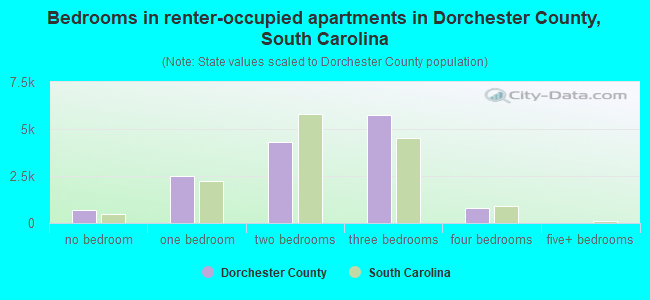
- Bedrooms in renter-occupied apartments in Dorchester County, South Carolina
- 623no bedroom
- 2,0691 bedroom
- 4,8982 bedrooms
- 4,3843 bedrooms
- 9304 bedrooms
- 205+ bedrooms
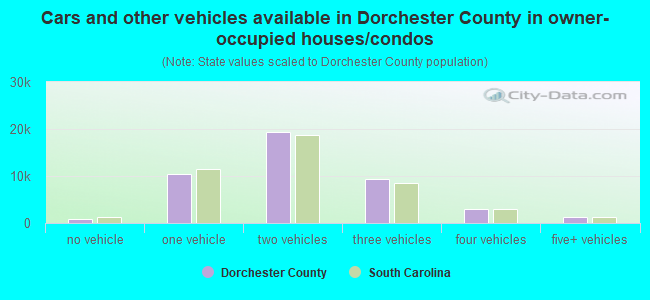
- Cars and other vehicles available in Dorchester County in owner-occupied houses/condos
- 1,213no vehicle
- 12,2781 vehicle
- 22,8782 vehicles
- 10,2493 vehicles
- 3,8444 vehicles
- 7975+ vehicles
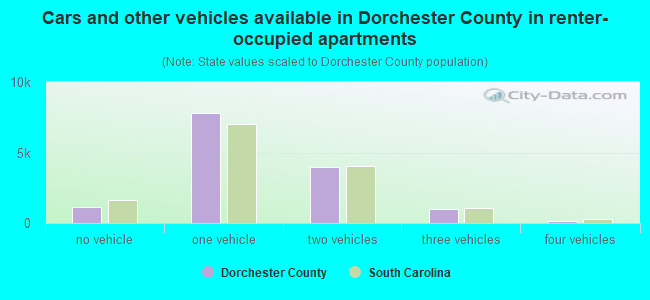
- Cars and other vehicles available in Dorchester County in renter-occupied apartments
- 1,060no vehicle
- 6,5131 vehicle
- 4,5242 vehicles
- 4073 vehicles
- 4004 vehicles
- 205+ vehicles
86.8% of Dorchester County residents lived in the same house 1 years ago.
Out of people who lived in different houses, 28% lived in this county.
Out of people who lived in different counties, 45% lived in South Carolina.
| Dorchester County: | 86.8% |
| State average: | 86.5% |
Place of birth for U.S.-born residents:
- This state: 82,482
- Other state: 75,356
- Northeast: 19,560
- Midwest: 19,162
- South: 28,087
- West: 8,547
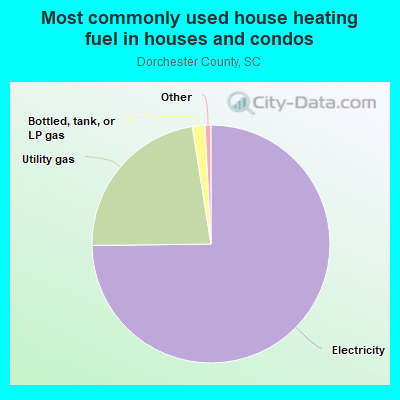
- 72.8%Electricity
- 24.5%Utility gas
- 1.7%Bottled, tank, or LP gas
- 0.4%No fuel used
- 0.3%Solar energy
- 0.2%Wood
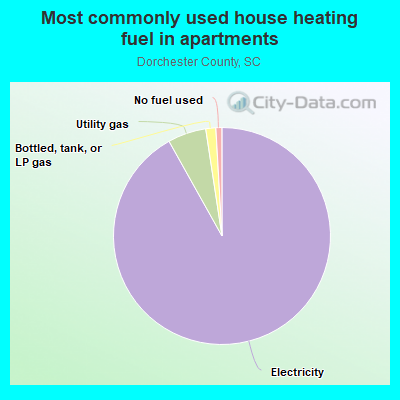
- 91.1%Electricity
- 5.9%Utility gas
- 1.5%No fuel used
- 1.4%Bottled, tank, or LP gas
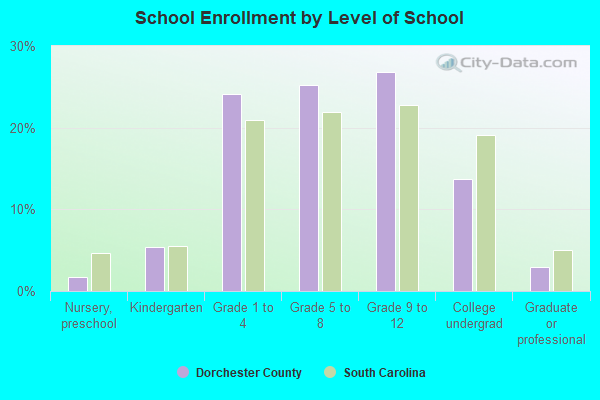
Private vs. public school enrollment:
| Here: | 11.5% |
| South Carolina: | 14.4% |
| Here: | 15.4% |
| South Carolina: | 11.1% |
| Here: | 17.2% |
| South Carolina: | 21.9% |
Dorchester County government finances - Expenditure in 2018:
- Bond Funds - Cash and Securities: $136,515,000
- Charges - Sewerage: $18,250,000
Solid Waste Management: $7,052,000
Solid Waste Management: $6,242,000
Other: $5,685,000
Other: $2,863,000
Miscellaneous Commercial Activities: $403,000
Miscellaneous Commercial Activities: $266,000
Sewerage: $63,000
Air Transportation: $8,000
Air Transportation: $8,000
- Construction - Police Protection: $42,000
- Current Operations - Police Protection: $24,372,000
Police Protection: $20,089,000
General - Other: $11,819,000
Correctional Institutions: $7,604,000
Central Staff Services: $6,041,000
Judicial and Legal Services: $5,921,000
Local Fire Protection: $5,809,000
General Public Buildings: $4,767,000
General Public Buildings: $4,152,000
Correctional Institutions: $3,959,000
Judicial and Legal Services: $3,938,000
Sewerage: $3,331,000
Regular Highways: $2,586,000
Financial Administration: $2,321,000
Regular Highways: $2,256,000
Financial Administration: $2,131,000
Central Staff Services: $1,488,000
Solid Waste Management: $1,159,000
General - Other: $935,000
Health - Other: $665,000
Air Transportation: $166,000
Parks and Recreation: $71,000
Air Transportation: $14,000
Health - Other: $11,000
- Federal Intergovernmental - Other: $177,000
Air Transportation: $166,000
Other: $26,000
- General - Interest on Debt: $4,786,000
- Long Term Debt - Outstanding Unspecified Public Purpose: $198,735,000
Beginning Outstanding - Unspecified Public Purpose: $170,833,000
Beginning Outstanding - Unspecified Public Purpose: $122,082,000
Outstanding Unspecified Public Purpose: $113,977,000
Beginning Outstanding - Public Debt for Private Purpose: $54,182,000
Outstanding Nonguaranteed - Industrial Revenue: $50,632,000
Beginning Outstanding - Public Debt for Private Purpose: $47,082,000
Outstanding Nonguaranteed - Industrial Revenue: $43,532,000
Issue, Unspecified Public Purpose: $41,913,000
Retired Unspecified Public Purpose: $14,011,000
Retired Unspecified Public Purpose: $8,105,000
Retired Nonguaranteed - Public Debt for Private Purpose: $3,550,000
Retired Nonguaranteed - Public Debt for Private Purpose: $3,550,000
- Miscellaneous - General Revenue - Other: $14,869,000
General Revenue - Other: $4,520,000
Interest Earnings: $2,336,000
Fines and Forfeits: $1,716,000
Fines and Forfeits: $1,349,000
Interest Earnings: $376,000
Sale of Property: $291,000
Rents: $68,000
Rents: $12,000
- Other Capital Outlay - Police Protection: $1,260,000
Financial Administration: $76,000
Police Protection: $65,000
Air Transportation: $32,000
Judicial and Legal Services: $13,000
Health - Other: $3,000
- Other Funds - Cash and Securities: $175,627,000
Cash and Securities: $103,616,000
- Revenue - Water Utilities: $32,117,000
Water Utilities: $5,230,000
- Sinking Funds - Cash and Securities: $53,790,000
Cash and Securities: $49,372,000
- State Intergovernmental - General Local Government Support: $5,490,000
General Local Government Support: $4,971,000
Other: $953,000
Other: $822,000
Sewerage: $457,000
Sewerage: $124,000
Public Welfare: $120,000
Public Welfare: $33,000
Health and Hospitals: $14,000
Health and Hospitals: $13,000
- Tax - Property: $49,884,000
Property: $37,043,000
General Sales and Gross Receipts: $17,055,000
Occupation and Business License - Other: $4,181,000
Occupation and Business License - Other: $2,299,000
Other: $1,211,000
Public Utility License: $807,000
Other License: $14,000
- Total Salaries and Wages: $48,518,000
: $39,964,000
- Water Utilities - Interest on Debt: $1,904,000
Dorchester County government finances - Revenue in 2018:
- Bond Funds - Cash and Securities: $136,515,000
- Charges - Sewerage: $18,250,000
Solid Waste Management: $7,052,000
Solid Waste Management: $6,242,000
Other: $5,685,000
Other: $2,863,000
Miscellaneous Commercial Activities: $403,000
Miscellaneous Commercial Activities: $266,000
Sewerage: $63,000
Air Transportation: $8,000
Air Transportation: $8,000
- Construction - Police Protection: $42,000
- Current Operations - Police Protection: $24,372,000
Police Protection: $20,089,000
General - Other: $11,819,000
Correctional Institutions: $7,604,000
Central Staff Services: $6,041,000
Judicial and Legal Services: $5,921,000
Local Fire Protection: $5,809,000
General Public Buildings: $4,767,000
General Public Buildings: $4,152,000
Correctional Institutions: $3,959,000
Judicial and Legal Services: $3,938,000
Sewerage: $3,331,000
Regular Highways: $2,586,000
Financial Administration: $2,321,000
Regular Highways: $2,256,000
Financial Administration: $2,131,000
Central Staff Services: $1,488,000
Solid Waste Management: $1,159,000
General - Other: $935,000
Health - Other: $665,000
Air Transportation: $166,000
Parks and Recreation: $71,000
Air Transportation: $14,000
Health - Other: $11,000
- Federal Intergovernmental - Other: $177,000
Air Transportation: $166,000
Other: $26,000
- General - Interest on Debt: $4,786,000
- Long Term Debt - Outstanding Unspecified Public Purpose: $198,735,000
Beginning Outstanding - Unspecified Public Purpose: $170,833,000
Beginning Outstanding - Unspecified Public Purpose: $122,082,000
Outstanding Unspecified Public Purpose: $113,977,000
Beginning Outstanding - Public Debt for Private Purpose: $54,182,000
Outstanding Nonguaranteed - Industrial Revenue: $50,632,000
Beginning Outstanding - Public Debt for Private Purpose: $47,082,000
Outstanding Nonguaranteed - Industrial Revenue: $43,532,000
Issue, Unspecified Public Purpose: $41,913,000
Retired Unspecified Public Purpose: $14,011,000
Retired Unspecified Public Purpose: $8,105,000
Retired Nonguaranteed - Public Debt for Private Purpose: $3,550,000
Retired Nonguaranteed - Public Debt for Private Purpose: $3,550,000
- Miscellaneous - General Revenue - Other: $14,869,000
General Revenue - Other: $4,520,000
Interest Earnings: $2,336,000
Fines and Forfeits: $1,716,000
Fines and Forfeits: $1,349,000
Interest Earnings: $376,000
Sale of Property: $291,000
Rents: $68,000
Rents: $12,000
- Other Capital Outlay - Police Protection: $1,260,000
Financial Administration: $76,000
Police Protection: $65,000
Air Transportation: $32,000
Judicial and Legal Services: $13,000
Health - Other: $3,000
- Other Funds - Cash and Securities: $175,627,000
Cash and Securities: $103,616,000
- Revenue - Water Utilities: $32,117,000
Water Utilities: $5,230,000
- Sinking Funds - Cash and Securities: $53,790,000
Cash and Securities: $49,372,000
- State Intergovernmental - General Local Government Support: $5,490,000
General Local Government Support: $4,971,000
Other: $953,000
Other: $822,000
Sewerage: $457,000
Sewerage: $124,000
Public Welfare: $120,000
Public Welfare: $33,000
Health and Hospitals: $14,000
Health and Hospitals: $13,000
- Tax - Property: $49,884,000
Property: $37,043,000
General Sales and Gross Receipts: $17,055,000
Occupation and Business License - Other: $4,181,000
Occupation and Business License - Other: $2,299,000
Other: $1,211,000
Public Utility License: $807,000
Other License: $14,000
- Total Salaries and Wages: $48,518,000
: $39,964,000
- Water Utilities - Interest on Debt: $1,904,000
Dorchester County government finances - Debt in 2018:
- Bond Funds - Cash and Securities: $136,515,000
- Charges - Sewerage: $18,250,000
Solid Waste Management: $7,052,000
Solid Waste Management: $6,242,000
Other: $5,685,000
Other: $2,863,000
Miscellaneous Commercial Activities: $403,000
Miscellaneous Commercial Activities: $266,000
Sewerage: $63,000
Air Transportation: $8,000
Air Transportation: $8,000
- Construction - Police Protection: $42,000
- Current Operations - Police Protection: $24,372,000
Police Protection: $20,089,000
General - Other: $11,819,000
Correctional Institutions: $7,604,000
Central Staff Services: $6,041,000
Judicial and Legal Services: $5,921,000
Local Fire Protection: $5,809,000
General Public Buildings: $4,767,000
General Public Buildings: $4,152,000
Correctional Institutions: $3,959,000
Judicial and Legal Services: $3,938,000
Sewerage: $3,331,000
Regular Highways: $2,586,000
Financial Administration: $2,321,000
Regular Highways: $2,256,000
Financial Administration: $2,131,000
Central Staff Services: $1,488,000
Solid Waste Management: $1,159,000
General - Other: $935,000
Health - Other: $665,000
Air Transportation: $166,000
Parks and Recreation: $71,000
Air Transportation: $14,000
Health - Other: $11,000
- Federal Intergovernmental - Other: $177,000
Air Transportation: $166,000
Other: $26,000
- General - Interest on Debt: $4,786,000
- Long Term Debt - Outstanding Unspecified Public Purpose: $198,735,000
Beginning Outstanding - Unspecified Public Purpose: $170,833,000
Beginning Outstanding - Unspecified Public Purpose: $122,082,000
Outstanding Unspecified Public Purpose: $113,977,000
Beginning Outstanding - Public Debt for Private Purpose: $54,182,000
Outstanding Nonguaranteed - Industrial Revenue: $50,632,000
Beginning Outstanding - Public Debt for Private Purpose: $47,082,000
Outstanding Nonguaranteed - Industrial Revenue: $43,532,000
Issue, Unspecified Public Purpose: $41,913,000
Retired Unspecified Public Purpose: $14,011,000
Retired Unspecified Public Purpose: $8,105,000
Retired Nonguaranteed - Public Debt for Private Purpose: $3,550,000
Retired Nonguaranteed - Public Debt for Private Purpose: $3,550,000
- Miscellaneous - General Revenue - Other: $14,869,000
General Revenue - Other: $4,520,000
Interest Earnings: $2,336,000
Fines and Forfeits: $1,716,000
Fines and Forfeits: $1,349,000
Interest Earnings: $376,000
Sale of Property: $291,000
Rents: $68,000
Rents: $12,000
- Other Capital Outlay - Police Protection: $1,260,000
Financial Administration: $76,000
Police Protection: $65,000
Air Transportation: $32,000
Judicial and Legal Services: $13,000
Health - Other: $3,000
- Other Funds - Cash and Securities: $175,627,000
Cash and Securities: $103,616,000
- Revenue - Water Utilities: $32,117,000
Water Utilities: $5,230,000
- Sinking Funds - Cash and Securities: $53,790,000
Cash and Securities: $49,372,000
- State Intergovernmental - General Local Government Support: $5,490,000
General Local Government Support: $4,971,000
Other: $953,000
Other: $822,000
Sewerage: $457,000
Sewerage: $124,000
Public Welfare: $120,000
Public Welfare: $33,000
Health and Hospitals: $14,000
Health and Hospitals: $13,000
- Tax - Property: $49,884,000
Property: $37,043,000
General Sales and Gross Receipts: $17,055,000
Occupation and Business License - Other: $4,181,000
Occupation and Business License - Other: $2,299,000
Other: $1,211,000
Public Utility License: $807,000
Other License: $14,000
- Total Salaries and Wages: $48,518,000
: $39,964,000
- Water Utilities - Interest on Debt: $1,904,000
Dorchester County government finances - Cash and Securities in 2018:
- Bond Funds - Cash and Securities: $136,515,000
- Charges - Sewerage: $18,250,000
Solid Waste Management: $7,052,000
Solid Waste Management: $6,242,000
Other: $5,685,000
Other: $2,863,000
Miscellaneous Commercial Activities: $403,000
Miscellaneous Commercial Activities: $266,000
Sewerage: $63,000
Air Transportation: $8,000
Air Transportation: $8,000
- Construction - Police Protection: $42,000
- Current Operations - Police Protection: $24,372,000
Police Protection: $20,089,000
General - Other: $11,819,000
Correctional Institutions: $7,604,000
Central Staff Services: $6,041,000
Judicial and Legal Services: $5,921,000
Local Fire Protection: $5,809,000
General Public Buildings: $4,767,000
General Public Buildings: $4,152,000
Correctional Institutions: $3,959,000
Judicial and Legal Services: $3,938,000
Sewerage: $3,331,000
Regular Highways: $2,586,000
Financial Administration: $2,321,000
Regular Highways: $2,256,000
Financial Administration: $2,131,000
Central Staff Services: $1,488,000
Solid Waste Management: $1,159,000
General - Other: $935,000
Health - Other: $665,000
Air Transportation: $166,000
Parks and Recreation: $71,000
Air Transportation: $14,000
Health - Other: $11,000
- Federal Intergovernmental - Other: $177,000
Air Transportation: $166,000
Other: $26,000
- General - Interest on Debt: $4,786,000
- Long Term Debt - Outstanding Unspecified Public Purpose: $198,735,000
Beginning Outstanding - Unspecified Public Purpose: $170,833,000
Beginning Outstanding - Unspecified Public Purpose: $122,082,000
Outstanding Unspecified Public Purpose: $113,977,000
Beginning Outstanding - Public Debt for Private Purpose: $54,182,000
Outstanding Nonguaranteed - Industrial Revenue: $50,632,000
Beginning Outstanding - Public Debt for Private Purpose: $47,082,000
Outstanding Nonguaranteed - Industrial Revenue: $43,532,000
Issue, Unspecified Public Purpose: $41,913,000
Retired Unspecified Public Purpose: $14,011,000
Retired Unspecified Public Purpose: $8,105,000
Retired Nonguaranteed - Public Debt for Private Purpose: $3,550,000
Retired Nonguaranteed - Public Debt for Private Purpose: $3,550,000
- Miscellaneous - General Revenue - Other: $14,869,000
General Revenue - Other: $4,520,000
Interest Earnings: $2,336,000
Fines and Forfeits: $1,716,000
Fines and Forfeits: $1,349,000
Interest Earnings: $376,000
Sale of Property: $291,000
Rents: $68,000
Rents: $12,000
- Other Capital Outlay - Police Protection: $1,260,000
Financial Administration: $76,000
Police Protection: $65,000
Air Transportation: $32,000
Judicial and Legal Services: $13,000
Health - Other: $3,000
- Other Funds - Cash and Securities: $175,627,000
Cash and Securities: $103,616,000
- Revenue - Water Utilities: $32,117,000
Water Utilities: $5,230,000
- Sinking Funds - Cash and Securities: $53,790,000
Cash and Securities: $49,372,000
- State Intergovernmental - General Local Government Support: $5,490,000
General Local Government Support: $4,971,000
Other: $953,000
Other: $822,000
Sewerage: $457,000
Sewerage: $124,000
Public Welfare: $120,000
Public Welfare: $33,000
Health and Hospitals: $14,000
Health and Hospitals: $13,000
- Tax - Property: $49,884,000
Property: $37,043,000
General Sales and Gross Receipts: $17,055,000
Occupation and Business License - Other: $4,181,000
Occupation and Business License - Other: $2,299,000
Other: $1,211,000
Public Utility License: $807,000
Other License: $14,000
- Total Salaries and Wages: $48,518,000
: $39,964,000
- Water Utilities - Interest on Debt: $1,904,000
Supplemental Security Income (SSI) in 2006:
- Total number of recipients: 2,226
- Number of aged recipients: 207
- Number of blind and disabled recipients: 2,019
- Number of recipients under 18: 417
- Number of recipients between 18 and 64: 1,381
- Number of recipients older than 64: 428
- Number of recipients also receiving OASDI: 771
- Amount of payments (thousands of dollars): 936
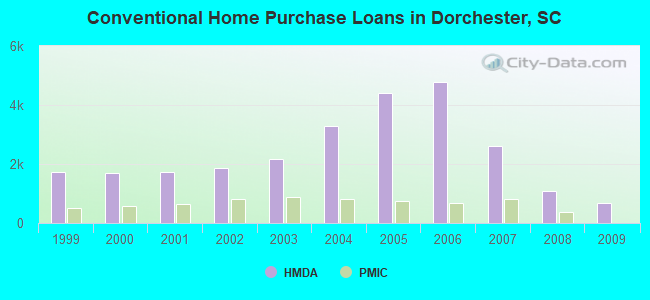
| Home Mortgage Disclosure Act Aggregated Statistics For Year 2009 (Based on 17 full tracts) | ||||||||||||||
| A) FHA, FSA/RHS & VA Home Purchase Loans | B) Conventional Home Purchase Loans | C) Refinancings | D) Home Improvement Loans | E) Loans on Dwellings For 5+ Families | F) Non-occupant Loans on < 5 Family Dwellings (A B C & D) | G) Loans On Manufactured Home Dwelling (A B C & D) | ||||||||
|---|---|---|---|---|---|---|---|---|---|---|---|---|---|---|
| Number | Average Value | Number | Average Value | Number | Average Value | Number | Average Value | Number | Average Value | Number | Average Value | Number | Average Value | |
| LOANS ORIGINATED | 1,404 | $171,360 | 672 | $155,192 | 2,977 | $172,536 | 165 | $53,800 | 4 | $4,962,250 | 265 | $124,736 | 144 | $55,903 |
| APPLICATIONS APPROVED, NOT ACCEPTED | 57 | $163,807 | 45 | $119,044 | 224 | $181,679 | 11 | $46,182 | 0 | $0 | 16 | $140,000 | 25 | $55,840 |
| APPLICATIONS DENIED | 269 | $167,472 | 161 | $111,665 | 1,316 | $175,721 | 86 | $51,895 | 0 | $0 | 86 | $112,430 | 111 | $67,964 |
| APPLICATIONS WITHDRAWN | 201 | $159,488 | 103 | $150,097 | 813 | $180,636 | 30 | $108,467 | 0 | $0 | 50 | $127,780 | 18 | $96,278 |
| FILES CLOSED FOR INCOMPLETENESS | 50 | $151,860 | 25 | $150,880 | 227 | $176,586 | 10 | $127,000 | 0 | $0 | 12 | $171,583 | 12 | $65,500 |
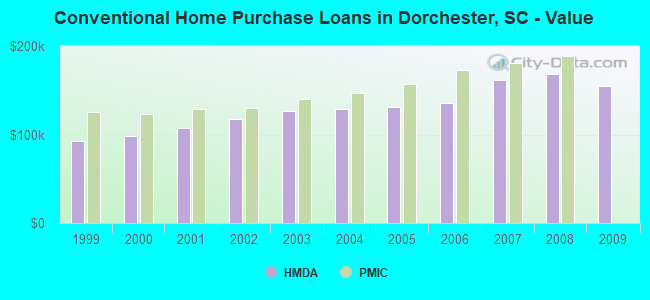
| Private Mortgage Insurance Companies Aggregated Statistics For Year 2008 (Based on 17 full tracts) | ||||||||
| A) Conventional Home Purchase Loans | B) Refinancings | C) Non-occupant Loans on < 5 Family Dwellings (A & B) | D) Loans On Manufactured Home Dwelling (A & B) | |||||
|---|---|---|---|---|---|---|---|---|
| Number | Average Value | Number | Average Value | Number | Average Value | Number | Average Value | |
| LOANS ORIGINATED | 373 | $188,936 | 186 | $194,194 | 53 | $158,113 | 3 | $129,333 |
| APPLICATIONS APPROVED, NOT ACCEPTED | 117 | $198,598 | 95 | $194,653 | 20 | $146,400 | 1 | $129,000 |
| APPLICATIONS DENIED | 24 | $184,708 | 16 | $188,125 | 13 | $176,538 | 1 | $86,000 |
| APPLICATIONS WITHDRAWN | 20 | $209,800 | 20 | $194,400 | 4 | $208,000 | 0 | $0 |
| FILES CLOSED FOR INCOMPLETENESS | 11 | $186,818 | 7 | $175,429 | 6 | $189,333 | 0 | $0 |
| Most common first names in Dorchester County, SC among deceased individuals | ||
| Name | Count | Lived (average) |
|---|---|---|
| John | 449 | 70.9 years |
| James | 411 | 70.9 years |
| William | 379 | 72.0 years |
| Mary | 365 | 78.6 years |
| Robert | 241 | 68.1 years |
| Charles | 193 | 69.0 years |
| George | 179 | 71.0 years |
| Joseph | 138 | 71.7 years |
| Thomas | 138 | 70.4 years |
| Willie | 136 | 69.2 years |
| Most common last names in Dorchester County, SC among deceased individuals | ||
| Last name | Count | Lived (average) |
|---|---|---|
| Smith | 253 | 74.0 years |
| Williams | 209 | 71.1 years |
| Brown | 182 | 71.6 years |
| Johnson | 153 | 70.5 years |
| Green | 103 | 71.1 years |
| Simmons | 102 | 72.8 years |
| Jones | 99 | 71.1 years |
| White | 81 | 72.8 years |
| Murray | 81 | 74.3 years |
| Knight | 80 | 75.0 years |
| Businesses in Dorchester County, SC | ||||
| Name | Count | Name | Count | |
|---|---|---|---|---|
| Ace Hardware | 2 | Hardee's | 1 | |
| CVS | 1 | KFC | 1 | |
| Chevrolet | 1 | Lane Furniture | 1 | |
| Comfort Inn | 1 | McDonald's | 1 | |
| Dairy Queen | 1 | Pizza Hut | 1 | |
| Domino's Pizza | 1 | Quality | 1 | |
| Dunkin Donuts | 1 | Subway | 1 | |
| Econo Lodge | 1 | Super 8 | 1 | |
| FedEx | 2 | True Value | 1 | |
| Ford | 1 | UPS | 1 | |
| H&R Block | 1 | Waffle House | 1 | |
Dorchester County on our top lists:
- #42 on the list of "Top 101 counties with the largest decrease in the number of deaths per 1000 residents 2000-2006 to 2007-2013 (pop. 50,000+)"
- #44 on the list of "Top 101 counties with the highest percentage of residents relocating from other counties between 2010 and 2011 (pop. 50,000+)"
- #46 on the list of "Top 101 counties with the smallest number of people without health insurance coverage in 2000 (pop. 50,000+)"
- #66 on the list of "Top 101 counties with the highest percentage of residents relocating to other counties in 2011 (pop. 50,000+)"
- #85 on the list of "Top 101 counties with the largest number of people moving in compared to moving out (pop. 50,000+)"
- #91 on the list of "Top 101 counties with the highest percentage of residents relocating from foreign countries between 2010 and 2011 (pop. 50,000+)"
- #96 on the list of "Top 101 counties with the highest percentage of residents relocating from other counties between 2010 and 2011"
- #98 on the list of "Top 101 counties with the highest percentage of residents relocating to foreign countries in 2011 (pop. 50,000+)"