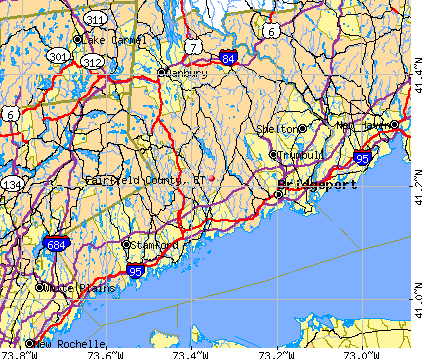
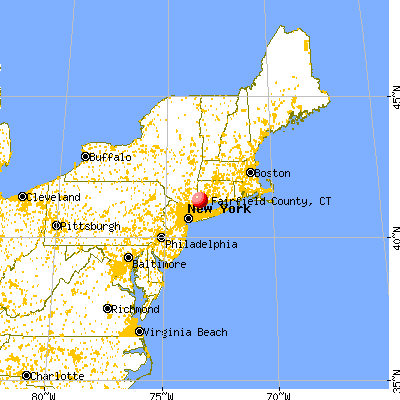
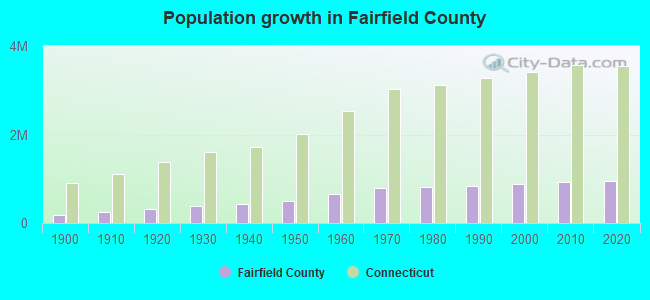
Fairfield County, Connecticut (CT)
County owner-occupied free and clear houses and condos in 2010: 58,472
County owner-occupied houses and condos in 2000: 224,509
Renter-occupied apartments: 105,378 (it was 99,723 in 2000)
| % of renters here: | 31% |
| State: | 33% |
Land area: 626 sq. mi.
Water area: 211.2 sq. mi.
Population density: 1526 people per square mile (very high).
Industries providing employment: Educational, health and social services (22.8%), Professional, scientific, management, administrative, and waste management services (16.2%), Finance, insurance, real estate, and rental and leasing (12.1%), Retail trade (10.2%).
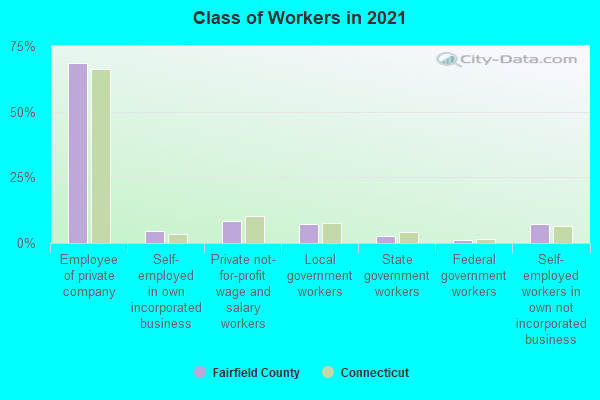
Type of workers:
- Private wage or salary: 82%
- Government: 10%
- Self-employed, not incorporated: 8%
- Unpaid family work: 0%
- OSM Map
- General Map
- Google Map
- MSN Map

- 564,34058.8%White Non-Hispanic Alone
- 202,16721.1%Hispanic or Latino
- 100,83810.5%Black Non-Hispanic Alone
- 52,6905.5%Asian alone
- 29,7153.1%Two or more races
- 8,4830.9%Some other race alone
- 7250.08%American Indian and Alaska Native alone
- 3390.04%Native Hawaiian and Other
Pacific Islander alone

| Median resident age: | 40.6 years |
| Connecticut median age: | 40.9 years |
| Males: 467,088 | |
| Females: 487,999 |

| Fairfield County: | 2.0 people |
| Connecticut: | 3 people |
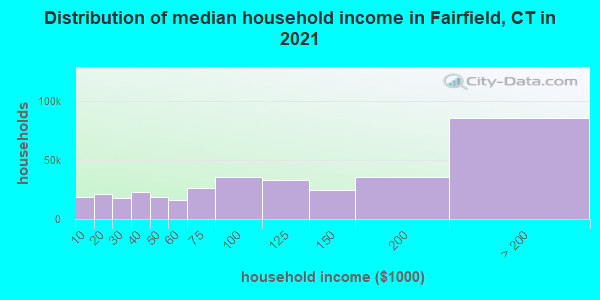
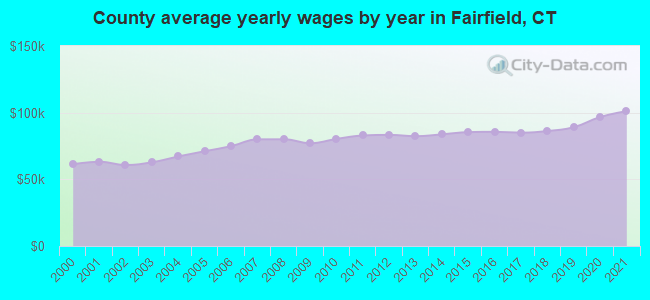
Estimated median household income in 2022: $110,190 ($65,249 in 1999)
| This county: | $110,190 |
| Connecticut: | $88,429 |
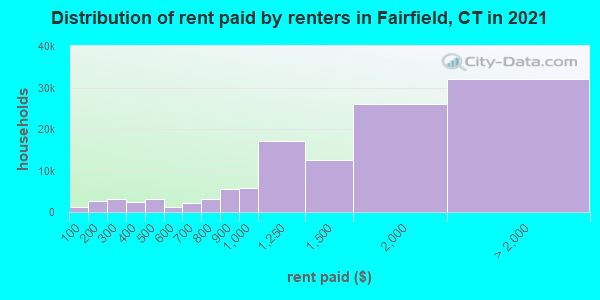
Median contract rent in 2022 for apartments: $1,500 (lower quartile is $1,033, upper quartile is $2,174)
| This county: | $1500 |
| State: | $1158 |
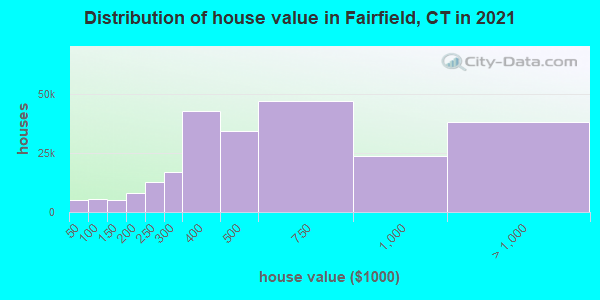
Estimated median house or condo value in 2022: $573,118 (it was $265,100 in 2000)
| Fairfield: | $573,118 |
| Connecticut: | $347,200 |
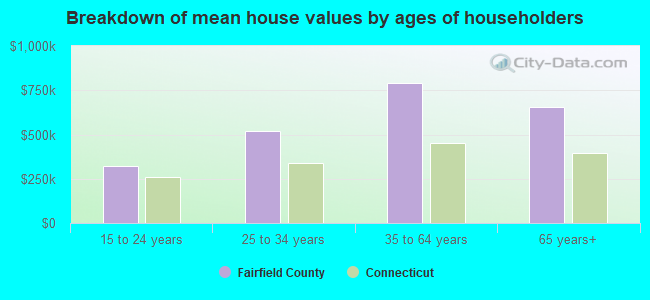
Mean price in 2022:
Median monthly housing costs for homes and condos with a mortgage: $3,090Detached houses: $872,764
Here: $872,764 State: $503,946 Townhouses or other attached units: $449,164
Here: $449,164 State: $304,959 In 2-unit structures: $329,188
Here: $329,188 State: $304,133 In 3-to-4-unit structures: $346,815
Here: $346,815 State: $272,970 In 5-or-more-unit structures: $346,835
Here: $346,835 State: $249,308 Mobile homes: $65,227
Here: $65,227 State: $151,361
Median monthly housing costs for units without a mortgage: $1,301
Institutionalized population: 9,152
Health of residents in Fairfield County based on CDC Behavioral Risk Factor Surveillance System Survey Questionnaires from 2003 to 2012:
General health status score of residents in this county from 1 (poor) to 5 (excellent) is 3.7. This is significantly better than average.77.8% of residents exercised in the past month. This is about average.
45.7% of residents smoked 100+ cigarettes in their lives. This is about average.
83.2% of adult residents drank alcohol in the past 30 days. This is more than average.
79.7% of residents visited a dentist within the past year. This is more than average.
Average weight of males is 190 pounds. This is about average.
Average weight of females is 155 pounds. This is less than average.
14.2% of residents keep firearms around their homes. This is less than average.
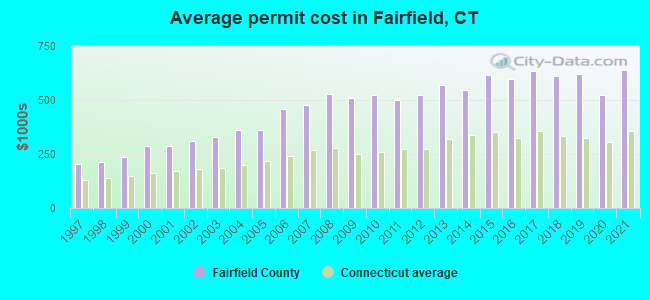
Single-family new house construction building permits:
- 2022: 603 buildings, average cost: $758,800
- 2021: 714 buildings, average cost: $638,700
- 2020: 638 buildings, average cost: $520,800
- 2019: 635 buildings, average cost: $619,500
- 2018: 753 buildings, average cost: $612,100
- 2017: 765 buildings, average cost: $633,700
- 2016: 712 buildings, average cost: $598,900
- 2015: 800 buildings, average cost: $614,900
- 2014: 987 buildings, average cost: $545,100
- 2013: 870 buildings, average cost: $570,000
- 2012: 634 buildings, average cost: $522,600
- 2011: 583 buildings, average cost: $497,600
- 2010: 546 buildings, average cost: $522,000
- 2009: 476 buildings, average cost: $510,300
- 2008: 713 buildings, average cost: $529,200
- 2007: 1438 buildings, average cost: $477,200
- 2006: 1480 buildings, average cost: $459,000
- 2005: 2054 buildings, average cost: $360,000
- 2004: 1840 buildings, average cost: $361,800
- 2003: 1550 buildings, average cost: $330,500
- 2002: 1598 buildings, average cost: $308,800
- 2001: 1521 buildings, average cost: $286,800
- 2000: 1602 buildings, average cost: $289,300
- 1999: 1758 buildings, average cost: $236,900
- 1998: 1897 buildings, average cost: $212,500
- 1997: 1661 buildings, average cost: $202,000

Median real estate property taxes paid for housing units with mortgages in 2022: $8,671 (1.7%)
Median real estate property taxes paid for housing units with no mortgage in 2022: $8,152 (1.7%)
| Fairfield County: | 9.3% |
| Connecticut: | 9.8% |
Median age of residents in 2022: 40.6 years old
(Males: 39.4 years old, Females: 41.6 years old)
(Median age for: White residents: 47.1 years old, Black residents: 36.2 years old, American Indian residents: 42.1 years old, Asian residents: 37.4 years old, Hispanic or Latino residents: 32.4 years old, Other race residents: 32.4 years old)
Area name: Danbury, CT HUD Metro FMR Area
Fair market rent in 2006 for a 1-bedroom apartment in Fairfield County is $992 a month.
Fair market rent for a 2-bedroom apartment is $1148 a month.
Fair market rent for a 3-bedroom apartment is $1374 a month.
Cities in this county include: Bridgeport, Stamford, Norwalk, Danbury, Greenwich, Fairfield, Stratford, Shelton, Trumbull, Westport.
2023 air pollution in Fairfield County:
Nitrogen Dioxide: 0.01 ppm (standard limit: 0.053 ppm). Above U.S. average.
Ozone (1-hour): 0.037 ppm (standard limit: 0.12 ppm). Near U.S. average.
Particulate Matter (PM10) Annual: 19.2 µg/m3. Near U.S. average.
Particulate Matter (PM2.5) Annual: 10.6 µg/m3(standard limit: 15.0 µg/m3). Near U.S. average.
Sulfur Oxides Annual: 0.000 ppm (standard limit: 0.03 ppm). Near U.S. average.
| Here: | 4.0% |
| Connecticut: | 3.9% |
Current college students: 44,981
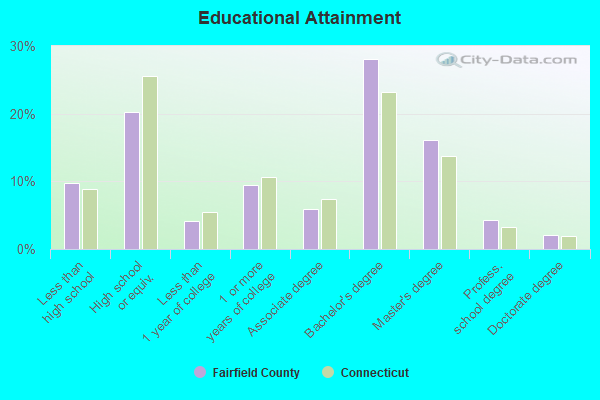
People 25 years of age or older with a high school degree or higher: 91.0%
People 25 years of age or older with a bachelor's degree or higher: 50.6%
Number of foreign born residents: 215,455 (50.9% naturalized citizens)
| Fairfield County: | 22.6% |
| Whole state: | 15.7% |
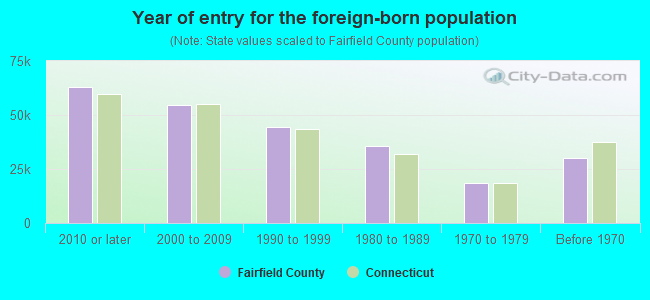
- Year of entry for the foreign-born population
- 57,7292010 or later
- 60,8562000 to 2009
- 44,4921990 to 1999
- 35,8671980 to 1989
- 18,6581970 to 1979
- 30,260Before 1970
Mean travel time to work (commute): minutes
Percentage of county residents living and working in this county: 84.8%
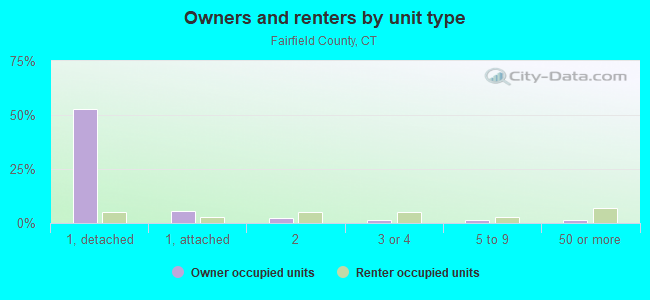
Housing units in structures:
- One, detached: 214,935
- One, attached: 27,747
- Two: 30,491
- 3 or 4: 28,082
- 5 to 9: 15,855
- 10 to 19: 13,252
- 20 to 49: 14,234
- 50 or more: 32,006
- Mobile homes: 1,213
- Boats, RVs, vans, etc.: 135
Housing units in Fairfield County with a mortgage: 159,111 (25,268 second mortgage, 808 home equity loan, 20,879 both second mortgage and home equity loan)
Houses without a mortgage: 3,083
| Here: | 98.1% with mortgage |
| State: | 95.9% with mortgage |
Religion statistics for Fairfield County
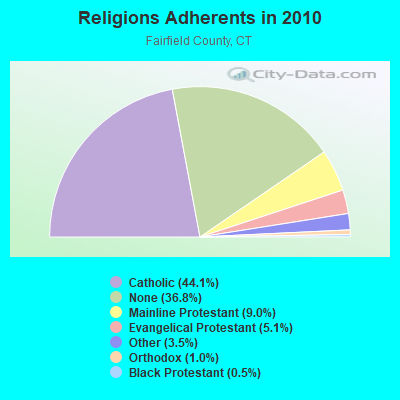
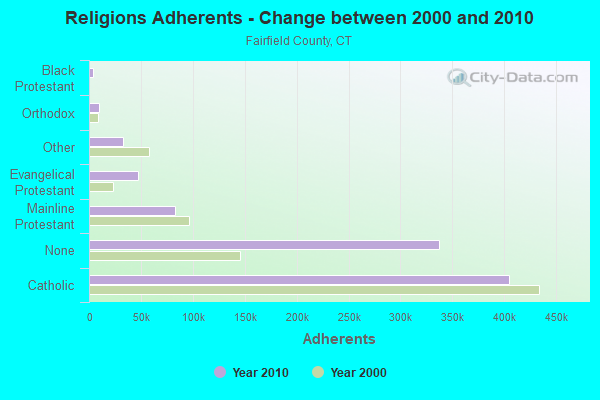
| Religion | Adherents | Congregations |
|---|---|---|
| Catholic | 404,341 | 94 |
| Mainline Protestant | 82,604 | 175 |
| Evangelical Protestant | 46,888 | 242 |
| Other | 32,501 | 95 |
| Orthodox | 9,215 | 21 |
| Black Protestant | 4,144 | 27 |
| None | 337,136 | - |
Source: Clifford Grammich, Kirk Hadaway, Richard Houseal, Dale E.Jones, Alexei Krindatch, Richie Stanley and Richard H.Taylor. 2012. 2010 U.S.Religion Census: Religious Congregations & Membership Study. Association of Statisticians of American Religious Bodies. Jones, Dale E., et al. 2002. Congregations and Membership in the United States 2000. Nashville, TN: Glenmary Research Center.
Food Environment Statistics:
| Fairfield County: | 2.50 / 10,000 pop. |
| State: | 2.21 / 10,000 pop. |
| Here: | 0.06 / 10,000 pop. |
| Connecticut: | 0.07 / 10,000 pop. |
| This county: | 0.85 / 10,000 pop. |
| Connecticut: | 1.02 / 10,000 pop. |
| Fairfield County: | 1.70 / 10,000 pop. |
| Connecticut: | 2.27 / 10,000 pop. |
| This county: | 9.67 / 10,000 pop. |
| State: | 9.19 / 10,000 pop. |
| Fairfield County: | 6.5% |
| Connecticut: | 7.3% |
| Fairfield County: | 17.9% |
| State: | 21.5% |
| Here: | 17.2% |
| State: | 15.8% |
Agriculture in Fairfield County:
Average size of farms: 45 acresAverage value of agricultural products sold per farm: $105,478
Average value of crops sold per acre for harvested cropland: $5750.56
The value of nursery, greenhouse, floriculture, and sod as a percentage of the total market value of agricultural products sold: 64.26%
The value of livestock, poultry, and their products as a percentage of the total market value of agricultural products sold: 27.91%
Average total farm production expenses per farm: $77,522
Harvested cropland as a percentage of land in farms: 29.58%
Irrigated harvested cropland as a percentage of land in farms: 10.09%
Average market value of all machinery and equipment per farm: $36,613
The percentage of farms operated by a family or individual: 69.34%
Average age of principal farm operators: 57 years
Average number of cattle and calves per 100 acres of all land in farms: 5.13
Milk cows as a percentage of all cattle and calves: 20.21%
Vegetables: 373 harvested acres
Land in orchards: 310 acres
Earthquake activity:
Fairfield County-area historical earthquake activity is significantly above Connecticut state average. It is 70% smaller than the overall U.S. average.On 10/7/1983 at 10:18:46, a magnitude 5.3 (5.1 MB, 5.3 LG, 5.1 ML, Class: Moderate, Intensity: VI - VII) earthquake occurred 196.1 miles away from Fairfield County center
On 4/20/2002 at 10:50:47, a magnitude 5.3 (5.3 ML, Depth: 3.0 mi) earthquake occurred 228.9 miles away from the county center
On 8/23/2011 at 17:51:04, a magnitude 5.8 (5.8 MW, Depth: 3.7 mi) earthquake occurred 334.4 miles away from the county center
On 4/20/2002 at 10:50:47, a magnitude 5.2 (5.2 MB, 4.2 MS, 5.2 MW, 5.0 MW) earthquake occurred 227.2 miles away from the county center
On 1/16/1994 at 01:49:16, a magnitude 4.6 (4.6 MB, 4.6 LG, Depth: 3.1 mi, Class: Light, Intensity: IV - V) earthquake occurred 153.2 miles away from Fairfield County center
On 1/19/1982 at 00:14:42, a magnitude 4.7 (4.5 MB, 4.7 MD, 4.5 LG) earthquake occurred 181.8 miles away from the county center
Magnitude types: regional Lg-wave magnitude (LG), body-wave magnitude (MB), duration magnitude (MD), local magnitude (ML), surface-wave magnitude (MS), moment magnitude (MW)
Most recent natural disasters:
- Connecticut Severe Winter Storm, Incident Period: February 08, 2013 to February 12, 2013, Emergency Declared EM-3361: February 10, 2013, FEMA Id: 3361, Natural disaster type: Winter Storm
- Connecticut Severe Winter Storm and Snowstorm, Incident Period: February 08, 2013 to February 12, 2013, Major Disaster (Presidential) Declared DR-4106: March 21, 2013, FEMA Id: 4106, Natural disaster type: Snowstorm, Winter Storm
- Connecticut Hurricane Sandy, Incident Period: October 27, 2012 to November 08, 2012, Emergency Declared EM-3353: October 28, 2012, FEMA Id: 3353, Natural disaster type: Hurricane
- Connecticut Hurricane Sandy, Incident Period: October 27, 2012 to November 08, 2012, Major Disaster (Presidential) Declared DR-4087: October 30, 2012, FEMA Id: 4087, Natural disaster type: Hurricane
- Connecticut Severe Storm, Incident Period: October 29, 2011 to October 30, 2011, Emergency Declared EM-3342: October 31, 2011, FEMA Id: 3342, Natural disaster type: Storm
- Connecticut Severe Storm, Incident Period: October 29, 2011 to October 30, 2011, Major Disaster (Presidential) Declared DR-4046: November 17, 2011, FEMA Id: 4046, Natural disaster type: Storm
- Connecticut Tropical Storm Irene, Incident Period: August 27, 2011 to September 01, 2011, Major Disaster (Presidential) Declared DR-4023: September 02, 2011, FEMA Id: 4023, Natural disaster type: Tropical Storm
- Connecticut Hurricane Irene, Incident Period: August 26, 2011 to September 01, 2011, Emergency Declared EM-3331: August 27, 2011, FEMA Id: 3331, Natural disaster type: Hurricane
- Connecticut Snowstorm, Incident Period: January 11, 2011 to January 12, 2011, Major Disaster (Presidential) Declared DR-1958: March 03, 2011, FEMA Id: 1958, Natural disaster type: Snowstorm
- Connecticut Severe Storms and Flooding, Incident Period: March 12, 2010 to May 17, 2010, Major Disaster (Presidential) Declared DR-1904: April 23, 2010, FEMA Id: 1904, Natural disaster type: Storm, Flood
- 14 other natural disasters have been reported since 1953.
The number of natural disasters in Fairfield County (24) is greater than the US average (15).
Major Disasters (Presidential) Declared: 13
Emergencies Declared: 11
Causes of natural disasters: Storms: 6, Floods: 5, Hurricanes: 5, Snowstorms: 4, Blizzards: 3, Snows: 3, Winter Storms: 3, Tropical Storms: 2, Snowfall: 1, Wind: 1 (Note: some incidents may be assigned to more than one category).
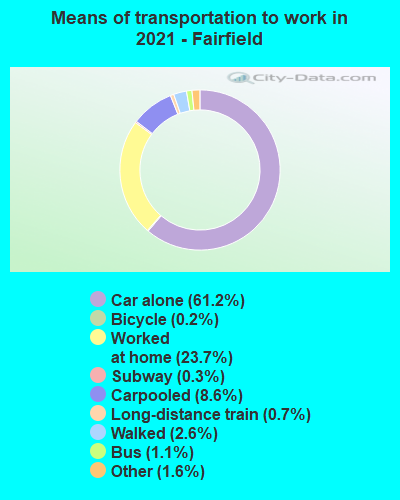
Means of transportation to work:
- Drove a car alone: 328,166 (70.1%)
- Carpooled: 37,781 (8.1%)
- Bus: 7,346 (1.6%)
- Subway or elevated rail: 1,397 (0.3%)
- Long-distance train or commuter rail: 6,484 (1.4%)
- Light rail, streetcar or trolley: 364 (0.1%)
- Ferryboat: 41 (0.0%)
- Taxicab, motorcycle, or other means: 6,360 (1.4%)
- Bicycle: 539 (0.1%)
- Walked: 11,739 (2.5%)
- Worked at home: 71,921 (15.4%)

- Health care and social assistance (20%)
- Educational services (12%)
- Retail trade (9%)
- Professional, scientific, and technical services (8%)
- Finance and insurance (7%)
- Other services, except public administration (6%)
- Manufacturing (6%)
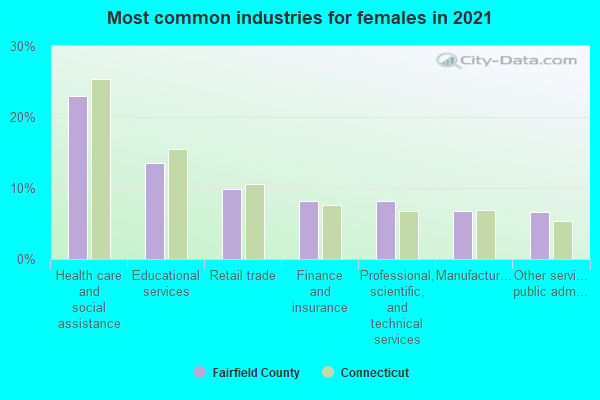
- Health care and social assistance (23%)
- Educational services (14%)
- Retail trade (10%)
- Professional, scientific, and technical services (9%)
- Finance and insurance (7%)
- Other services, except public administration (6%)
- Manufacturing (6%)
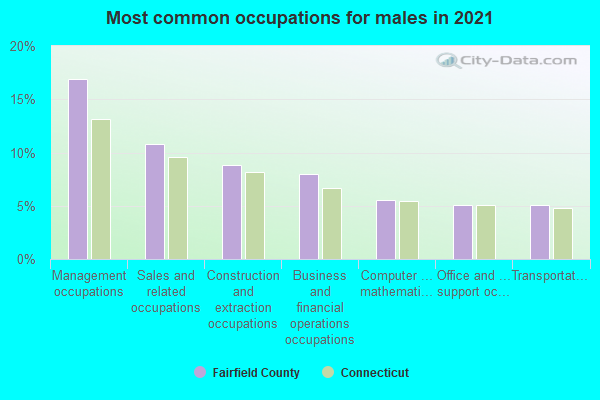
- Management occupations (17%)
- Sales and related occupations (11%)
- Construction and extraction occupations (9%)
- Business and financial operations occupations (9%)
- Computer and mathematical occupations (6%)
- Building and grounds cleaning and maintenance occupations (5%)
- Office and administrative support occupations (5%)
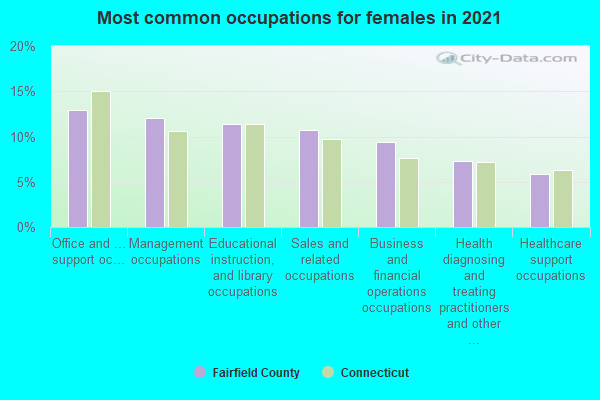
- Office and administrative support occupations (14%)
- Management occupations (12%)
- Educational instruction, and library occupations (11%)
- Sales and related occupations (11%)
- Business and financial operations occupations (9%)
- Health diagnosing and treating practitioners and other technical occupations (6%)
- Healthcare support occupations (5%)
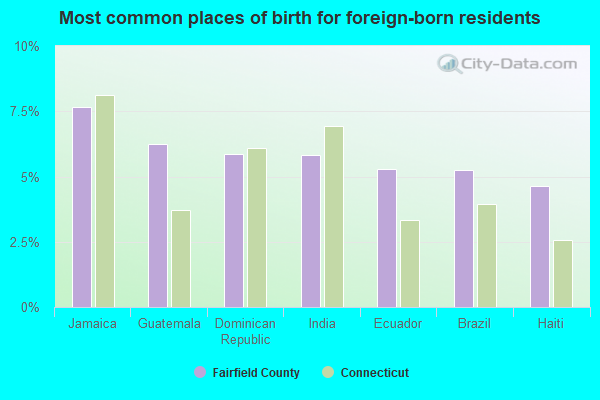
- India (7%)
- Mexico (6%)
- Jamaica (6%)
- Ecuador (6%)
- Brazil (6%)
- Guatemala (5%)
- Dominican Republic (4%)
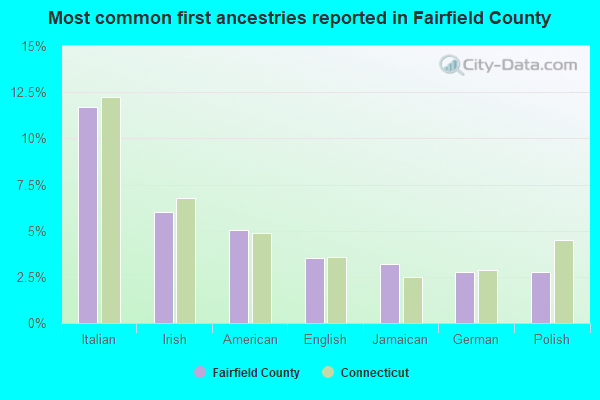
- Italian (12%)
- Irish (6%)
- American (5%)
- English (3%)
- Jamaican (3%)
- Polish (3%)
- Brazilian (3%)
People in group quarters in Fairfield County, Connecticut in 2010:
- 6,810 people in college/university student housing
- 5,839 people in nursing facilities/skilled-nursing facilities
- 1,518 people in state prisons
- 1,339 people in federal prisons
- 1,147 people in other noninstitutional facilities
- 833 people in group homes intended for adults
- 648 people in emergency and transitional shelters (with sleeping facilities) for people experiencing homelessness
- 308 people in workers' group living quarters and job corps centers
- 270 people in residential treatment centers for adults
- 251 people in correctional residential facilities
- 90 people in group homes for juveniles (non-correctional)
- 48 people in mental (psychiatric) hospitals and psychiatric units in other hospitals
- 26 people in residential schools for people with disabilities
- 25 people in residential treatment centers for juveniles (non-correctional)
- 11 people in correctional facilities intended for juveniles
- 3 people in hospitals with patients who have no usual home elsewhere
- 2 people in in-patient hospice facilities
People in group quarters in Fairfield County, Connecticut in 2000:
- 6,503 people in nursing homes
- 5,457 people in college dormitories (includes college quarters off campus)
- 1,326 people in federal prisons and detention centers
- 1,079 people in other noninstitutional group quarters
- 796 people in local jails and other confinement facilities (including police lockups)
- 694 people in state prisons
- 421 people in religious group quarters
- 264 people in other group homes
- 233 people in homes for the mentally retarded
- 219 people in other nonhousehold living situations
- 214 people in homes or halfway houses for drug/alcohol abuse
- 190 people in orthopedic wards and institutions for the physically handicapped
- 123 people in mental (psychiatric) hospitals or wards
- 102 people in homes for the mentally ill
- 93 people in other workers' dormitories
- 84 people in halfway houses
- 71 people in schools, hospitals, or wards for the intellectually disabled
- 47 people in job corps and vocational training facilities
- 42 people in wards in general hospitals for patients who have no usual home elsewhere
- 6 people in hospitals/wards and hospices for chronically ill
- 6 people in hospices or homes for chronically ill
- 6 people in institutions for the blind
- 6 people in unknown juvenile institutions
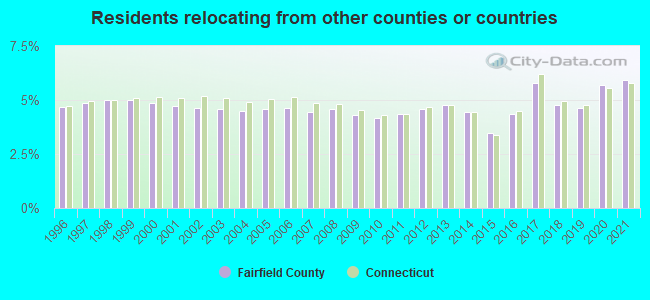
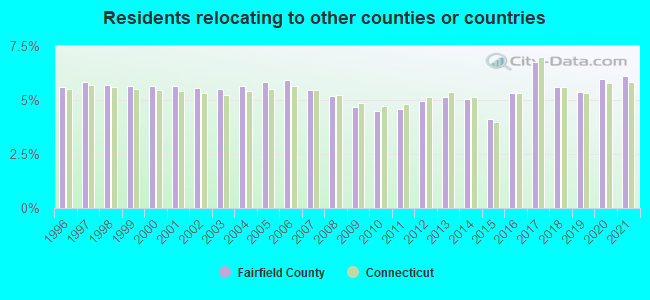
5.92% of this county's 2021 resident taxpayers lived in other counties in 2020 ($194,373 average adjusted gross income)
| Here: | 5.92% |
| Connecticut average: | 5.79% |
0.01% of residents moved from foreign countries ($50 average AGI)
Fairfield County: 0.01% Connecticut average: 0.02%
1.02% relocated from other counties in Connecticut ($14,021 average AGI)
4.90% relocated from other states ($180,302 average AGI)
Fairfield County: 4.90% Connecticut average: 3.44%
Top counties from which taxpayers relocated into this county between 2020 and 2021:
| from Westchester County, NY | |
| from New York County, NY | |
| from New Haven County, CT | |
| from Bronx County, NY | |
| from Kings County, NY | |
| from Queens County, NY | |
| from Litchfield County, CT |
6.13% of this county's 2020 resident taxpayers moved to other counties in 2021 ($174,109 average adjusted gross income)
| Here: | 6.13% |
| Connecticut average: | 5.82% |
0.01% of residents moved to foreign countries ($428 average AGI)
Fairfield County: 0.01% Connecticut average: 0.02%
1.83% relocated to other counties in Connecticut ($21,825 average AGI)
4.28% relocated to other states ($151,856 average AGI)
Fairfield County: 4.28% Connecticut average: 3.47%
Top counties to which taxpayers relocated from this county between 2020 and 2021:
| to New Haven County, CT | |
| to New York County, NY | |
| to Westchester County, NY | |
| to Litchfield County, CT | |
| to Hartford County, CT | |
| to Palm Beach County, FL | |
| to Kings County, NY |
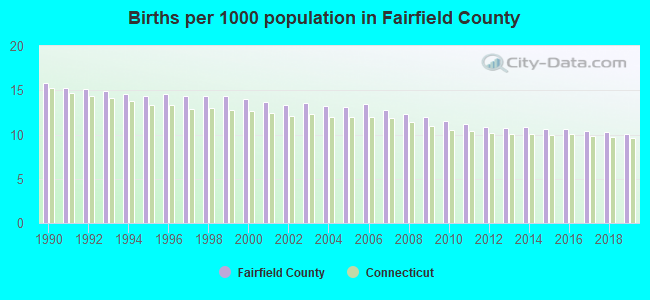
Births per 1000 population from 1990 to 1999: 14.8
Births per 1000 population from 2000 to 2009: 13.1
Births per 1000 population from 2010 to 2022: 9.0
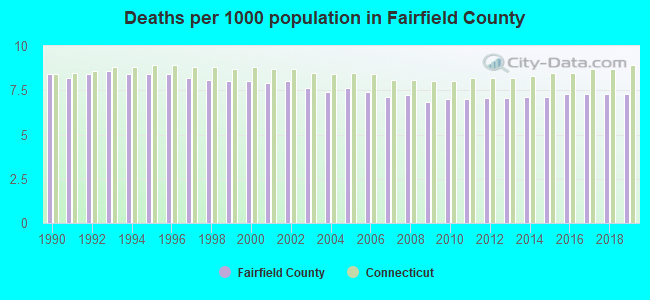
Deaths per 1000 population from 1990 to 1999: 8.3
Deaths per 1000 population from 2000 to 2009: 7.5
Deaths per 1000 population from 2010 to 2020: 7.4
Infant deaths per 1000 live births from 1990 to 1999: 6.4
Infant deaths per 1000 live births from 2000 to 2009: 4.9
Infant deaths per 1000 live births from 2010 to 2021: 4.0

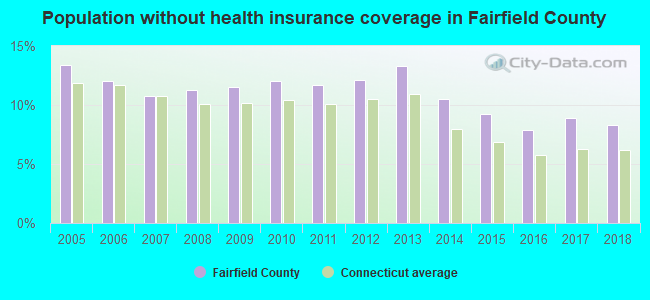
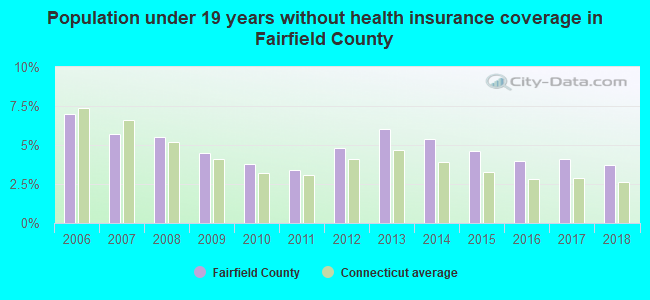
Persons under 19 years old without health insurance coverage in 2018: 3.7%
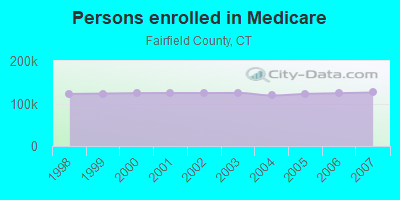
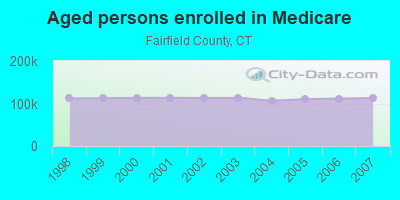
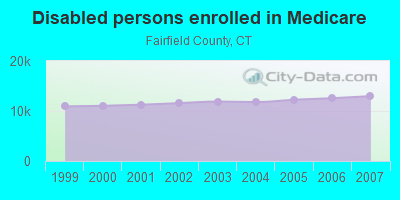
Persons enrolled in hospital insurance and/or supplemental medical insurance (Medicare) in July 1, 2007: 125,915 (112,941 aged, 12,974 disabled)
Children under 18 without health insurance coverage in 2007: 12,370 (5%)
Most common underlying causes of death in Fairfield County, Connecticut in 1999 - 2019:
- Atherosclerotic heart disease (13,025)
- Bronchus or lung, unspecified - Malignant neoplasms (7,769)
- Unspecified dementia (5,654)
- Acute myocardial infarction, unspecified (5,646)
- Chronic obstructive pulmonary disease, unspecified (4,159)
- Atherosclerotic cardiovascular disease, so described (4,025)
- Stroke, not specified as haemorrhage or infarction (3,841)
- Alzheimer disease, unspecified (3,768)
- Congestive heart failure (3,511)
- Pneumonia, unspecified (3,155)
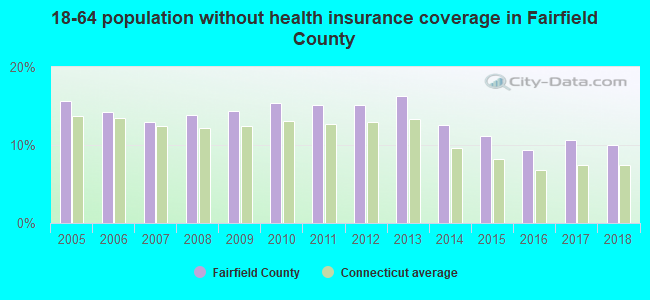
Population without health insurance coverage in 2000: 10%
Children under 18 without health insurance coverage in 2000: 6%
Suicides per 1,000,000 population from 2000 to 2006: 67.5. This is less than state average.
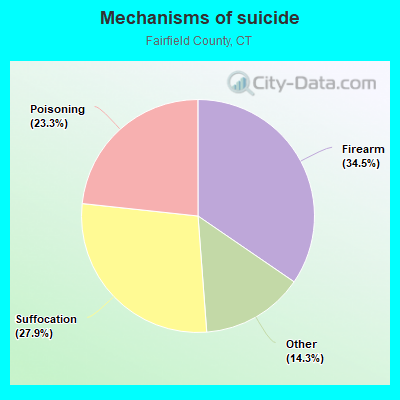
- Firearm - 23.3
- Suffocation - 18.8
- Poisoning - 15.7
- Other - 9.6
Household type by relationship:
Households: 955,087- Male householders: 172,836 (36,318 living alone), Female householders: 178,307 (52,454 living alone)
183,370 spouses (181,198 opposite-sex spouses), 19,865 unmarried partners, (18,456 opposite-sex unmarried partners), 298,041 children (285,181 natural, 5,408 adopted, 7,460 stepchildren), 12,539 grandchildren, 10,464 brothers or sisters, 15,711 parents, 378 foster children, 16,291 other relatives, 28,627 non-relatives
- In group quarters: 17,940
Size of family households: 94,100 2-persons, 58,695 3-persons, 53,455 4-persons, 24,745 5-persons, 6,753 6-persons, 4,110 7-or-more-persons.
Size of nonfamily households: 88,846 1-person, 16,370 2-persons, 2,174 3-persons, 1,102 4-persons, 306 5-persons, 69 6-persons, 28 7-or-more-persons.
150,782 married couples with children.
46,355 single-parent households (12,017 men, 34,338 women).
70.0% of residents of Fairfield speak English at home.
16.4% of residents speak Spanish at home (54% speak English very well, 20% speak English well, 18% speak English not well, 7% don't speak English at all).
10.0% of residents speak other Indo-European language at home (66% speak English very well, 21% speak English well, 10% speak English not well, 3% don't speak English at all).
2.7% of residents speak Asian or Pacific Island language at home (62% speak English very well, 23% speak English well, 13% speak English not well, 3% don't speak English at all).
1.1% of residents speak other language at home (76% speak English very well, 15% speak English well, 8% speak English not well, 1% don't speak English at all).
In fiscal year 2004:
Federal Government expenditure: $6,729,172,000 ($7,450 per capita)
Department of Defense expenditure: $2,449,436,000
Federal direct payments to individuals for retirement and disability: $1,809,722,000
Federal other direct payments to individuals: $1,145,064,000
Federal direct payments not to individuals: $22,877,000
Federal grants: $969,715,000
Federal procurement contracts: $2,523,731,000 ($2,378,549,000 Department of Defense)
Federal salaries and wages: $258,064,000 ($35,299,000 Department of Defense)
Federal Government direct loans: $14,802,000
Federal guaranteed/insured loans: $480,702,000
Federal Government insurance: $2,337,203,000
Population change from April 1, 2000 to July 1, 2005:
Births: 63,450| Here: | 70 per 1000 residents |
| State: | 63 per 1000 residents |
Deaths: 35,981
| Here: | 40 per 1000 residents |
| State: | 44 per 1000 residents |
Net international migration: +35,546
| Here: | +39 per 1000 residents |
| State: | +22 per 1000 residents |
Net internal migration: -41,408
| Here: | |
| State: |
Total withdrawal of fresh water for public supply: 158.19 millions of gallons per day (7% from ground, 93% from surface)
| Here: | 7.0 |
| State: | 6.5 |
| Here: | 4.1 |
| State: | 4.0 |
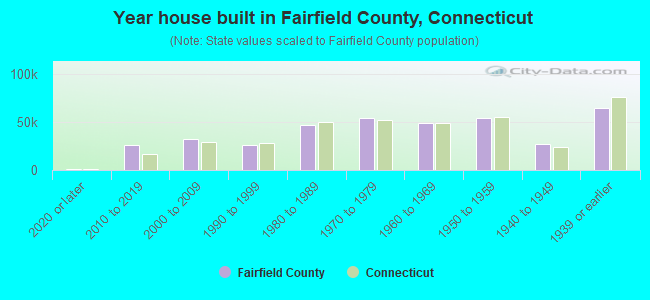
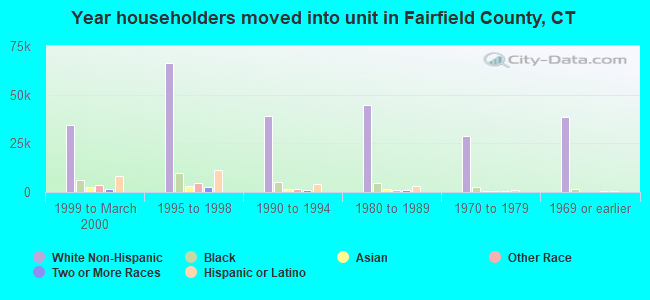
- Year house built in Fairfield County, Connecticut
- 9,4262014 or later
- 23,1472010 to 2013
- 24,3232000 to 2009
- 26,5651990 to 1999
- 42,8261980 to 1989
- 49,2221970 to 1979
- 53,8931960 to 1969
- 57,6051950 to 1959
- 26,9701940 to 1949
- 72,9271939 or earlier
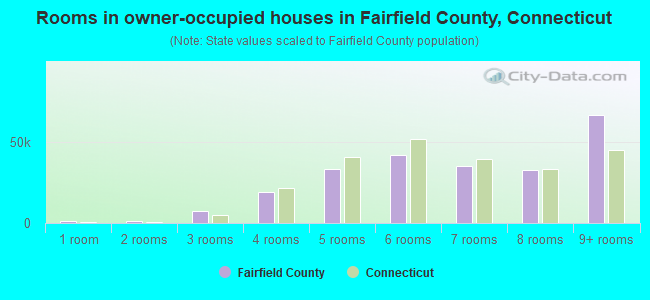
- Rooms in owner-occupied houses in Fairfield County, Connecticut
- 6561 room
- 1,4012 rooms
- 5,8443 rooms
- 18,6464 rooms
- 31,0655 rooms
- 40,2796 rooms
- 36,6237 rooms
- 34,5808 rooms
- 66,1849+ rooms
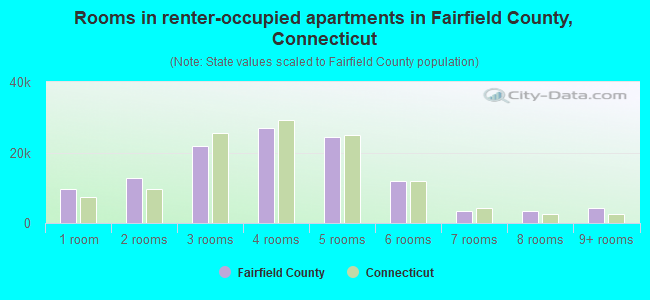
- Rooms in renter-occupied apartments in Fairfield County, Connecticut
- 7,9961 room
- 11,0042 rooms
- 23,6863 rooms
- 28,5094 rooms
- 21,8955 rooms
- 12,2576 rooms
- 5,4867 rooms
- 2,7598 rooms
- 3,5529+ rooms
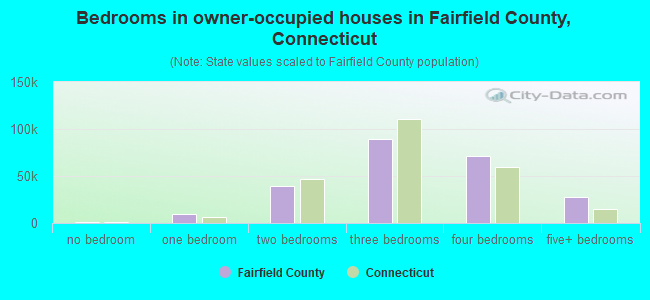
- Bedrooms in owner-occupied houses in Fairfield County, Connecticut
- 858no bedroom
- 7,8291 bedroom
- 40,9342 bedrooms
- 87,7643 bedrooms
- 69,8914 bedrooms
- 27,5435+ bedrooms
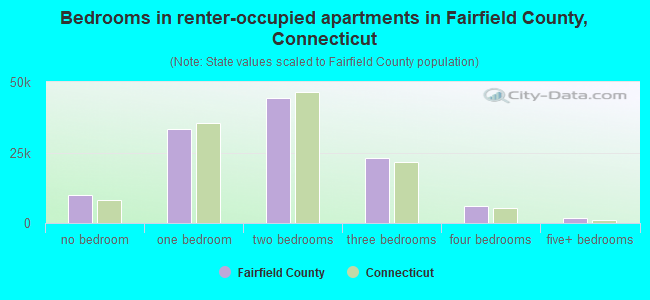
- Bedrooms in renter-occupied apartments in Fairfield County, Connecticut
- 8,565no bedroom
- 33,7401 bedroom
- 43,1742 bedrooms
- 22,8413 bedrooms
- 6,5914 bedrooms
- 1,9215+ bedrooms
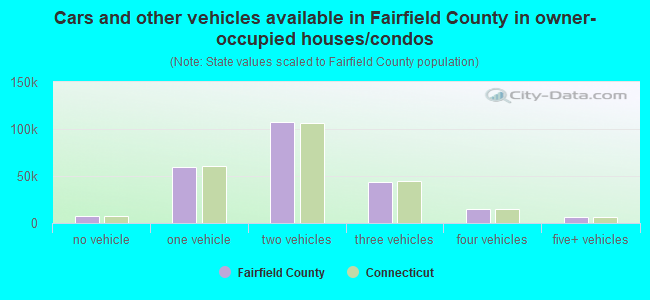
- Cars and other vehicles available in Fairfield County in owner-occupied houses/condos
- 6,045no vehicle
- 55,0421 vehicle
- 106,1592 vehicles
- 47,2313 vehicles
- 14,3424 vehicles
- 5,5195+ vehicles
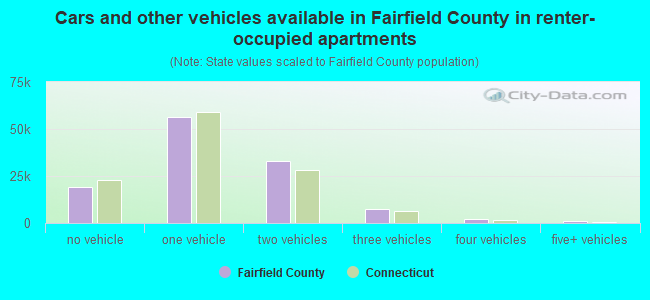
- Cars and other vehicles available in Fairfield County in renter-occupied apartments
- 19,973no vehicle
- 54,9671 vehicle
- 31,8612 vehicles
- 7,2283 vehicles
- 2,0284 vehicles
- 7105+ vehicles
88.5% of Fairfield County residents lived in the same house 1 years ago.
Out of people who lived in different houses, 37% lived in this county.
Out of people who lived in different counties, 19% lived in Connecticut.
| Fairfield County: | 88.5% |
| State average: | 88.4% |
Place of birth for U.S.-born residents:
- This state: 401,970
- Other state: 311,034
- Northeast: 224,938
- Midwest: 30,083
- South: 37,754
- West: 18,470
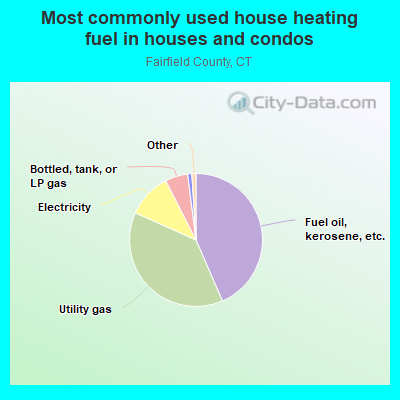
- 45.8%Fuel oil, kerosene, etc.
- 37.8%Utility gas
- 9.8%Electricity
- 5.3%Bottled, tank, or LP gas
- 0.8%Wood
- 0.5%Other fuel
- 0.3%No fuel used
- 0.1%Solar energy
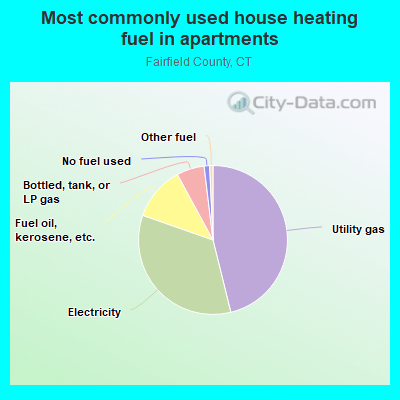
- 49.0%Utility gas
- 32.3%Electricity
- 12.7%Fuel oil, kerosene, etc.
- 4.3%Bottled, tank, or LP gas
- 1.1%No fuel used
- 0.9%Other fuel
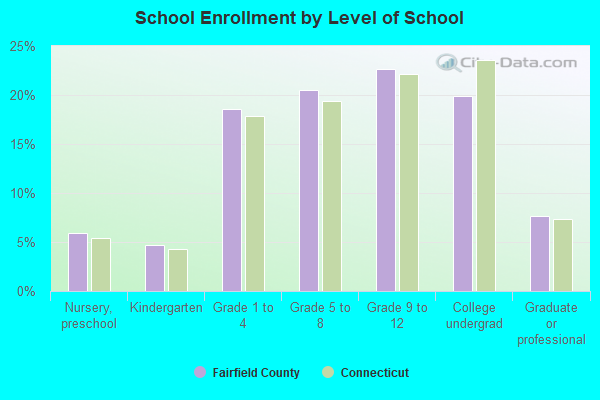
Private vs. public school enrollment:
| Here: | 12.4% |
| Connecticut: | 9.5% |
| Here: | 15.8% |
| Connecticut: | 12.9% |
| Here: | 40.5% |
| Connecticut: | 35.5% |
Supplemental Security Income (SSI) in 2006:
- Total number of recipients: 10,567
- Number of aged recipients: 1,957
- Number of blind and disabled recipients: 8,610
- Number of recipients under 18: 1,076
- Number of recipients between 18 and 64: 6,187
- Number of recipients older than 64: 3,304
- Number of recipients also receiving OASDI: 3,243
- Amount of payments (thousands of dollars): 4,818
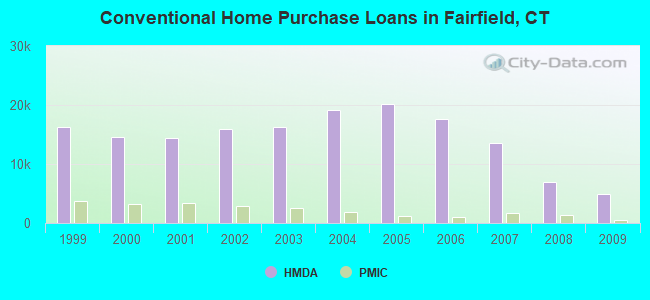
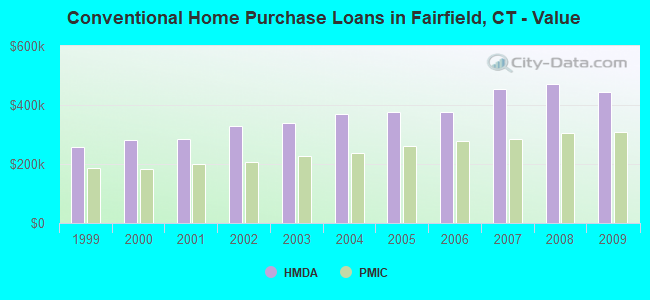
| Home Mortgage Disclosure Act Aggregated Statistics For Year 2009 (Based on 209 full tracts) | ||||||||||||||
| A) FHA, FSA/RHS & VA Home Purchase Loans | B) Conventional Home Purchase Loans | C) Refinancings | D) Home Improvement Loans | E) Loans on Dwellings For 5+ Families | F) Non-occupant Loans on < 5 Family Dwellings (A B C & D) | G) Loans On Manufactured Home Dwelling (A B C & D) | ||||||||
|---|---|---|---|---|---|---|---|---|---|---|---|---|---|---|
| Number | Average Value | Number | Average Value | Number | Average Value | Number | Average Value | Number | Average Value | Number | Average Value | Number | Average Value | |
| LOANS ORIGINATED | 1,793 | $281,643 | 4,869 | $444,110 | 22,119 | $396,009 | 849 | $307,296 | 29 | $4,709,379 | 991 | $367,955 | 13 | $135,462 |
| APPLICATIONS APPROVED, NOT ACCEPTED | 142 | $292,303 | 542 | $493,478 | 2,137 | $401,589 | 150 | $165,907 | 4 | $561,250 | 116 | $375,164 | 3 | $43,333 |
| APPLICATIONS DENIED | 405 | $253,541 | 827 | $425,677 | 7,134 | $399,261 | 554 | $176,433 | 2 | $591,500 | 548 | $289,071 | 11 | $66,727 |
| APPLICATIONS WITHDRAWN | 301 | $284,355 | 659 | $395,014 | 4,008 | $372,443 | 143 | $399,741 | 12 | $4,495,083 | 221 | $367,665 | 0 | $0 |
| FILES CLOSED FOR INCOMPLETENESS | 64 | $277,250 | 203 | $403,936 | 1,224 | $399,833 | 59 | $322,610 | 0 | $0 | 70 | $298,943 | 2 | $30,500 |
| Private Mortgage Insurance Companies Aggregated Statistics For Year 2009 (Based on 170 full tracts) | ||||||
| A) Conventional Home Purchase Loans | B) Refinancings | C) Non-occupant Loans on < 5 Family Dwellings (A & B) | ||||
|---|---|---|---|---|---|---|
| Number | Average Value | Number | Average Value | Number | Average Value | |
| LOANS ORIGINATED | 446 | $308,457 | 180 | $328,522 | 0 | $0 |
| APPLICATIONS APPROVED, NOT ACCEPTED | 204 | $304,230 | 126 | $322,659 | 4 | $277,750 |
| APPLICATIONS DENIED | 128 | $357,633 | 119 | $329,261 | 0 | $0 |
| APPLICATIONS WITHDRAWN | 33 | $314,091 | 37 | $321,973 | 0 | $0 |
| FILES CLOSED FOR INCOMPLETENESS | 26 | $322,462 | 6 | $333,167 | 1 | $191,000 |
| Most common first names in Fairfield County, CT among deceased individuals | ||
| Name | Count | Lived (average) |
|---|---|---|
| Mary | 8,239 | 81.4 years |
| John | 8,044 | 75.1 years |
| Joseph | 5,302 | 75.8 years |
| William | 4,820 | 74.4 years |
| Helen | 3,793 | 80.8 years |
| Anna | 3,715 | 83.0 years |
| George | 3,244 | 75.7 years |
| Margaret | 3,112 | 80.9 years |
| James | 3,082 | 73.1 years |
| Elizabeth | 2,854 | 81.5 years |
| Most common last names in Fairfield County, CT among deceased individuals | ||
| Last name | Count | Lived (average) |
|---|---|---|
| Smith | 1,447 | 76.0 years |
| Johnson | 886 | 76.8 years |
| Brown | 783 | 75.2 years |
| Miller | 649 | 77.8 years |
| Williams | 628 | 73.3 years |
| Anderson | 554 | 77.6 years |
| Jones | 500 | 73.5 years |
| Davis | 473 | 73.2 years |
| Wilson | 433 | 75.3 years |
| Taylor | 401 | 76.4 years |
| Businesses in Fairfield County, CT | ||||
| Name | Count | Name | Count | |
|---|---|---|---|---|
| 7-Eleven | 4 | JCPenney | 2 | |
| A&P | 3 | JoS. A. Bank | 5 | |
| ALDO | 2 | Johnny Rockets | 1 | |
| AT&T | 5 | Jones New York | 4 | |
| Abercrombie & Fitch | 2 | Journeys | 2 | |
| Abercrombie Kids | 2 | Justice | 2 | |
| Ace Hardware | 2 | KFC | 4 | |
| Advance Auto Parts | 2 | Kohl's | 3 | |
| Aeropostale | 2 | Kroger | 2 | |
| American Eagle Outfitters | 2 | LA Fitness | 2 | |
| Ann Taylor | 5 | La Quinta | 2 | |
| Apple Store | 2 | La-Z-Boy | 2 | |
| Applebee's | 1 | Lane Bryant | 1 | |
| Arby's | 2 | Lane Furniture | 4 | |
| Audi | 2 | LensCrafters | 2 | |
| AutoZone | 4 | Little Caesars Pizza | 1 | |
| Avenue | 1 | Lowe's | 1 | |
| BMW | 3 | Macy's | 2 | |
| Bakers | 1 | Marriott | 6 | |
| Bally Total Fitness | 1 | Marshalls | 5 | |
| Banana Republic | 3 | MasterBrand Cabinets | 37 | |
| Barnes & Noble | 2 | Mazda | 2 | |
| Baskin-Robbins | 7 | McDonald's | 19 | |
| Bath & Body Works | 2 | Men's Wearhouse | 5 | |
| Bed Bath & Beyond | 4 | Microtel | 1 | |
| Bentleymotors.Com | 1 | Motherhood Maternity | 4 | |
| Best Cellars | 3 | New Balance | 28 | |
| Best Western | 1 | New York & Co | 2 | |
| Blockbuster | 7 | Nike | 17 | |
| Brooks Brothers | 3 | Nissan | 3 | |
| Brookstone | 2 | OfficeMax | 1 | |
| Budget Car Rental | 1 | Old Navy | 3 | |
| Buffalo Wild Wings | 1 | Olive Garden | 1 | |
| Burger King | 6 | Outback | 3 | |
| CVS | 20 | Outback Steakhouse | 3 | |
| Cache | 1 | Pac Sun | 1 | |
| Casual Male XL | 1 | Panda Express | 2 | |
| Charlotte Russe | 2 | Panera Bread | 5 | |
| Chevrolet | 4 | Papa John's Pizza | 1 | |
| Chico's | 3 | Payless | 6 | |
| Chipotle | 1 | Penske | 3 | |
| Cinnabon | 2 | PetSmart | 1 | |
| Clarks | 2 | Pier 1 Imports | 2 | |
| Cold Stone Creamery | 2 | Pizza Hut | 1 | |
| Coldwater Creek | 1 | Pottery Barn | 2 | |
| Costco | 1 | Quality | 1 | |
| Crate & Barrel | 1 | Quiznos | 3 | |
| Curves | 4 | RadioShack | 15 | |
| DHL | 7 | Raymour & Flanigan | 1 | |
| Dairy Queen | 3 | Red Lobster | 1 | |
| Days Inn | 2 | Rite Aid | 10 | |
| Decora Cabinetry | 12 | Ruby Tuesday | 3 | |
| Dennys | 1 | Saks Fifth Avenue | 1 | |
| Domino's Pizza | 4 | Sears | 5 | |
| DressBarn | 4 | Sephora | 3 | |
| Dressbarn | 4 | Skechers USA | 1 | |
| Dunkin Donuts | 57 | Soma Intimates | 1 | |
| Eddie Bauer | 1 | Spencer Gifts | 2 | |
| Ethan Allen | 1 | Sprint Nextel | 10 | |
| Express | 2 | Staples | 5 | |
| Famous Footwear | 1 | Starbucks | 24 | |
| Fashion Bug | 2 | Stop & Shop | 16 | |
| FedEx | 157 | Subaru | 1 | |
| Finish Line | 2 | Subway | 33 | |
| Firestone Complete Auto Care | 5 | Super 8 | 1 | |
| Foot Locker | 2 | T-Mobile | 12 | |
| Ford | 1 | T.J.Maxx | 4 | |
| Forever 21 | 2 | Taco Bell | 4 | |
| GNC | 9 | Talbots | 4 | |
| GameStop | 9 | Target | 3 | |
| Gap | 8 | The Athlete's Foot | 3 | |
| Goodwill | 1 | The Cheesecake Factory | 1 | |
| Gymboree | 2 | The Food Emporium | 1 | |
| H&M | 2 | The Room Place | 4 | |
| H&R Block | 13 | Toyota | 4 | |
| Haagen-Dazs | 1 | Toys"R"Us | 3 | |
| Haworth | 1 | Trader Joe's | 2 | |
| Hilton | 4 | True Value | 8 | |
| Holiday Inn | 3 | U-Haul | 11 | |
| Hollister Co. | 2 | UPS | 125 | |
| Home Depot | 2 | Urban Outfitters | 1 | |
| Homestead Studio Suites | 1 | Verizon Wireless | 6 | |
| Honda | 1 | Victoria's Secret | 4 | |
| Hot Topic | 2 | Volkswagen | 3 | |
| Howard Johnson | 1 | Walgreens | 14 | |
| Hyatt | 1 | Walmart | 3 | |
| Hyundai | 2 | Wendy's | 3 | |
| IHOP | 1 | Wet Seal | 2 | |
| J. Jill | 2 | Whole Foods Market | 3 | |
| J.Crew | 6 | YMCA | 15 | |
Fairfield County on our top lists:
- #14 on the list of "Top 101 counties with the most Orthodox congregations (pop. 50,000+)"
- #14 on the list of "Top 101 counties with the most Orthodox congregations"
- #18 on the list of "Top 101 counties with the best general health status score of residents (1-5), 3 years of data"
- #21 on the list of "Top 101 counties with the most Catholic congregations (pop. 50,000+)"
- #21 on the list of "Top 101 counties with the most Catholic congregations"
- #21 on the list of "Top 101 counties with the most Catholic adherents (pop. 50,000+)"
- #21 on the list of "Top 101 counties with the most Catholic adherents"
- #22 on the list of "Top 101 counties with the highest percentage of residents that visited a dentist within the past year"
- #26 on the list of "Top 101 counties with the most Orthodox adherents (pop. 50,000+)"
- #26 on the list of "Top 101 counties with the most Orthodox adherents"
- #26 on the list of "Top 101 counties with the most Mainline Protestant adherents (pop. 50,000+)"
- #26 on the list of "Top 101 counties with the most Mainline Protestant adherents"
- #36 on the list of "Top 101 counties with the highest surface withdrawal of fresh water for public supply (pop. 50,000+)"
- #37 on the list of "Top 101 counties with the highest surface withdrawal of fresh water for public supply"
- #37 on the list of "Top 101 counties with the most Mainline Protestant congregations"
- #37 on the list of "Top 101 counties with the most Mainline Protestant congregations (pop. 50,000+)"
- #40 on the list of "Top 101 counties with the lowest percentage of residents that keep firearms around their homes"
- #43 on the list of "Top 101 counties with the largest number of people without health insurance coverage in 2000 (pop. 50,000+)"
- #45 on the list of "Top 101 counties with the highest carbon monoxide air pollution readings in 2012 (ppm)"
- #50 on the list of "Top 101 counties with the highest Nitrogen Dioxide air pollution readings in 2012 (ppm)"