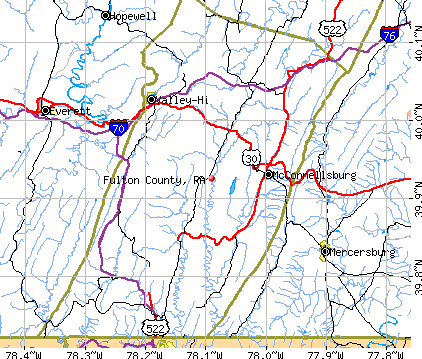
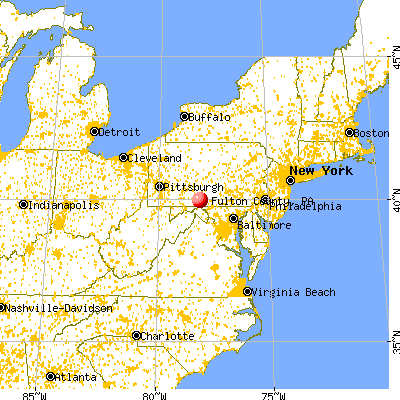
Fulton County, Pennsylvania (PA)
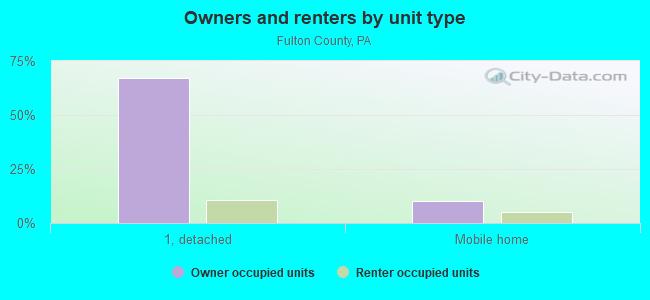
County owner-occupied free and clear houses and condos in 2010: 2,160
County owner-occupied houses and condos in 2000: 4,473
Renter-occupied apartments: 1,397 (it was 1,187 in 2000)
| % of renters here: | 21% |
| State: | 30% |
Land area: 438 sq. mi.
Water area: 0.5 sq. mi.
Population density: 33 people per square mile (low).
Industries providing employment: Manufacturing (21.8%), Educational, health and social services (20.4%), Retail trade (10.5%).
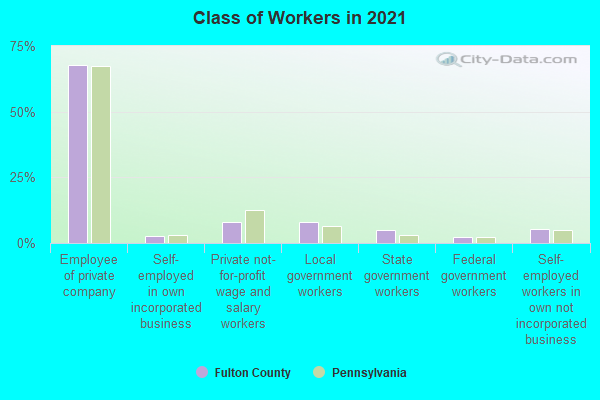
Type of workers:
- Private wage or salary: 79%
- Government: 15%
- Self-employed, not incorporated: 6%
- Unpaid family work: 1%
- OSM Map
- General Map
- Google Map
- MSN Map

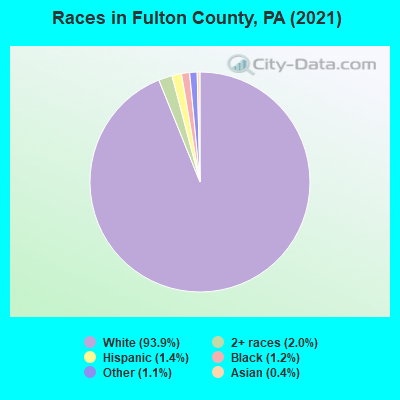
- 13,43693.2%White Non-Hispanic Alone
- 3492.4%Two or more races
- 2081.4%Hispanic or Latino
- 1941.3%Some other race alone
- 1911.3%Black Non-Hispanic Alone
- 320.2%Asian alone
- 20.01%American Indian and Alaska Native alone
| Median resident age: | 45.8 years |
| Pennsylvania median age: | 40.9 years |
| Males: 7,471 | |
| Females: 7,054 |

 | PA Supreme Court “Mail In Voting Unconstitutional” (70 replies) |
| Trump or Biden (335 replies) |
| State Dept. Recommends Pittsburgh As U.S. Destination For Afghan Refugees (52 replies) |
| Moving to PA... Where would you live (rural areas only) ? (74 replies) |
| PA City/Borough Population Estimates (2017) (28 replies) |
| PA City and County Poverty Levels (37 replies) |
| Fulton County: | 2.0 people |
| Pennsylvania: | 2 people |
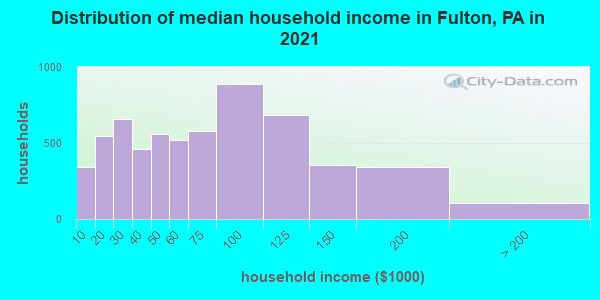
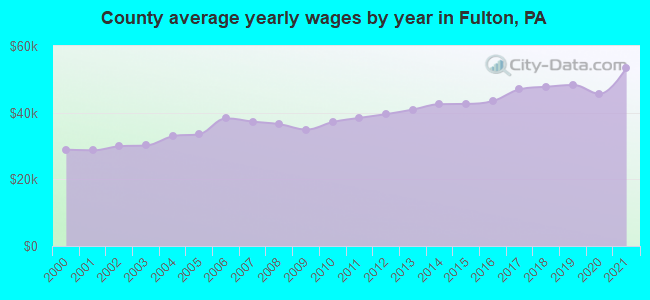
Estimated median household income in 2022: $61,968 ($34,882 in 1999)
| This county: | $61,968 |
| Pennsylvania: | $71,798 |
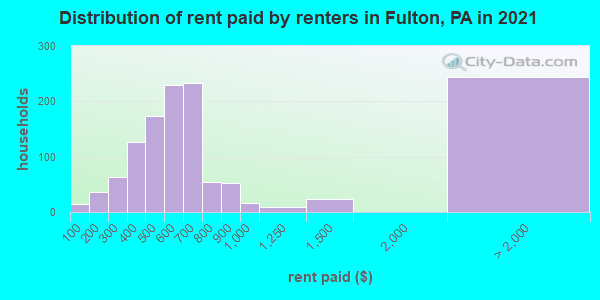
Median contract rent in 2022 for apartments: $582 (lower quartile is $435, upper quartile is $723)
| This county: | $582 |
| State: | $922 |
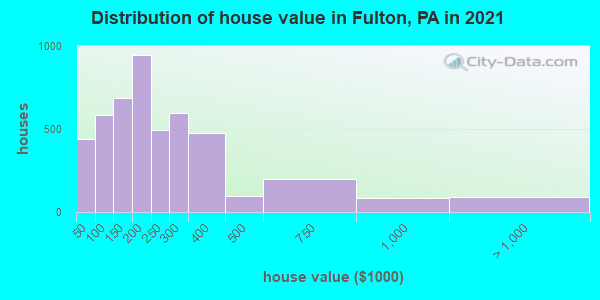
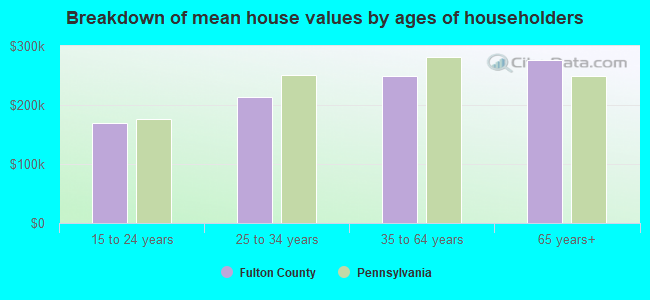
Estimated median house or condo value in 2022: $204,041 (it was $82,200 in 2000)
| Fulton: | $204,041 |
| Pennsylvania: | $245,500 |
Median monthly housing costs for homes and condos with a mortgage: $1,342
Median monthly housing costs for units without a mortgage: $461
Institutionalized population: 39
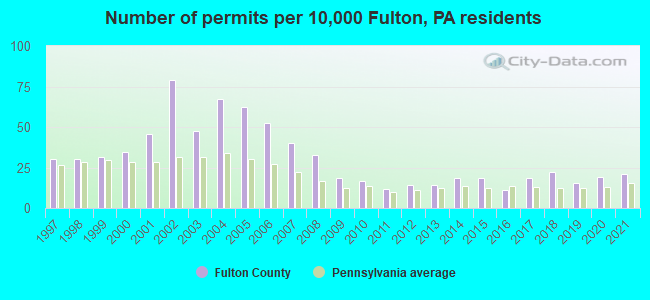
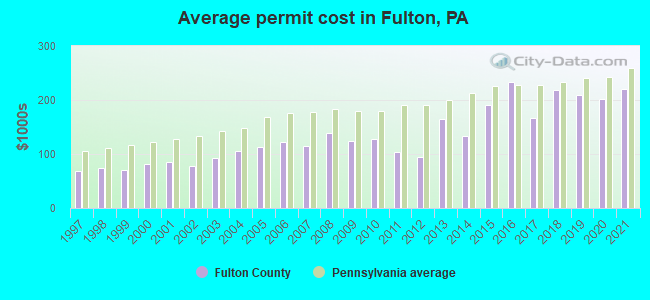
Single-family new house construction building permits:
- 2022: 28 buildings, average cost: $275,200
- 2021: 30 buildings, average cost: $221,300
- 2020: 27 buildings, average cost: $201,400
- 2019: 22 buildings, average cost: $210,400
- 2018: 32 buildings, average cost: $217,800
- 2017: 26 buildings, average cost: $166,400
- 2016: 16 buildings, average cost: $233,900
- 2015: 26 buildings, average cost: $191,300
- 2014: 26 buildings, average cost: $133,500
- 2013: 20 buildings, average cost: $163,900
- 2012: 20 buildings, average cost: $95,300
- 2011: 17 buildings, average cost: $103,000
- 2010: 24 buildings, average cost: $127,000
- 2009: 26 buildings, average cost: $125,400
- 2008: 47 buildings, average cost: $139,300
- 2007: 57 buildings, average cost: $114,400
- 2006: 75 buildings, average cost: $122,400
- 2005: 89 buildings, average cost: $113,300
- 2004: 96 buildings, average cost: $105,800
- 2003: 68 buildings, average cost: $92,000
- 2002: 113 buildings, average cost: $77,800
- 2001: 65 buildings, average cost: $86,000
- 2000: 49 buildings, average cost: $81,800
- 1999: 45 buildings, average cost: $70,900
- 1998: 43 buildings, average cost: $73,800
- 1997: 43 buildings, average cost: $69,000
Median real estate property taxes paid for housing units with mortgages in 2022: $2,214 (1.0%)
Median real estate property taxes paid for housing units with no mortgage in 2022: $1,828 (1.0%)
| Fulton County: | 10.7% |
| Pennsylvania: | 11.8% |
Median age of residents in 2022: 45.8 years old
(Males: 44.9 years old, Females: 46.7 years old)
(Median age for: White residents: 47.0 years old, Black residents: 45.0 years old, Hispanic or Latino residents: 18.8 years old, Other race residents: 41.1 years old)
Fair market rent in 2006 for a 1-bedroom apartment in Fulton County is $417 a month.
Fair market rent for a 2-bedroom apartment is $491 a month.
Fair market rent for a 3-bedroom apartment is $605 a month.
Cities in this county include: McConnellsburg, Needmore, Valley-Hi.
Neighboring counties: Camden County, New Jersey  , Bedford County
  , White Pine County, Nevada
  , Washington County, Colorado .
| Here: | 2.9% |
| Pennsylvania: | 2.9% |
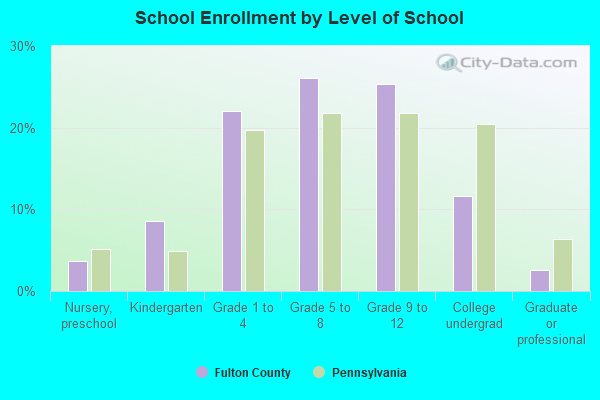
Current college students: 285
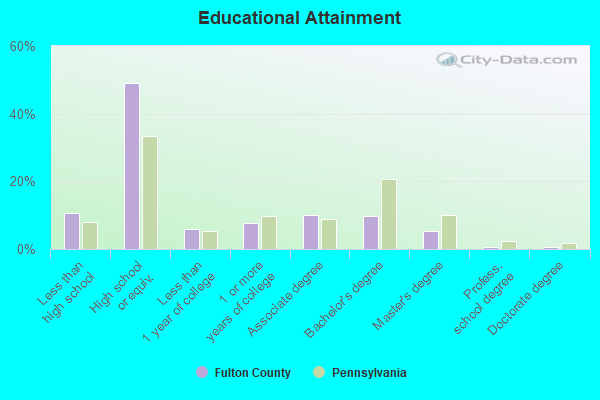
People 25 years of age or older with a high school degree or higher: 89.4%
People 25 years of age or older with a bachelor's degree or higher: 16.3%
Number of foreign born residents: 117 (43.2% naturalized citizens)
| Fulton County: | 0.8% |
| Whole state: | 7.5% |
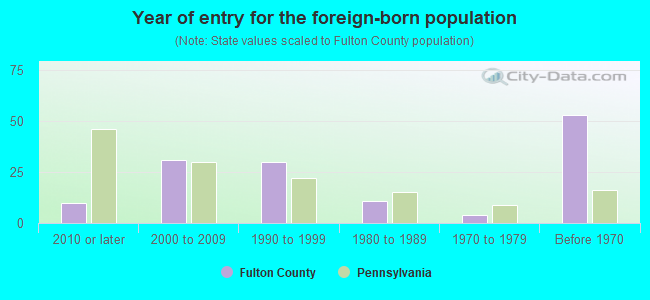
- Year of entry for the foreign-born population
- 282010 or later
- 272000 to 2009
- 301990 to 1999
- 111980 to 1989
- 41970 to 1979
- 53Before 1970
Mean travel time to work (commute): minutes
Percentage of county residents living and working in this county: 78.8%
Housing units in structures:
- One, detached: 5,589
- One, attached: 129
- Two: 108
- 3 or 4: 77
- 5 to 9: 94
- 10 to 19: 92
- 20 to 49: 11
- 50 or more: 10
- Mobile homes: 1,037
- Boats, RVs, vans, etc.: 3
Housing units in Fulton County with a mortgage: 2,267 (349 second mortgage, 19 home equity loan, 274 both second mortgage and home equity loan)
Houses without a mortgage: 166
| Here: | 1.2% with mortgage |
| State: | 93.8% with mortgage |
Religion statistics for Fulton County
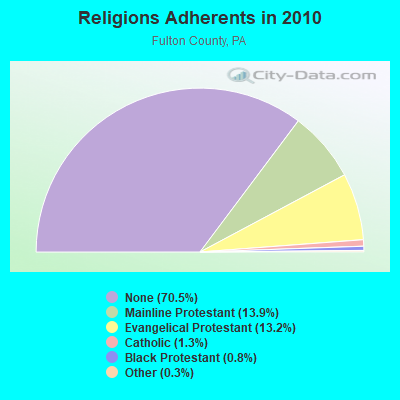
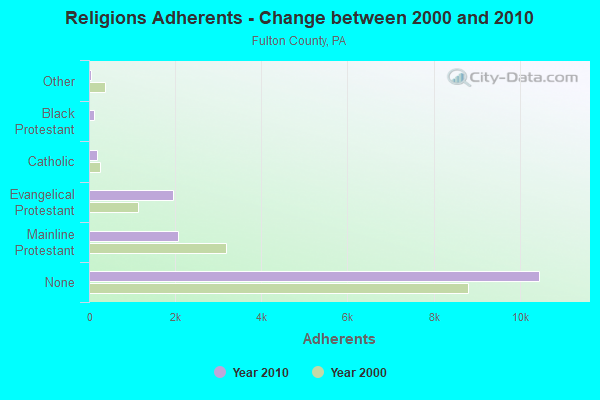
| Religion | Adherents | Congregations |
|---|---|---|
| Mainline Protestant | 2,060 | 23 |
| Evangelical Protestant | 1,962 | 20 |
| Catholic | 191 | 1 |
| Black Protestant | 122 | 1 |
| Other | 51 | 1 |
| None | 10,459 | - |
Source: Clifford Grammich, Kirk Hadaway, Richard Houseal, Dale E.Jones, Alexei Krindatch, Richie Stanley and Richard H.Taylor. 2012. 2010 U.S.Religion Census: Religious Congregations & Membership Study. Association of Statisticians of American Religious Bodies. Jones, Dale E., et al. 2002. Congregations and Membership in the United States 2000. Nashville, TN: Glenmary Research Center.
Food Environment Statistics:
| Fulton County: | 1.34 / 10,000 pop. |
| State: | 2.04 / 10,000 pop. |
| This county: | 0.67 / 10,000 pop. |
| Pennsylvania: | 0.88 / 10,000 pop. |
| Fulton County: | 8.03 / 10,000 pop. |
| Pennsylvania: | 2.52 / 10,000 pop. |
| This county: | 4.01 / 10,000 pop. |
| State: | 7.12 / 10,000 pop. |
| Fulton County: | 9.6% |
| Pennsylvania: | 9.1% |
| Fulton County: | 28.7% |
| State: | 27.2% |
| Here: | 12.8% |
| State: | 11.5% |
Agriculture in Fulton County:
Average size of farms: 179 acresAverage value of agricultural products sold per farm: $45,771
Average value of crops sold per acre for harvested cropland: $65.58
The value of livestock, poultry, and their products as a percentage of the total market value of agricultural products sold: 89.57%
Average total farm production expenses per farm: $48,880
Harvested cropland as a percentage of land in farms: 40.59%
Irrigated harvested cropland as a percentage of land in farms: 0.10%
Average market value of all machinery and equipment per farm: $84,981
The percentage of farms operated by a family or individual: 91.98%
Average age of principal farm operators: 54 years
Average number of cattle and calves per 100 acres of all land in farms: 16.75
Milk cows as a percentage of all cattle and calves: 33.15%
Corn for grain: 3847 harvested acres
All wheat for grain: 1449 harvested acres
Soybeans for beans: 274 harvested acres
Vegetables: 16 harvested acres
Land in orchards: 20 acres
Earthquake activity:
Fulton County-area historical earthquake activity is significantly above Pennsylvania state average. It is 55% smaller than the overall U.S. average.On 8/23/2011 at 17:51:04, a magnitude 5.8 (5.8 MW, Depth: 3.7 mi, Class: Moderate, Intensity: VI - VII) earthquake occurred 139.6 miles away from Fulton County center
On 9/25/1998 at 19:52:52, a magnitude 5.2 (4.8 MB, 4.3 MS, 5.2 LG, 4.5 MW, Depth: 3.1 mi) earthquake occurred 162.3 miles away from the county center
On 1/16/1994 at 01:49:16, a magnitude 4.6 (4.6 MB, 4.6 LG, Depth: 3.1 mi, Class: Light, Intensity: IV - V) earthquake occurred 112.2 miles away from the county center
On 1/31/1986 at 16:46:43, a magnitude 5.0 (5.0 MB) earthquake occurred 198.3 miles away from the county center
On 8/25/2011 at 05:07:52, a magnitude 4.5 (4.5 ML, Depth: 4.2 mi) earthquake occurred 136.9 miles away from Fulton County center
On 12/9/2003 at 20:59:18, a magnitude 4.5 (4.5 ML, Depth: 6.2 mi) earthquake occurred 148.7 miles away from the county center
Magnitude types: regional Lg-wave magnitude (LG), body-wave magnitude (MB), local magnitude (ML), surface-wave magnitude (MS), moment magnitude (MW)
Most recent natural disasters:
- Pennsylvania Covid-19 Pandemic, Incident Period: January 20, 2020, Major Disaster (Presidential) Declared DR-4506-PA: March 30, 2020, FEMA Id: 4506, Natural disaster type: Other
- Pennsylvania Severe Winter Storm and Snowstorm, Incident Period: January 22, 2016 to January 23, 2016, Major Disaster (Presidential) Declared DR-4267: March 23, 2016, FEMA Id: 4267, Natural disaster type: Snowstorm, Winter Storm
- Pennsylvania Hurricane Sandy, Incident Period: October 26, 2012 to November 08, 2012, Emergency Declared EM-3356: October 29, 2012, FEMA Id: 3356, Natural disaster type: Hurricane
- Pennsylvania Hurricane Sandy, Incident Period: October 26, 2012 to November 08, 2012, Major Disaster (Presidential) Declared DR-4099: January 10, 2013, FEMA Id: 4099, Natural disaster type: Hurricane
- Pennsylvania Remnants of Tropical Storm Lee, Incident Period: September 03, 2011 to October 15, 2011, Major Disaster (Presidential) Declared EM-3340: September 08, 2011, FEMA Id: 3340, Natural disaster type: Tropical Storm
- Pennsylvania Severe Winter Storms and Snowstorms, Incident Period: February 05, 2010 to February 11, 2010, Major Disaster (Presidential) Declared DR-1898: April 16, 2010, FEMA Id: 1898, Natural disaster type: Snowstorm, Winter Storm
- Pennsylvania Hurricane Katrina Evacuation, Incident Period: August 29, 2005 to October 01, 2005, Emergency Declared EM-3235: September 10, 2005, FEMA Id: 3235, Natural disaster type: Hurricane
- Pennsylvania Tropical Depression Ivan, Incident Period: September 17, 2004 to October 01, 2004, Major Disaster (Presidential) Declared DR-1557: September 19, 2004, FEMA Id: 1557, Natural disaster type: Tropical Depression
- Pennsylvania Snowstorm, Incident Period: February 14, 2003 to February 19, 2003, Emergency Declared EM-3180: March 14, 2003, FEMA Id: 3180, Natural disaster type: Snowstorm
- Pennsylvania Flooding, Incident Period: January 19, 1996 to February 01, 1996, Major Disaster (Presidential) Declared DR-1093: January 21, 1996, FEMA Id: 1093, Natural disaster type: Flood
- 4 other natural disasters have been reported since 1953.
The number of natural disasters in Fulton County (14) is near the US average (15).
Major Disasters (Presidential) Declared: 10
Emergencies Declared: 4
Causes of natural disasters: Hurricanes: 3, Snowstorms: 3, Winter Storms: 3, Floods: 2, Tropical Storms: 2, Blizzard: 1, Heavy Rain: 1, Snowfall: 1, Storm: 1, Tropical Depression: 1, Other: 1 (Note: some incidents may be assigned to more than one category).
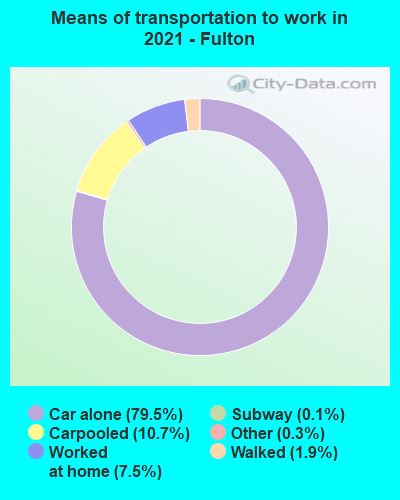
Means of transportation to work:
- Drove a car alone: 4,269 (76.8%)
- Carpooled: 571 (10.3%)
- Bus: 13 (0.2%)
- Taxicab, motorcycle, or other means: 32 (0.6%)
- Walked: 85 (1.5%)
- Worked at home: 535 (9.6%)
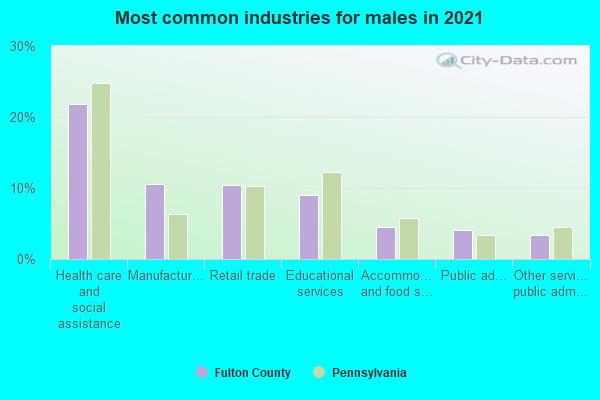
- Health care and social assistance (22%)
- Manufacturing (11%)
- Retail trade (10%)
- Educational services (9%)
- Accommodation and food services (5%)
- Public administration (4%)
- Other services, except public administration (4%)
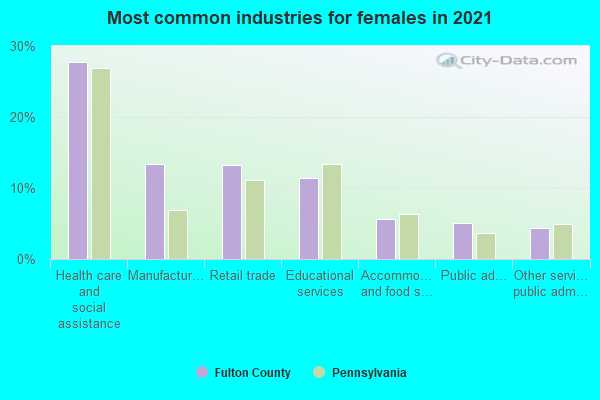
- Health care and social assistance (28%)
- Manufacturing (14%)
- Retail trade (13%)
- Educational services (11%)
- Accommodation and food services (7%)
- Public administration (5%)
- Other services, except public administration (4%)
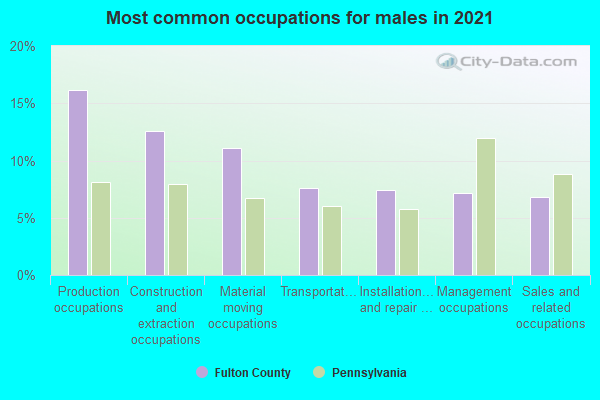
- Production occupations (17%)
- Construction and extraction occupations (12%)
- Material moving occupations (10%)
- Transportation occupations (8%)
- Sales and related occupations (8%)
- Installation, maintenance, and repair occupations (8%)
- Management occupations (7%)
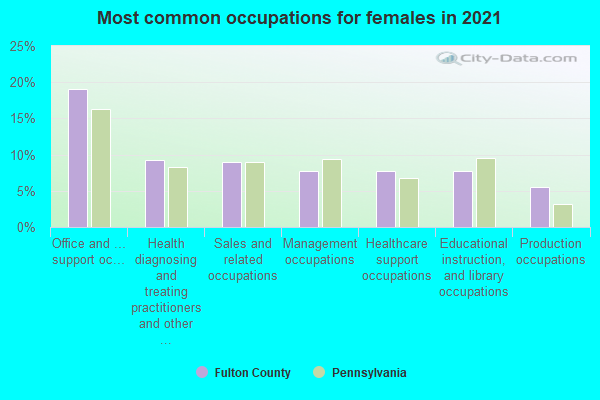
- Office and administrative support occupations (17%)
- Sales and related occupations (8%)
- Healthcare support occupations (8%)
- Health diagnosing and treating practitioners and other technical occupations (8%)
- Educational instruction, and library occupations (8%)
- Management occupations (7%)
- Production occupations (6%)
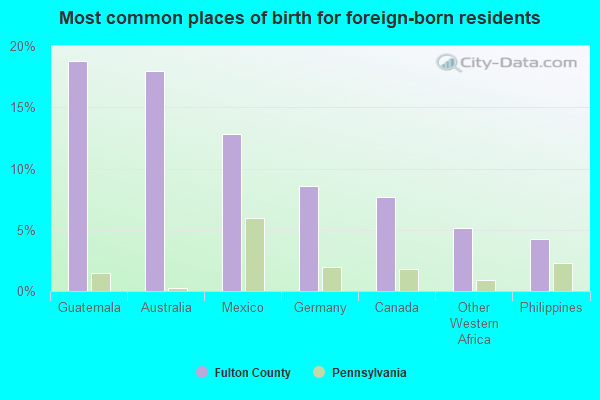
- Nicaragua (22%)
- Canada (15%)
- Guatemala (12%)
- Other Western Africa (11%)
- Germany (6%)
- Cuba (6%)
- Mexico (6%)
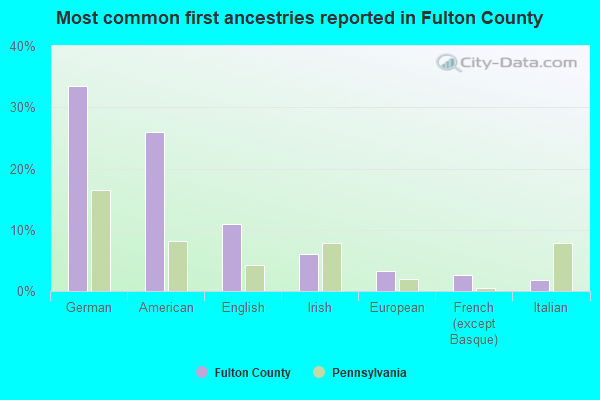
- German (33%)
- American (25%)
- English (11%)
- Irish (6%)
- European (2%)
- French (except Basque) (2%)
- Italian (2%)
People in group quarters in Fulton County, Pennsylvania in 2010:
- 81 people in college/university student housing
- 29 people in correctional facilities intended for juveniles
- 10 people in nursing facilities/skilled-nursing facilities
- 2 people in other noninstitutional facilities
People in group quarters in Fulton County, Pennsylvania in 2000:
- 57 people in nursing homes
- 35 people in other noninstitutional group quarters
- 10 people in other group homes
4.49% of this county's 2021 resident taxpayers lived in other counties in 2020 ($48,423 average adjusted gross income)
| Here: | 4.49% |
| Pennsylvania average: | 5.27% |
10 or fewer of this county's residents moved from foreign countries.
2.76% relocated from other counties in Pennsylvania ($26,331 average AGI)
1.73% relocated from other states ($22,092 average AGI)
Fulton County: 1.73% Pennsylvania average: 2.30%
Top counties from which taxpayers relocated into this county between 2020 and 2021:
| from Franklin County, PA | |
| from Washington County, MD | |
| from Huntingdon County, PA |
4.10% of this county's 2020 resident taxpayers moved to other counties in 2021 ($59,202 average adjusted gross income)
| Here: | 4.10% |
| Pennsylvania average: | 5.44% |
10 or fewer of this county's residents moved to foreign countries.
2.55% relocated to other counties in Pennsylvania ($30,494 average AGI)
1.54% relocated to other states ($28,709 average AGI)
Fulton County: 1.54% Pennsylvania average: 2.47%

Top counties to which taxpayers relocated from this county between 2020 and 2021:
| to Franklin County, PA | |
| to Washington County, MD | |
| to Bedford County, PA |
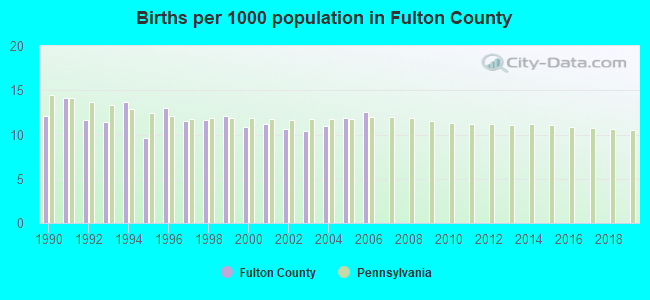
Births per 1000 population from 1990 to 1999: 12.1
Births per 1000 population from 2000 to 2006: 11.2
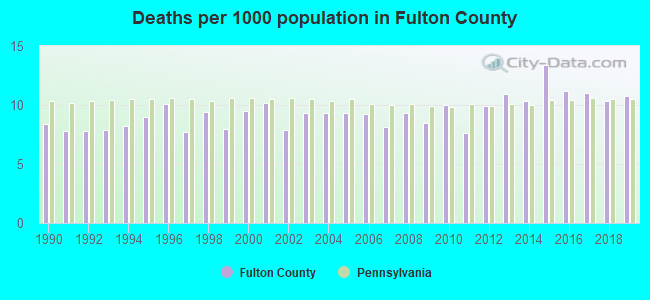
Deaths per 1000 population from 1990 to 1999: 8.4
Deaths per 1000 population from 2000 to 2009: 9.1
Deaths per 1000 population from 2010 to 2020: 10.8
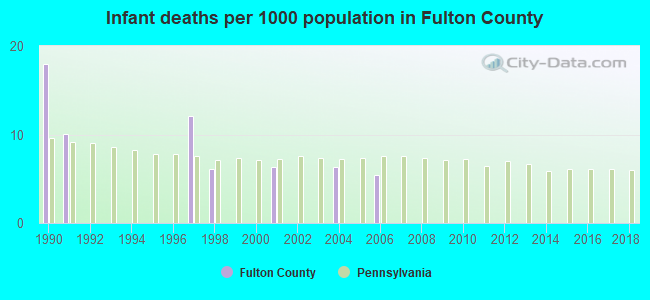
Infant deaths per 1000 live births from 1990 to 1999: 4.6
Infant deaths per 1000 live births from 2000 to 2006: 2.6
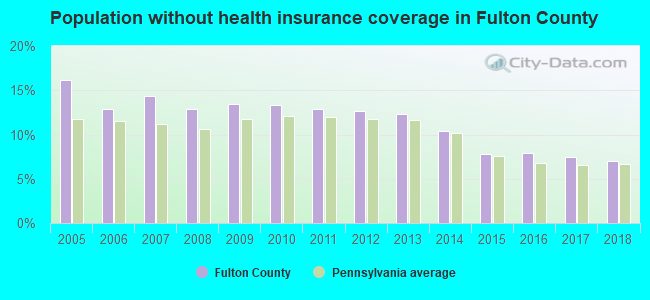
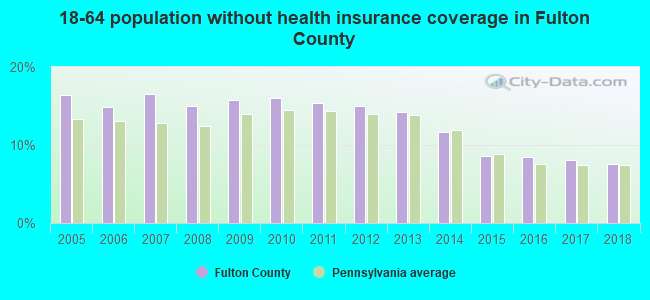
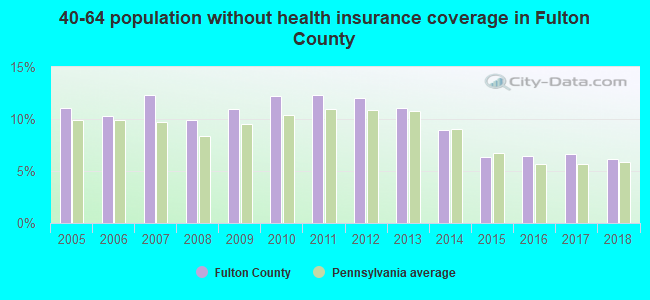
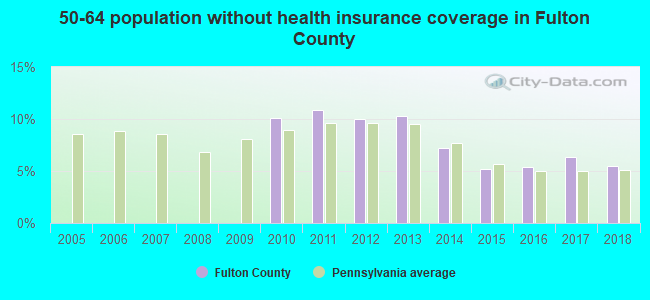
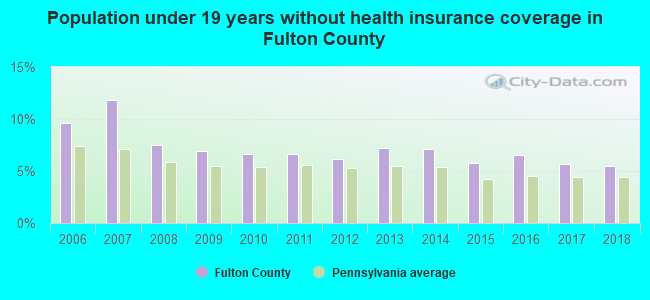
Persons under 19 years old without health insurance coverage in 2018: 5.5%
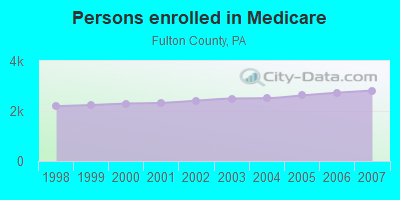
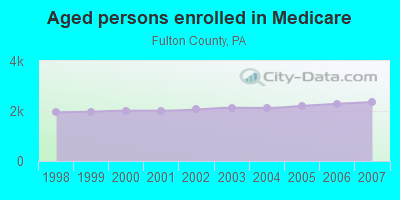
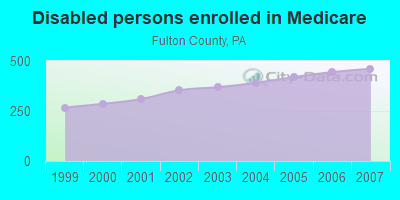
Persons enrolled in hospital insurance and/or supplemental medical insurance (Medicare) in July 1, 2007: 2,819 (2,358 aged, 461 disabled)
Children under 18 without health insurance coverage in 2007: 258 (7%)
Most common underlying causes of death in Fulton County, Pennsylvania in 1999 - 2019:
- Acute myocardial infarction, unspecified (190)
- Other ill-defined and unspecified causes of mortality (120)
- Atherosclerotic heart disease (110)
- Bronchus or lung, unspecified - Malignant neoplasms (95)
- Congestive heart failure (14)
Population without health insurance coverage in 2000: 9%
Children under 18 without health insurance coverage in 2000: 8%
Short term general hospital admissions per 100,000 population in 2004: 8,620
Short term general hospital beds per 100,000 population in 2004: 560
Emergency room visits per 100,000 population in 2004: 62,448
General practice office based MDs per 100,000 population in 2005: 1,165
Medical specialist MDs per 100,000 population in 2005: 1,009
Dentists per 100,000 population in 1998: 14
Total births per 100,000 population, July 2005 - July 2006 : 14
Total deaths per 100,000 population, July 2005 - July 2006: 68
Limited-service eating places per 100,000 population in 2005 : 7
Household type by relationship:
Households: 14,525- Male householders: 3,174 (924 living alone), Female householders: 3,066 (897 living alone)
3,349 spouses (3,335 opposite-sex spouses), 404 unmarried partners, (381 opposite-sex unmarried partners), 3,716 children (3,508 natural, 63 adopted, 144 stepchildren), 274 grandchildren, 37 brothers or sisters, 151 parents, 5 foster children, 167 other relatives, 153 non-relatives
- In group quarters: 42
Size of family households: 2,039 2-persons, 908 3-persons, 683 4-persons, 358 5-persons, 87 6-persons, 60 7-or-more-persons.
Size of nonfamily households: 1,822 1-person, 266 2-persons, 7 3-persons.
1,854 married couples with children.
666 single-parent households (120 men, 546 women).
98.3% of residents of Fulton speak English at home.
0.5% of residents speak Spanish at home (73% speak English very well, 23% speak English well, 3% speak English not well).
0.8% of residents speak other Indo-European language at home (84% speak English very well, 9% speak English well, 7% speak English not well).
In fiscal year 2004:
Federal Government expenditure: $86,886,000 ($5,934 per capita)
Department of Defense expenditure: $11,941,000
Federal direct payments to individuals for retirement and disability: $39,694,000
Federal other direct payments to individuals: $15,023,000
Federal direct payments not to individuals: $1,438,000
Federal grants: $17,411,000
Federal procurement contracts: $11,205,000 ($10,229,000 Department of Defense)
Federal salaries and wages: $2,115,000 ($63,000 Department of Defense)
Federal Government direct loans: $702,000
Federal guaranteed/insured loans: $4,034,000
Federal Government insurance: $2,345,000
Population change from April 1, 2000 to July 1, 2005:
Births: 819| Here: | 56 per 1000 residents |
| State: | 61 per 1000 residents |
Deaths: 681
| Here: | 46 per 1000 residents |
| State: | 54 per 1000 residents |
Net international migration: +3
| Here: | +0 per 1000 residents |
| State: | +8 per 1000 residents |
Net internal migration: +290
| Here: | |
| State: |
Total withdrawal of fresh water for public supply: 0.08 millions of gallons per day (all from ground)
| Here: | 6.4 |
| State: | 6.8 |
| Here: | 5.4 |
| State: | 4.3 |
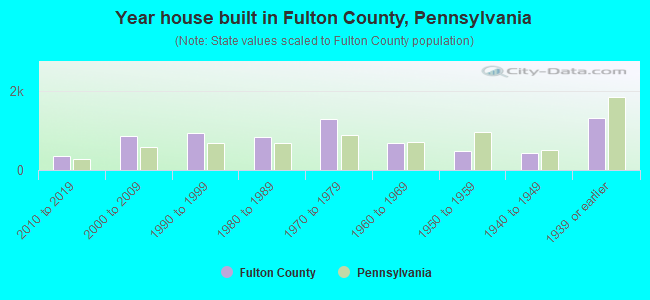
- Year house built in Fulton County, Pennsylvania
- 92020 or later
- 3452010 to 2019
- 9612000 to 2009
- 7991990 to 1999
- 9051980 to 1989
- 1,2771970 to 1979
- 6431960 to 1969
- 5311950 to 1959
- 4011940 to 1949
- 1,2901939 or earlier
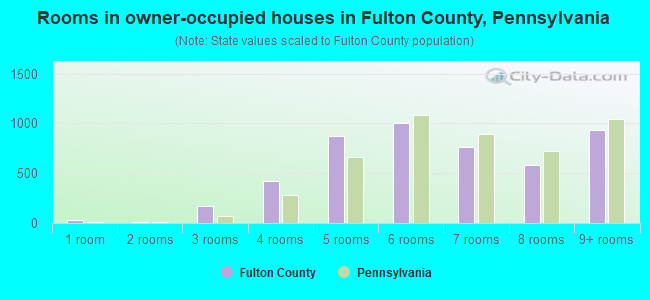
- Rooms in owner-occupied houses in Fulton County, Pennsylvania
- 251 room
- 162 rooms
- 1733 rooms
- 3744 rooms
- 9325 rooms
- 9956 rooms
- 8277 rooms
- 5728 rooms
- 9109+ rooms
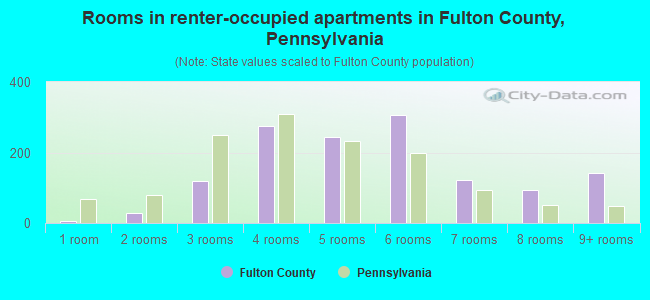
- Rooms in renter-occupied apartments in Fulton County, Pennsylvania
- 191 room
- 202 rooms
- 1323 rooms
- 3184 rooms
- 2575 rooms
- 3046 rooms
- 997 rooms
- 1098 rooms
- 1529+ rooms
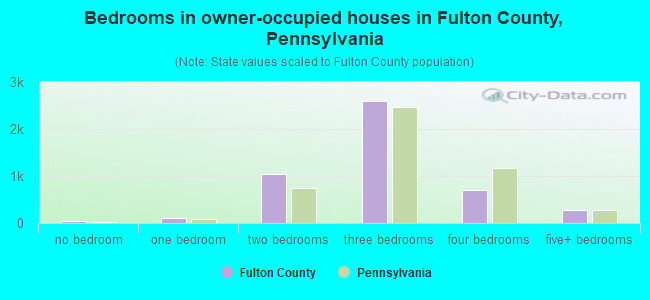
- Bedrooms in owner-occupied houses in Fulton County, Pennsylvania
- 29no bedroom
- 1181 bedroom
- 9922 bedrooms
- 2,6713 bedrooms
- 7254 bedrooms
- 2645+ bedrooms
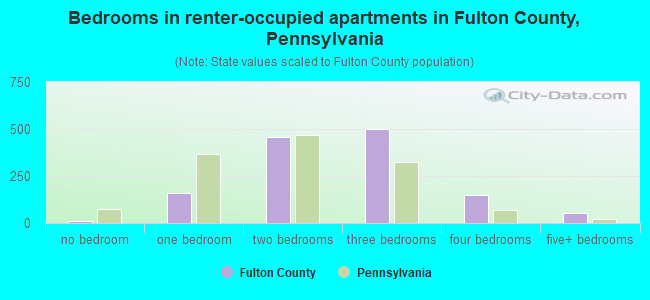
- Bedrooms in renter-occupied apartments in Fulton County, Pennsylvania
- 20no bedroom
- 2001 bedroom
- 4772 bedrooms
- 5253 bedrooms
- 1384 bedrooms
- 515+ bedrooms
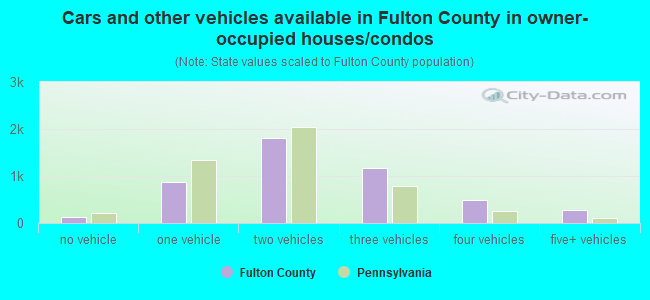
- Cars and other vehicles available in Fulton County in owner-occupied houses/condos
- 149no vehicle
- 8861 vehicle
- 1,8032 vehicles
- 1,1203 vehicles
- 5344 vehicles
- 2745+ vehicles
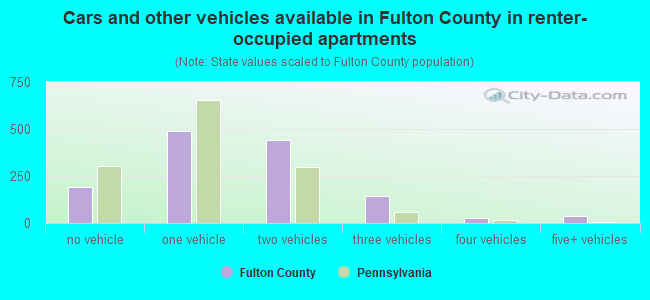
- Cars and other vehicles available in Fulton County in renter-occupied apartments
- 202no vehicle
- 5471 vehicle
- 4462 vehicles
- 1783 vehicles
- 364 vehicles
- 315+ vehicles
94.1% of Fulton County residents lived in the same house 1 years ago.
Out of people who lived in different houses, 33% lived in this county.
Out of people who lived in different counties, 52% lived in Pennsylvania.
| Fulton County: | 94.1% |
| State average: | 89.3% |
Place of birth for U.S.-born residents:
- This state: 10,199
- Other state: 4,118
- Northeast: 411
- Midwest: 249
- South: 3,247
- West: 199
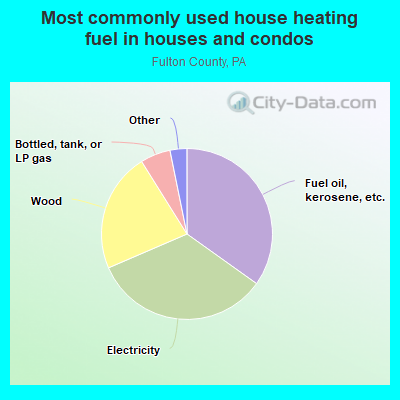
- 34.9%Fuel oil, kerosene, etc.
- 33.8%Electricity
- 21.5%Wood
- 6.1%Bottled, tank, or LP gas
- 1.5%No fuel used
- 1.1%Other fuel
- 0.6%Coal or coke
- 0.3%Solar energy
- 0.2%Utility gas
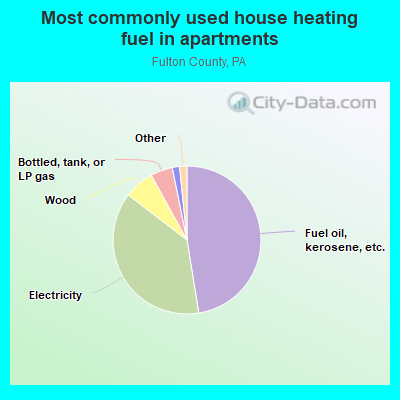
- 44.0%Fuel oil, kerosene, etc.
- 42.6%Electricity
- 6.4%Wood
- 3.4%Bottled, tank, or LP gas
- 1.6%Other fuel
- 0.9%No fuel used
- 0.6%Coal or coke
- 0.6%Utility gas
Private vs. public school enrollment:
| Here: | 14.8% |
| Pennsylvania: | 15.7% |
| Here: | 11.7% |
| Pennsylvania: | 13.4% |
| Here: | 21.2% |
| Pennsylvania: | 39.8% |
Fulton County government finances - Expenditure in 2018:
- Charges - Other: $776,000
- Construction - General - Other: $269,000
General Public Buildings: $32,000
- Current Operations - Public Welfare - Other: $3,349,000
Police Protection: $2,040,000
Judicial and Legal Services: $1,799,000
Central Staff Services: $1,474,000
General - Other: $1,125,000
Regular Highways: $312,000
Natural Resources - Other: $149,000
Parks and Recreation: $11,000
- Federal Intergovernmental - Other: $644,000
General Local Government Support: $361,000
- General - Interest on Debt: $166,000
- Long Term Debt - Beginning Outstanding - Unspecified Public Purpose: $4,477,000
Outstanding Unspecified Public Purpose: $4,205,000
Retired Unspecified Public Purpose: $272,000
- Miscellaneous - Fines and Forfeits: $279,000
Interest Earnings: $28,000
- Other Capital Outlay - General - Other: $44,000
Judicial and Legal Services: $11,000
- Other Funds - Cash and Securities: $6,326,000
- State Intergovernmental - Other: $1,716,000
General Local Government Support: $1,600,000
- Tax - Property: $4,955,000
Other License: $27,000
- Total Salaries and Wages: $2,603,000
Fulton County government finances - Revenue in 2018:
- Charges - Other: $776,000
- Construction - General - Other: $269,000
General Public Buildings: $32,000
- Current Operations - Public Welfare - Other: $3,349,000
Police Protection: $2,040,000
Judicial and Legal Services: $1,799,000
Central Staff Services: $1,474,000
General - Other: $1,125,000
Regular Highways: $312,000
Natural Resources - Other: $149,000
Parks and Recreation: $11,000
- Federal Intergovernmental - Other: $644,000
General Local Government Support: $361,000
- General - Interest on Debt: $166,000
- Long Term Debt - Beginning Outstanding - Unspecified Public Purpose: $4,477,000
Outstanding Unspecified Public Purpose: $4,205,000
Retired Unspecified Public Purpose: $272,000
- Miscellaneous - Fines and Forfeits: $279,000
Interest Earnings: $28,000
- Other Capital Outlay - General - Other: $44,000
Judicial and Legal Services: $11,000
- Other Funds - Cash and Securities: $6,326,000
- State Intergovernmental - Other: $1,716,000
General Local Government Support: $1,600,000
- Tax - Property: $4,955,000
Other License: $27,000
- Total Salaries and Wages: $2,603,000
Fulton County government finances - Debt in 2018:
- Charges - Other: $776,000
- Construction - General - Other: $269,000
General Public Buildings: $32,000
- Current Operations - Public Welfare - Other: $3,349,000
Police Protection: $2,040,000
Judicial and Legal Services: $1,799,000
Central Staff Services: $1,474,000
General - Other: $1,125,000
Regular Highways: $312,000
Natural Resources - Other: $149,000
Parks and Recreation: $11,000
- Federal Intergovernmental - Other: $644,000
General Local Government Support: $361,000
- General - Interest on Debt: $166,000
- Long Term Debt - Beginning Outstanding - Unspecified Public Purpose: $4,477,000
Outstanding Unspecified Public Purpose: $4,205,000
Retired Unspecified Public Purpose: $272,000
- Miscellaneous - Fines and Forfeits: $279,000
Interest Earnings: $28,000
- Other Capital Outlay - General - Other: $44,000
Judicial and Legal Services: $11,000
- Other Funds - Cash and Securities: $6,326,000
- State Intergovernmental - Other: $1,716,000
General Local Government Support: $1,600,000
- Tax - Property: $4,955,000
Other License: $27,000
- Total Salaries and Wages: $2,603,000
Fulton County government finances - Cash and Securities in 2018:
- Charges - Other: $776,000
- Construction - General - Other: $269,000
General Public Buildings: $32,000
- Current Operations - Public Welfare - Other: $3,349,000
Police Protection: $2,040,000
Judicial and Legal Services: $1,799,000
Central Staff Services: $1,474,000
General - Other: $1,125,000
Regular Highways: $312,000
Natural Resources - Other: $149,000
Parks and Recreation: $11,000
- Federal Intergovernmental - Other: $644,000
General Local Government Support: $361,000
- General - Interest on Debt: $166,000
- Long Term Debt - Beginning Outstanding - Unspecified Public Purpose: $4,477,000
Outstanding Unspecified Public Purpose: $4,205,000
Retired Unspecified Public Purpose: $272,000
- Miscellaneous - Fines and Forfeits: $279,000
Interest Earnings: $28,000
- Other Capital Outlay - General - Other: $44,000
Judicial and Legal Services: $11,000
- Other Funds - Cash and Securities: $6,326,000
- State Intergovernmental - Other: $1,716,000
General Local Government Support: $1,600,000
- Tax - Property: $4,955,000
Other License: $27,000
- Total Salaries and Wages: $2,603,000
Supplemental Security Income (SSI) in 2006:
- Total number of recipients: 369
- Number of aged recipients: 37
- Number of blind and disabled recipients: 332
- Number of recipients under 18: 45
- Number of recipients between 18 and 64: 232
- Number of recipients older than 64: 92
- Number of recipients also receiving OASDI: 143
- Amount of payments (thousands of dollars): 172
| Businesses in Fulton County, PA | ||||
| Name | Count | Name | Count | |
|---|---|---|---|---|
| Decora Cabinetry | 1 | McDonald's | 1 | |
| Giant | 1 | Sprint Nextel | 1 | |
| H&R Block | 2 | True Value | 1 | |
| Jones New York | 1 | UPS | 1 | |
| MasterBrand Cabinets | 1 | |||
Fulton County on our top lists:
- #60 on the list of "Top 101 counties with the lowest total withdrawal of fresh water for public supply"
- #91 on the list of "Top 101 counties with the lowest percentage of residents relocating from other counties between 2010 and 2011"