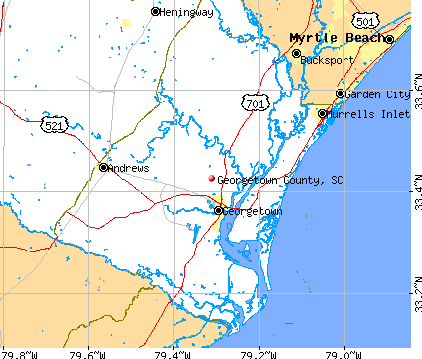
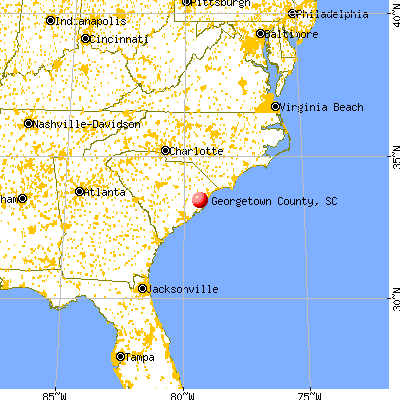
Georgetown County, South Carolina (SC)
County owner-occupied free and clear houses and condos in 2010: 7,863
County owner-occupied houses and condos in 2000: 17,606
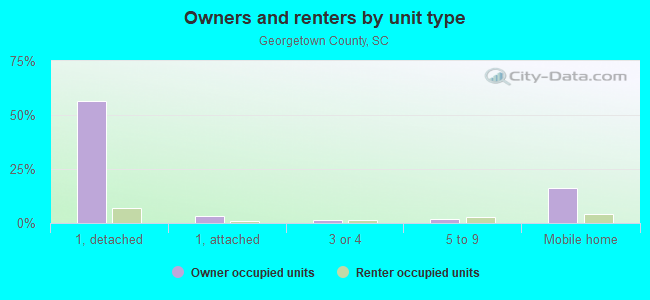
Renter-occupied apartments: 5,447 (it was 4,053 in 2000)
| % of renters here: | 19% |
| State: | 31% |
Land area: 815 sq. mi.
Water area: 220.2 sq. mi.
Population density: 80 people per square mile (average).
Industries providing employment: Educational, health and social services (25.4%), Arts, entertainment, recreation, accommodation and food services (12.6%), Professional, scientific, management, administrative, and waste management services (12.5%), Retail trade (12.1%).
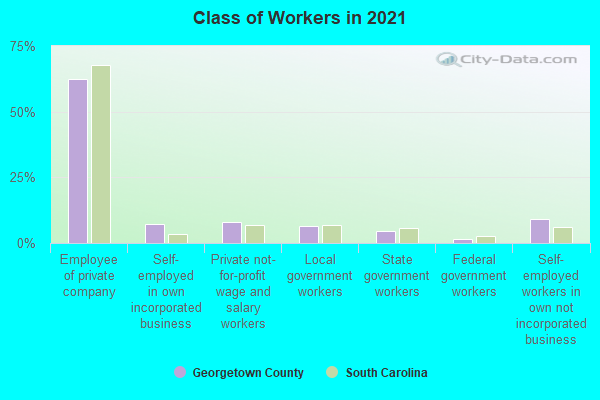
Type of workers:
- Private wage or salary: 75%
- Government: 15%
- Self-employed, not incorporated: 9%
- Unpaid family work: 1%
- OSM Map
- General Map
- Google Map
- MSN Map

- 42,45765.6%White Non-Hispanic Alone
- 18,63328.8%Black Non-Hispanic Alone
- 2,2183.4%Hispanic or Latino
- 1,0181.6%Two or more races
- 3090.5%Asian alone
- 1160.2%American Indian and Alaska Native alone

| Median resident age: | 51.6 years |
| South Carolina median age: | 40.5 years |
| Males: 31,264 | |
| Females: 34,059 |

 | Out-of-market OTA TV reception in Columbia area? (60 replies) |
| One More ? Taxes Horry/Georgetown County (7 replies) |
| Relocating to South Carolina from Iowa (5 replies) |
| County Deletions on Another Site that Rhymes with Beddit (15 replies) |
| Do you regret your move to Murrells Inlet/Garden City/Surfside (9 replies) |
| Kiawah Island or Hilton Head? (21 replies) |
| Georgetown County: | 2.0 people |
| South Carolina: | 2 people |
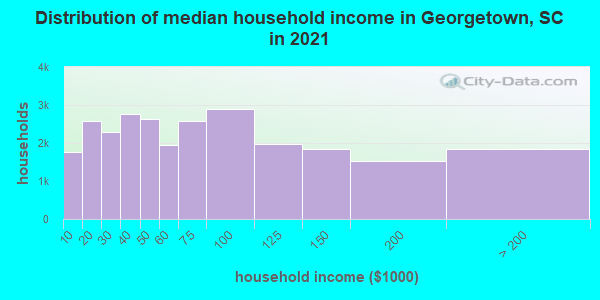
Estimated median household income in 2022: $60,244 ($35,312 in 1999)
| This county: | $60,244 |
| South Carolina: | $64,115 |
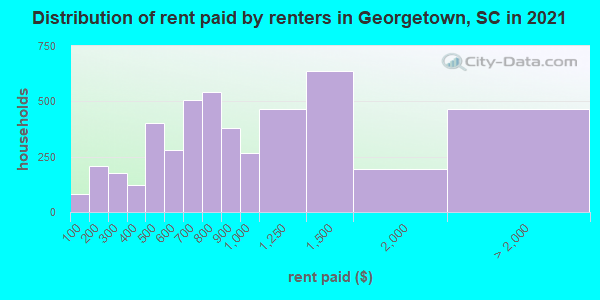
Median contract rent in 2022 for apartments: $793 (lower quartile is $557, upper quartile is $1,294)
| This county: | $793 |
| State: | $893 |
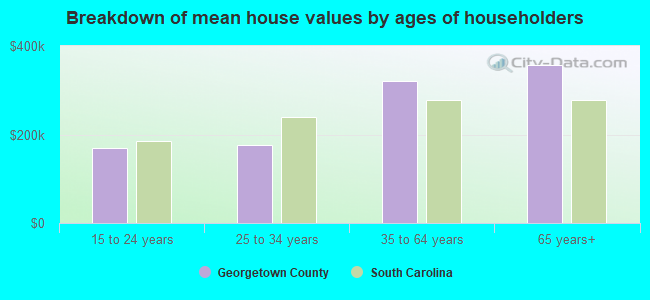
Estimated median house or condo value in 2022: $276,268 (it was $83,700 in 2000)
| Georgetown: | $276,268 |
| South Carolina: | $254,600 |
Mean price in 2022:
Median monthly housing costs for homes and condos with a mortgage: $1,410Detached houses: $451,381
Here: $451,381 State: $368,255 Townhouses or other attached units: $237,430
Here: $237,430 State: $292,023 In 2-unit structures: $869,059
Here: $869,059 State: $358,283 In 3-to-4-unit structures: $234,512
Here: $234,512 State: $230,702 In 5-or-more-unit structures: $183,731
Here: $183,731 State: $326,361 Mobile homes: $71,440
Here: $71,440 State: $102,531
Median monthly housing costs for units without a mortgage: $472
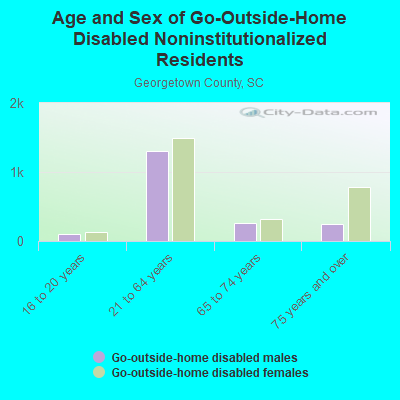
Institutionalized population: 441
Crime in 2021 (reported by the sheriff's office or county police, not the county total):
- Murders: 8
- Rapes: 19
- Robberies: 5
- Assaults: 122
- Burglaries: 128
- Thefts: 487
- Auto thefts: 92
Crime in 2020 (reported by the sheriff's office or county police, not the county total):
- Murders: 1
- Rapes: 11
- Robberies: 14
- Assaults: 146
- Burglaries: 154
- Thefts: 581
- Auto thefts: 65
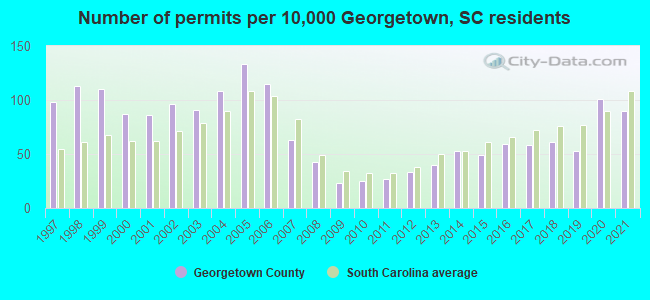
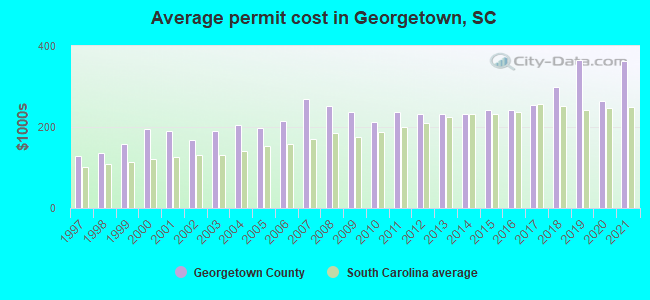
Single-family new house construction building permits:
- 2022: 363 buildings, average cost: $511,400
- 2021: 502 buildings, average cost: $361,900
- 2020: 563 buildings, average cost: $262,700
- 2019: 295 buildings, average cost: $366,300
- 2018: 339 buildings, average cost: $297,700
- 2017: 323 buildings, average cost: $254,800
- 2016: 330 buildings, average cost: $241,200
- 2015: 273 buildings, average cost: $243,000
- 2014: 296 buildings, average cost: $233,000
- 2013: 222 buildings, average cost: $231,900
- 2012: 182 buildings, average cost: $230,900
- 2011: 149 buildings, average cost: $238,100
- 2010: 140 buildings, average cost: $212,100
- 2009: 129 buildings, average cost: $238,000
- 2008: 239 buildings, average cost: $250,900
- 2007: 353 buildings, average cost: $269,800
- 2006: 642 buildings, average cost: $216,400
- 2005: 740 buildings, average cost: $197,900
- 2004: 604 buildings, average cost: $204,600
- 2003: 508 buildings, average cost: $190,100
- 2002: 537 buildings, average cost: $169,100
- 2001: 478 buildings, average cost: $191,400
- 2000: 483 buildings, average cost: $194,900
- 1999: 613 buildings, average cost: $157,900
- 1998: 632 buildings, average cost: $137,300
- 1997: 546 buildings, average cost: $129,100
Median real estate property taxes paid for housing units with mortgages in 2022: $1,282 (0.4%)
Median real estate property taxes paid for housing units with no mortgage in 2022: $917 (0.4%)

| Georgetown County: | 15.6% |
| South Carolina: | 14.0% |
Median age of residents in 2022: 51.6 years old
(Males: 49.5 years old, Females: 53.4 years old)
(Median age for: White residents: 57.5 years old, Black residents: 42.8 years old, American Indian residents: 37.2 years old, Asian residents: 28.5 years old, Hispanic or Latino residents: 29.0 years old, Other race residents: 22.3 years old)
Fair market rent in 2006 for a 1-bedroom apartment in Georgetown County is $472 a month.
Fair market rent for a 2-bedroom apartment is $569 a month.
Fair market rent for a 3-bedroom apartment is $737 a month.
Cities in this county include: Waccamaw, Georgetown, Murrells Inlet, Pleasant Hill-Folly Grove, Sampit-Santee, Plantersville, Pawleys Island.
Neighboring counties: Charleston County  , Franklin County, Alabama
  , Nowata County, Oklahoma
  , McDuffie County, Georgia , Harrison County, Texas , Schley County, Georgia
  .
.
| Here: | 3.6% |
| South Carolina: | 3.1% |

Current college students: 1,500
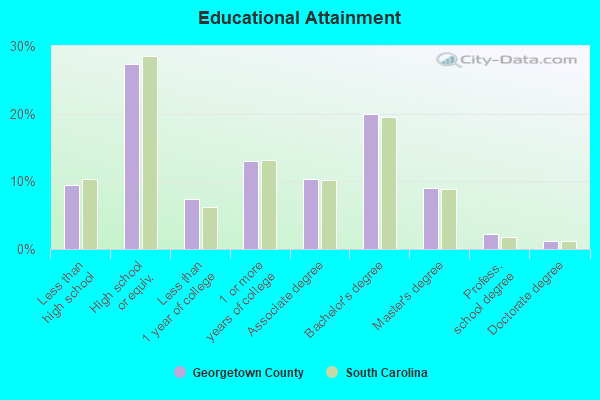
People 25 years of age or older with a high school degree or higher: 90.9%
People 25 years of age or older with a bachelor's degree or higher: 31.0%
Number of foreign born residents: 1,973 (65.3% naturalized citizens)
| Georgetown County: | 3.0% |
| Whole state: | 5.2% |
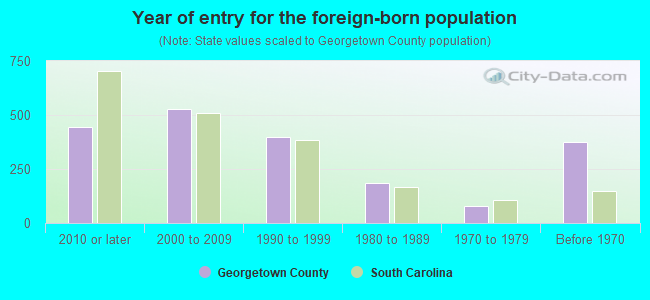
- Year of entry for the foreign-born population
- 5282010 or later
- 4292000 to 2009
- 2381990 to 1999
- 1851980 to 1989
- 801970 to 1979
- 377Before 1970
Mean travel time to work (commute): minutes
Percentage of county residents living and working in this county: 98.7%
Housing units in structures:
- One, detached: 22,853
- One, attached: 2,671
- Two: 429
- 3 or 4: 1,642
- 5 to 9: 1,705
- 10 to 19: 589
- 20 to 49: 900
- 50 or more: 320
- Mobile homes: 6,513
- Boats, RVs, vans, etc.: 12
Housing units in Georgetown County with a mortgage: 11,284 (682 second mortgage, 2 home equity loan, 589 both second mortgage and home equity loan)
Houses without a mortgage: 237
| Here: | 4.4% with mortgage |
| State: | 97.3% with mortgage |
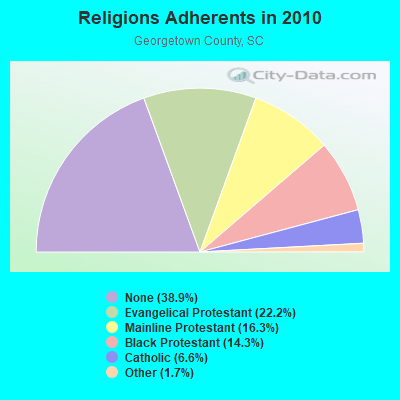
Religion statistics for Georgetown County
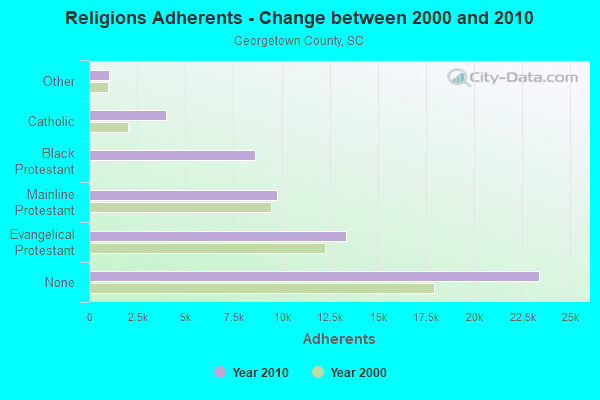
| Religion | Adherents | Congregations |
|---|---|---|
| Evangelical Protestant | 13,340 | 77 |
| Mainline Protestant | 9,784 | 22 |
| Black Protestant | 8,614 | 38 |
| Catholic | 3,990 | 3 |
| Other | 1,031 | 5 |
| None | 23,399 | - |
Source: Clifford Grammich, Kirk Hadaway, Richard Houseal, Dale E.Jones, Alexei Krindatch, Richie Stanley and Richard H.Taylor. 2012. 2010 U.S.Religion Census: Religious Congregations & Membership Study. Association of Statisticians of American Religious Bodies. Jones, Dale E., et al. 2002. Congregations and Membership in the United States 2000. Nashville, TN: Glenmary Research Center.
Food Environment Statistics:
| Georgetown County: | 2.32 / 10,000 pop. |
| State: | 1.99 / 10,000 pop. |
| Here: | 0.17 / 10,000 pop. |
| South Carolina: | 0.15 / 10,000 pop. |
| This county: | 0.66 / 10,000 pop. |
| South Carolina: | 0.85 / 10,000 pop. |
| Georgetown County: | 5.46 / 10,000 pop. |
| South Carolina: | 5.38 / 10,000 pop. |
| This county: | 13.41 / 10,000 pop. |
| State: | 7.75 / 10,000 pop. |
| Georgetown County: | 12.1% |
| South Carolina: | 10.6% |
| Georgetown County: | 30.3% |
| State: | 29.4% |
| Here: | 11.3% |
| State: | 13.4% |
Agriculture in Georgetown County:
Average size of farms: 242 acresAverage value of agricultural products sold per farm: $105,939
Average value of crops sold per acre for harvested cropland: $2526.45
The value of nursery, greenhouse, floriculture, and sod as a percentage of the total market value of agricultural products sold: 79.95%
The value of livestock, poultry, and their products as a percentage of the total market value of agricultural products sold: 8.25%
Average total farm production expenses per farm: $98,967
Harvested cropland as a percentage of land in farms: 15.90%
Average market value of all machinery and equipment per farm: $57,955
The percentage of farms operated by a family or individual: 88.94%
Average age of principal farm operators: 58 years
Average number of cattle and calves per 100 acres of all land in farms: 2.51
Corn for grain: 1885 harvested acres
All wheat for grain: 293 harvested acres
Upland cotton: 644 harvested acres
Soybeans for beans: 2876 harvested acres
Land in orchards: 44 acres
Earthquake activity:
Georgetown County-area historical earthquake activity is significantly above South Carolina state average. It is 54% smaller than the overall U.S. average.On 11/22/1974 at 05:25:55, a magnitude 4.7 (4.7 MB, Class: Light, Intensity: IV - V) earthquake occurred 60.3 miles away from Georgetown County center
On 8/23/2011 at 17:51:04, a magnitude 5.8 (5.8 MW, Depth: 3.7 mi, Class: Moderate, Intensity: VI - VII) earthquake occurred 319.8 miles away from the county center
On 8/21/1992 at 16:31:55, a magnitude 4.4 (4.1 MB, 4.1 LG, 4.4 LG, Depth: 6.2 mi) earthquake occurred 53.2 miles away from the county center
On 8/2/1974 at 08:52:09, a magnitude 4.9 (4.3 MB, 4.9 LG) earthquake occurred 185.4 miles away from the county center
On 8/9/2020 at 12:07:37, a magnitude 5.1 (5.1 MW, Depth: 4.7 mi) earthquake occurred 233.9 miles away from Georgetown County center
On 4/17/1995 at 13:45:57, a magnitude 3.9 (3.9 LG, Depth: 6.2 mi, Class: Light, Intensity: II - III) earthquake occurred 54.7 miles away from the county center
Magnitude types: regional Lg-wave magnitude (LG), body-wave magnitude (MB), moment magnitude (MW)
Most recent natural disasters:
- South Carolina Severe Storms, Tornadoes, And Straight-line Winds, Incident Period: April 12, 2020 - April 13, 2020, FEMA Id: 4542, Natural disaster type: Storm, Tornado, Wind
- South Carolina Covid-19 Pandemic, Incident Period: January 20, 2020, FEMA Id: 4492, Natural disaster type: Other
- South Carolina Hurricane Dorian, Incident Period: August 31, 2019 - September 6, 2019, FEMA Id: 4464, Natural disaster type: Hurricane
- South Carolina Hurricane Florence, Incident Period: September 8, 2018 - October 8, 2018, FEMA Id: 4394, Natural disaster type: Hurricane
- South Carolina Hurricane Irma, Incident Period: September 6, 2017 - September 13, 2017, FEMA Id: 4346, Natural disaster type: Hurricane
- South Carolina Hurricane Matthew, Incident Period: October 04, 2016 to October 30, 2016, Emergency Declared EM-3378: October 06, 2016, FEMA Id: 3378, Natural disaster type: Hurricane
- South Carolina Hurricane Matthew, Incident Period: October 04, 2016 to October 30, 2016, Major Disaster (Presidential) Declared DR-4286: October 11, 2016, FEMA Id: 4286, Natural disaster type: Hurricane
- South Carolina Severe Storms and Flooding, Incident Period: October 01, 2015 to October 23, 2015, Emergency Declared EM-3373: October 03, 2015, FEMA Id: 3373, Natural disaster type: Storm, Flood
- South Carolina Severe Storms and Flooding, Incident Period: October 01, 2015 to October 23, 2015, Major Disaster (Presidential) Declared DR-4241: October 05, 2015, FEMA Id: 4241, Natural disaster type: Storm, Flood
- South Carolina Severe Winter Storm, Incident Period: February 10, 2014 to February 19, 2014, Emergency Declared EM-3369: February 12, 2014, FEMA Id: 3369, Natural disaster type: Winter Storm
- 9 other natural disasters have been reported since 1953.
The number of natural disasters in Georgetown County (19) is greater than the US average (15).
Major Disasters (Presidential) Declared: 9
Emergencies Declared: 5
Causes of natural disasters: Hurricanes: 11, Storms: 3, Winter Storms: 3, Floods: 2, Tornado: 1, Tropical Storm: 1, Wind: 1, Other: 1 (Note: some incidents may be assigned to more than one category).
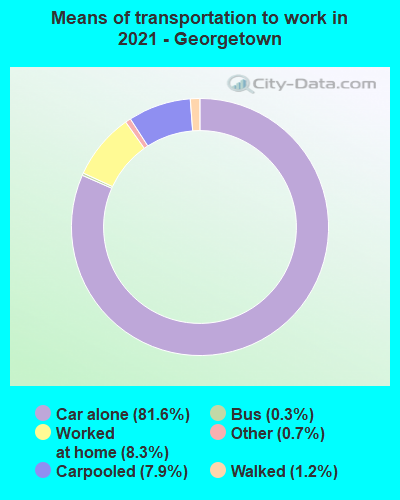
Means of transportation to work:
- Drove a car alone: 19,562 (75.6%)
- Carpooled: 2,592 (10.0%)
- Bus: 20 (0.1%)
- Taxicab, motorcycle, or other means: 194 (0.8%)
- Bicycle: 16 (0.1%)
- Walked: 307 (1.2%)
- Worked at home: 3,252 (12.6%)
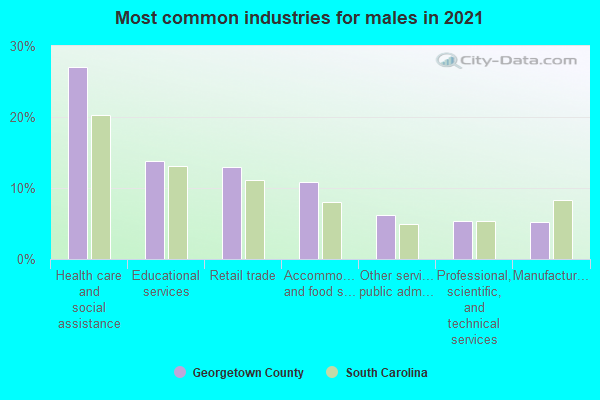
- Health care and social assistance (28%)
- Educational services (14%)
- Retail trade (12%)
- Accommodation and food services (11%)
- Administrative and support and waste management services (6%)
- Other services, except public administration (6%)
- Professional, scientific, and technical services (6%)

- Health care and social assistance (28%)
- Educational services (13%)
- Retail trade (12%)
- Accommodation and food services (11%)
- Administrative and support and waste management services (6%)
- Other services, except public administration (6%)
- Professional, scientific, and technical services (5%)
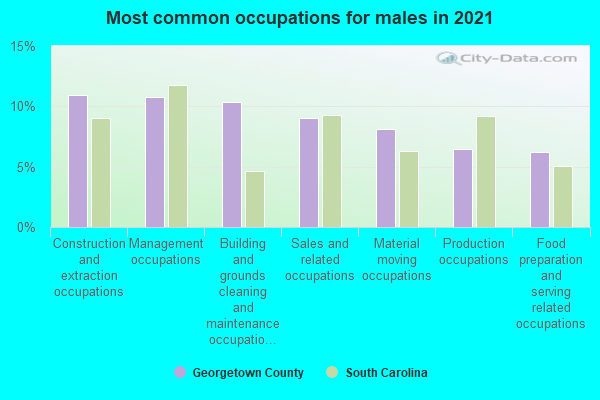
- Management occupations (10%)
- Sales and related occupations (10%)
- Building and grounds cleaning and maintenance occupations (9%)
- Construction and extraction occupations (8%)
- Food preparation and serving related occupations (8%)
- Material moving occupations (8%)
- Production occupations (7%)
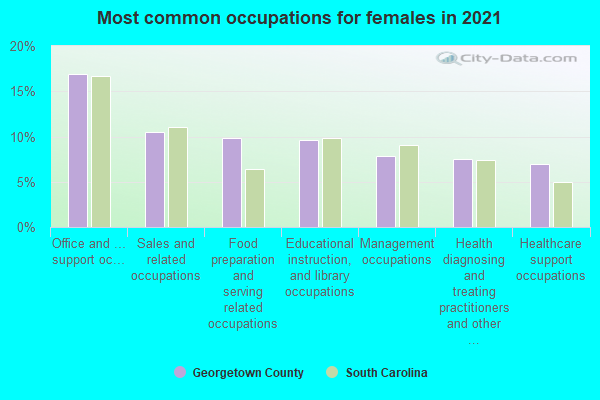
- Office and administrative support occupations (17%)
- Educational instruction, and library occupations (12%)
- Sales and related occupations (11%)
- Food preparation and serving related occupations (8%)
- Management occupations (8%)
- Healthcare support occupations (8%)
- Health diagnosing and treating practitioners and other technical occupations (7%)
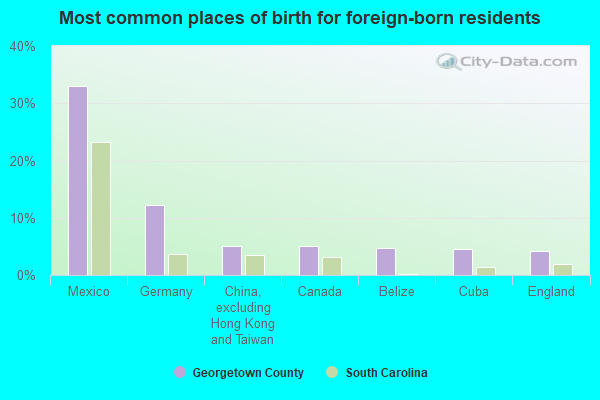
- Mexico (20%)
- Cuba (11%)
- Germany (11%)
- Cameroon (8%)
- England (7%)
- Greece (4%)
- China, excluding Hong Kong and Taiwan (4%)
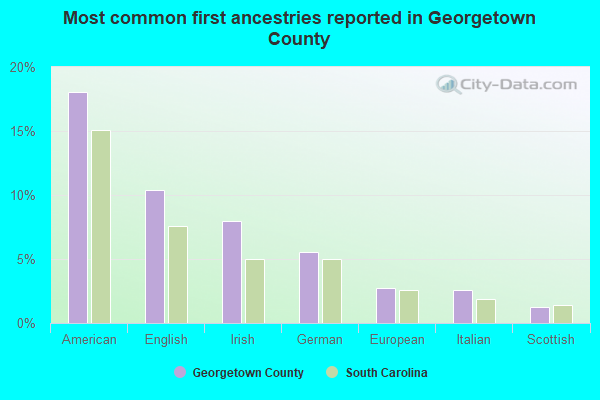
- American (19%)
- English (10%)
- Irish (8%)
- German (5%)
- Italian (3%)
- European (3%)
- Scottish (2%)
People in group quarters in Georgetown County, South Carolina in 2010:
- 217 people in local jails and other municipal confinement facilities
- 173 people in nursing facilities/skilled-nursing facilities
- 95 people in other noninstitutional facilities
- 34 people in correctional facilities intended for juveniles
- 13 people in residential treatment centers for juveniles (non-correctional)
- 12 people in group homes intended for adults
- 6 people in college/university student housing
- 5 people in workers' group living quarters and job corps centers
- 3 people in in-patient hospice facilities
People in group quarters in Georgetown County, South Carolina in 2000:
- 211 people in nursing homes
- 178 people in other noninstitutional group quarters
- 136 people in local jails and other confinement facilities (including police lockups)
- 52 people in unknown juvenile institutions
- 4 people in military barracks, etc.
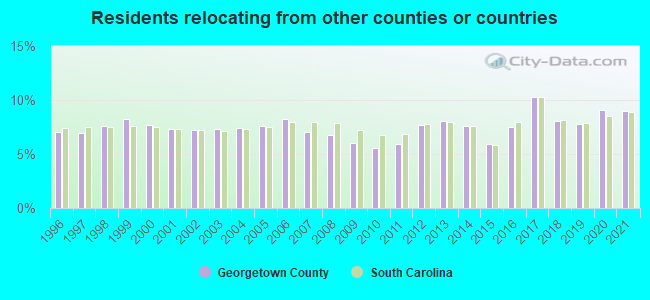
9.01% of this county's 2021 resident taxpayers lived in other counties in 2020 ($117,607 average adjusted gross income)
| Here: | 9.01% |
| South Carolina average: | 8.89% |
10 or fewer of this county's residents moved from foreign countries.
4.04% relocated from other counties in South Carolina ($49,215 average AGI)
4.97% relocated from other states ($68,392 average AGI)
Georgetown County: 4.97% South Carolina average: 4.96%
Top counties from which taxpayers relocated into this county between 2020 and 2021:
| from Horry County, SC | |
| from Charleston County, SC | |
| from Williamsburg County, SC | |
| from Florence County, SC | |
| from Mecklenburg County, NC | |
| from Berkeley County, SC | |
| from Richland County, SC |
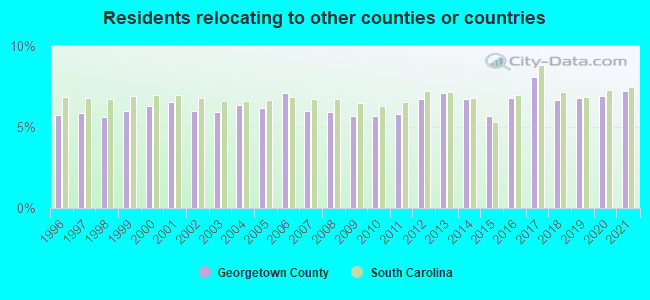
7.20% of this county's 2020 resident taxpayers moved to other counties in 2021 ($67,485 average adjusted gross income)
| Here: | 7.20% |
| South Carolina average: | 7.46% |
10 or fewer of this county's residents moved to foreign countries.
4.33% relocated to other counties in South Carolina ($37,126 average AGI)
2.87% relocated to other states ($30,360 average AGI)
Georgetown County: 2.87% South Carolina average: 3.47%
Top counties to which taxpayers relocated from this county between 2020 and 2021:
| to Horry County, SC | |
| to Williamsburg County, SC | |
| to Charleston County, SC | |
| to Richland County, SC | |
| to Berkeley County, SC | |
| to Florence County, SC | |
| to Greenville County, SC |
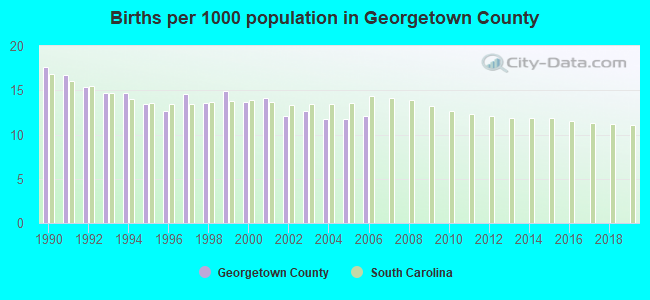
Births per 1000 population from 1990 to 1999: 14.8
Births per 1000 population from 2000 to 2006: 12.6
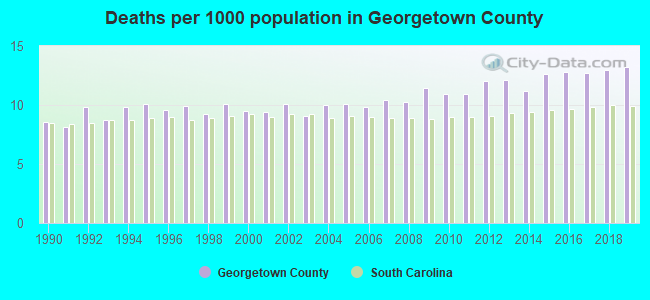
Deaths per 1000 population from 1990 to 1999: 9.4
Deaths per 1000 population from 2000 to 2009: 10.0
Deaths per 1000 population from 2010 to 2020: 12.5
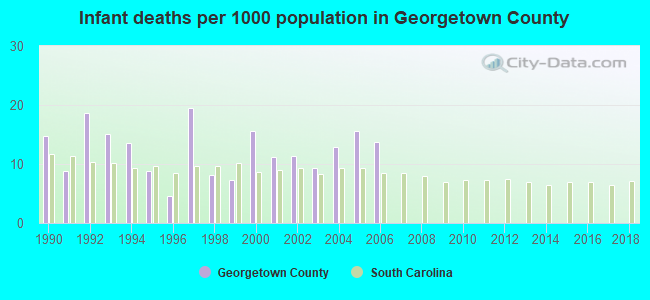
Infant deaths per 1000 live births from 1990 to 1999: 11.9
Infant deaths per 1000 live births from 2000 to 2006: 12.8
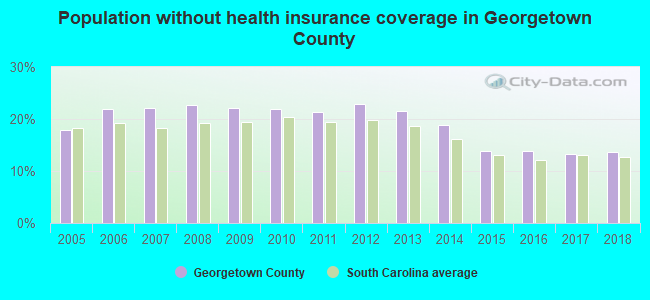
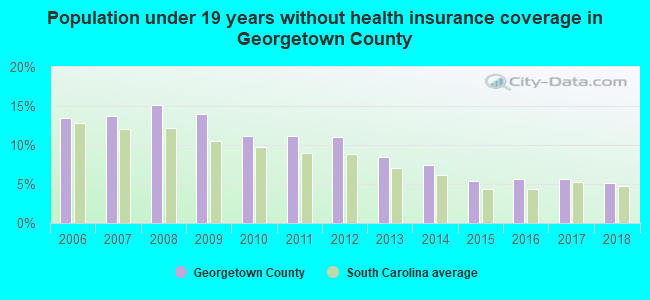
Persons under 19 years old without health insurance coverage in 2018: 5.1%
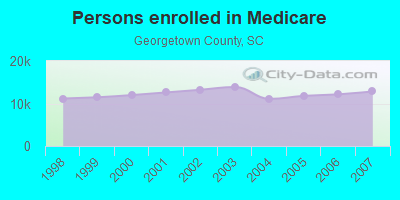
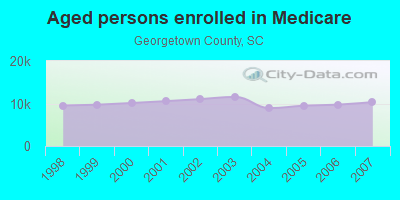
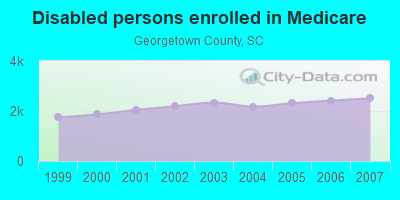
Persons enrolled in hospital insurance and/or supplemental medical insurance (Medicare) in July 1, 2007: 12,833 (10,327 aged, 2,506 disabled)
Children under 18 without health insurance coverage in 2007: 1,813 (13%)
Most common underlying causes of death in Georgetown County, South Carolina in 1999 - 2019:
- Bronchus or lung, unspecified - Malignant neoplasms (956)
- Acute myocardial infarction, unspecified (921)
- Atherosclerotic heart disease (742)
- Chronic obstructive pulmonary disease, unspecified (570)
- Alzheimer disease, unspecified (506)
- Stroke, not specified as haemorrhage or infarction (483)
- Unspecified dementia (383)
- Atherosclerotic cardiovascular disease, so described (154)
- Breast, unspecified - Malignant neoplasms (145)
- Colon, unspecified - Malignant neoplasms (136)
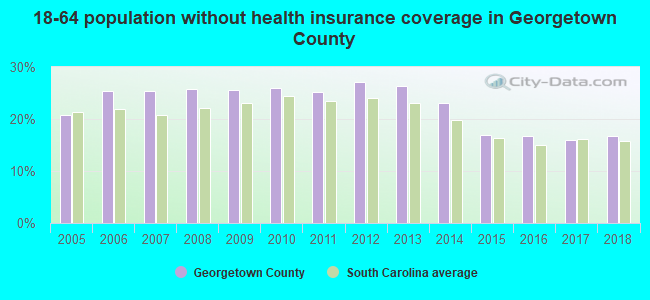
Population without health insurance coverage in 2000: 17%
Children under 18 without health insurance coverage in 2000: 14%
Short term general hospital admissions per 100,000 population in 2004: 20,871
Short term general hospital beds per 100,000 population in 2004: 365
Emergency room visits per 100,000 population in 2004: 71,412
General practice office based MDs per 100,000 population in 2005: 1,220
Medical specialist MDs per 100,000 population in 2005: 1,081
Dentists per 100,000 population in 1998: 5
Total births per 100,000 population, July 2005 - July 2006 : 37
Total deaths per 100,000 population, July 2005 - July 2006: 89
Limited-service eating places per 100,000 population in 2005 : 13
Homicides per 1,000,000 population from 2000 to 2006: 51.6. This is less than state average.
Suicides per 1,000,000 population from 2000 to 2006: 68.8. This is less than state average.
Household type by relationship:
Households: 65,323- Male householders: 12,994 (3,178 living alone), Female householders: 14,488 (4,467 living alone)
13,933 spouses (13,821 opposite-sex spouses), 1,282 unmarried partners, (1,240 opposite-sex unmarried partners), 15,963 children (14,768 natural, 264 adopted, 933 stepchildren), 2,995 grandchildren, 887 brothers or sisters, 744 parents, 29 foster children, 935 other relatives, 667 non-relatives
- In group quarters: 628
Size of family households: 11,328 2-persons, 3,981 3-persons, 2,399 4-persons, 962 5-persons, 332 6-persons, 118 7-or-more-persons.
Size of nonfamily households: 7,648 1-person, 788 2-persons, 28 3-persons.
5,069 married couples with children.
3,615 single-parent households (1,105 men, 2,510 women).
97.3% of residents of Georgetown speak English at home.
1.8% of residents speak Spanish at home (59% speak English very well, 29% speak English well, 6% speak English not well, 5% don't speak English at all).
0.9% of residents speak other Indo-European language at home (84% speak English very well, 16% speak English well).
0.5% of residents speak Asian or Pacific Island language at home (85% speak English very well, 13% speak English well, 2% speak English not well).
0.1% of residents speak other language at home (100% speak English very well).
In fiscal year 2004:
Federal Government expenditure: $403,754,000 ($6,753 per capita)
Department of Defense expenditure: $20,657,000
Federal direct payments to individuals for retirement and disability: $233,392,000
Federal other direct payments to individuals: $87,335,000
Federal direct payments not to individuals: $1,302,000
Federal grants: $68,058,000
Federal procurement contracts: $5,373,000 ($2,981,000 Department of Defense)
Federal salaries and wages: $8,294,000 ($638,000 Department of Defense)
Federal Government direct loans: $2,816,000
Federal guaranteed/insured loans: $6,279,000
Federal Government insurance: $1,356,462,000
Population change from April 1, 2000 to July 1, 2005:
Births: 4,052| Here: | 66 per 1000 residents |
| State: | 69 per 1000 residents |
Deaths: 2,905
| Here: | 48 per 1000 residents |
| State: | 46 per 1000 residents |
Net international migration: +305
| Here: | +5 per 1000 residents |
| State: | +9 per 1000 residents |
Net internal migration: +3,854
| Here: | +63 per 1000 residents |
| State: | +27 per 1000 residents |
Total withdrawal of fresh water for public supply: 7.43 millions of gallons per day (41% from ground, 59% from surface)
| Here: | 6.4 |
| State: | 6.4 |
| Here: | 4.7 |
| State: | 4.5 |
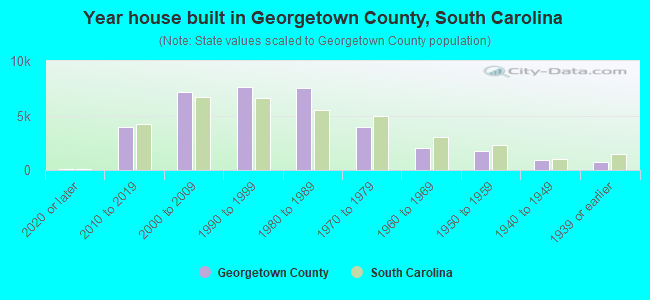
- Year house built in Georgetown County, South Carolina
- 3002020 or later
- 3,8622010 to 2019
- 7,7112000 to 2009
- 7,2351990 to 1999
- 7,5451980 to 1989
- 3,9511970 to 1979
- 2,3411960 to 1969
- 1,5601950 to 1959
- 8401940 to 1949
- 9491939 or earlier
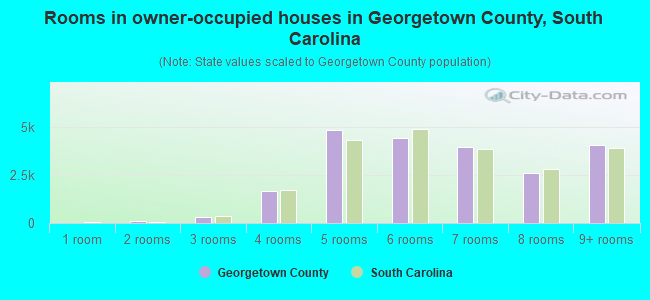
- Rooms in owner-occupied houses in Georgetown County, South Carolina
- 01 room
- 852 rooms
- 2353 rooms
- 1,9174 rooms
- 4,8695 rooms
- 4,8846 rooms
- 3,7797 rooms
- 2,9358 rooms
- 4,0989+ rooms
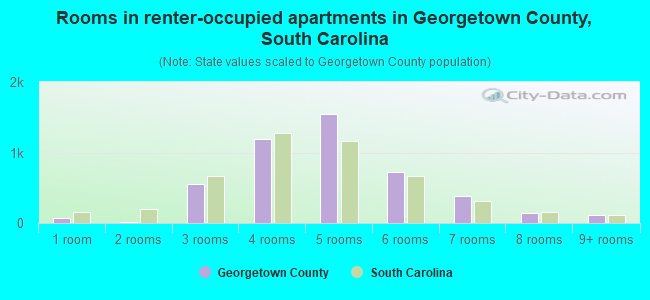
- Rooms in renter-occupied apartments in Georgetown County, South Carolina
- 391 room
- 352 rooms
- 7373 rooms
- 1,4074 rooms
- 1,4915 rooms
- 5956 rooms
- 2637 rooms
- 1108 rooms
- 1279+ rooms
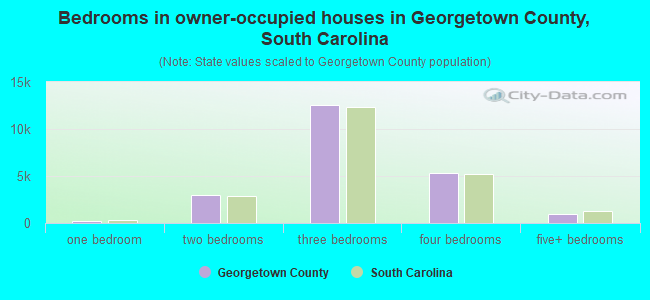
- Bedrooms in owner-occupied houses in Georgetown County, South Carolina
- 8no bedroom
- 1461 bedroom
- 3,4032 bedrooms
- 12,7143 bedrooms
- 5,3214 bedrooms
- 1,1855+ bedrooms
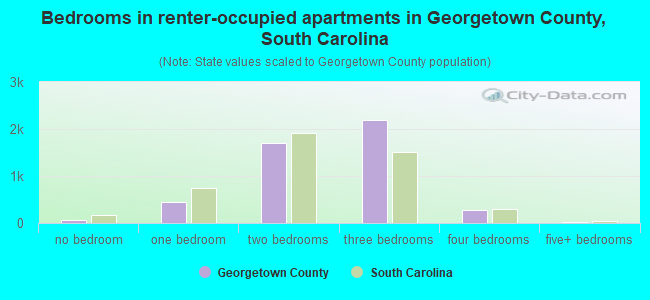
- Bedrooms in renter-occupied apartments in Georgetown County, South Carolina
- 40no bedroom
- 6821 bedroom
- 1,7872 bedrooms
- 2,0563 bedrooms
- 2044 bedrooms
- 385+ bedrooms
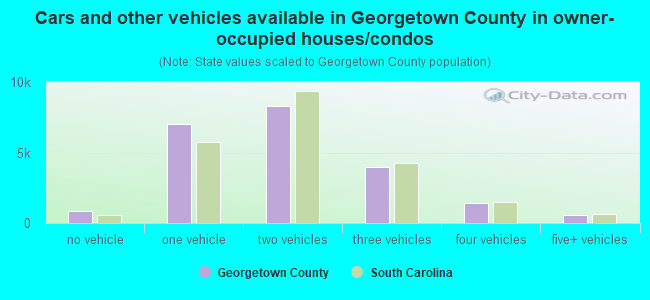
- Cars and other vehicles available in Georgetown County in owner-occupied houses/condos
- 728no vehicle
- 7,3671 vehicle
- 9,0582 vehicles
- 3,8393 vehicles
- 1,1604 vehicles
- 6735+ vehicles
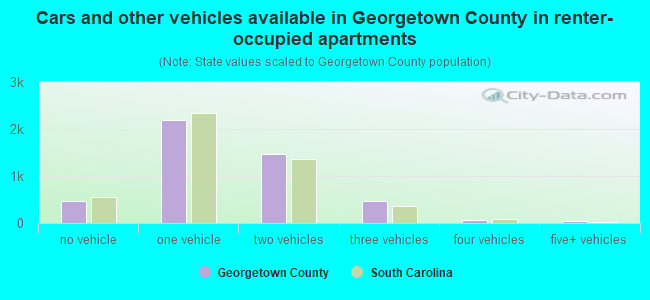
- Cars and other vehicles available in Georgetown County in renter-occupied apartments
- 609no vehicle
- 2,3321 vehicle
- 1,4242 vehicles
- 3333 vehicles
- 614 vehicles
- 635+ vehicles
89.0% of Georgetown County residents lived in the same house 1 years ago.
Out of people who lived in different houses, 24% lived in this county.
Out of people who lived in different counties, 44% lived in South Carolina.
| Georgetown County: | 89.0% |
| State average: | 86.5% |
Place of birth for U.S.-born residents:
- This state: 37,168
- Other state: 25,656
- Northeast: 10,365
- Midwest: 3,994
- South: 10,029
- West: 1,292
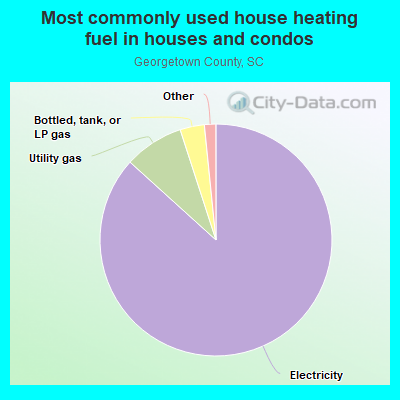
- 86.8%Electricity
- 8.0%Utility gas
- 3.3%Bottled, tank, or LP gas
- 0.8%Fuel oil, kerosene, etc.
- 0.3%No fuel used
- 0.2%Solar energy
- 0.2%Wood
- 0.2%Other fuel
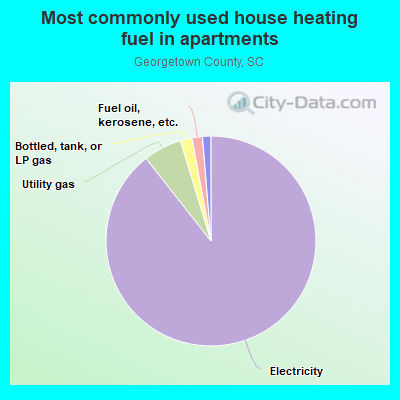
- 88.8%Electricity
- 5.9%Utility gas
- 2.5%Bottled, tank, or LP gas
- 1.3%Fuel oil, kerosene, etc.
- 1.2%No fuel used
- 0.3%Solar energy
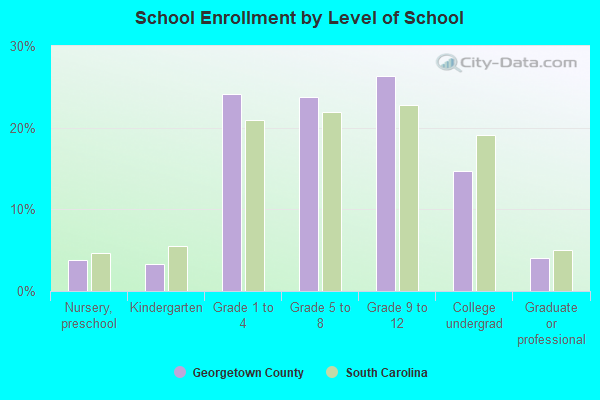
Private vs. public school enrollment:
| Here: | 10.5% |
| South Carolina: | 14.4% |
| Here: | 10.6% |
| South Carolina: | 11.1% |
| Here: | 13.7% |
| South Carolina: | 21.9% |
Georgetown County government finances - Expenditure in 2018:
- Bond Funds - Cash and Securities: $21,934,000
- Charges - Solid Waste Management: $3,729,000
Sewerage: $1,724,000
Air Transportation: $648,000
Parks and Recreation: $138,000
- Construction - Health - Other: $8,147,000
Parks and Recreation: $6,112,000
Regular Highways: $2,194,000
Financial Administration: $1,270,000
Police Protection: $240,000
Local Fire Protection: $18,000
- Current Operations - General - Other: $16,112,000
Financial Administration: $15,508,000
Police Protection: $13,257,000
General - Other: $11,662,000
Police Protection: $10,159,000
Solid Waste Management: $8,293,000
Local Fire Protection: $8,066,000
Solid Waste Management: $5,881,000
Parks and Recreation: $4,724,000
Health - Other: $4,515,000
Health - Other: $4,451,000
Correctional Institutions: $4,008,000
Judicial and Legal Services: $3,835,000
Parks and Recreation: $3,589,000
Financial Administration: $2,708,000
Regular Highways: $2,219,000
Libraries: $2,042,000
Libraries: $1,958,000
General Public Buildings: $1,516,000
Central Staff Services: $1,383,000
Judicial and Legal Services: $825,000
Regular Highways: $777,000
General Public Buildings: $723,000
Sewerage: $712,000
Public Welfare - Other: $578,000
Air Transportation: $363,000
Air Transportation: $217,000
Public Welfare, Vendor Payments for Medical Care: $158,000
Public Welfare - Other: $66,000
Natural Resources - Other: $6,000
- General - Interest on Debt: $3,530,000
Interest on Debt: $2,842,000
- Long Term Debt - Outstanding Unspecified Public Purpose: $174,623,000
Beginning Outstanding - Unspecified Public Purpose: $167,310,000
Beginning Outstanding - Unspecified Public Purpose: $64,703,000
Outstanding Unspecified Public Purpose: $60,731,000
Issue, Unspecified Public Purpose: $49,287,000
Retired Unspecified Public Purpose: $41,974,000
Beginning Outstanding - Public Debt for Private Purpose: $40,050,000
Outstanding Nonguaranteed - Industrial Revenue: $36,969,000
Beginning Outstanding - Public Debt for Private Purpose: $33,888,000
Outstanding Nonguaranteed - Industrial Revenue: $30,807,000
Retired Unspecified Public Purpose: $21,342,000
Issue, Unspecified Public Purpose: $17,370,000
Retired Nonguaranteed - Public Debt for Private Purpose: $3,081,000
Retired Nonguaranteed - Public Debt for Private Purpose: $3,081,000
- Miscellaneous - General Revenue - Other: $4,114,000
Interest Earnings: $1,722,000
General Revenue - Other: $1,134,000
Fines and Forfeits: $606,000
Rents: $605,000
Fines and Forfeits: $515,000
Sale of Property: $346,000
Sale of Property: $257,000
Interest Earnings: $193,000
- Other Capital Outlay - General - Other: $4,143,000
Regular Highways: $1,707,000
Parks and Recreation: $486,000
Solid Waste Management: $139,000
Health - Other: $80,000
Financial Administration: $53,000
Police Protection: $20,000
Judicial and Legal Services: $10,000
Central Staff Services: $10,000
Air Transportation: $9,000
General Public Building: $4,000
- Other Funds - Cash and Securities: $77,905,000
Cash and Securities: $61,441,000
- Short Term Debt Outstanding - Beginning: $13,211,000
End of Fiscal Year: $12,090,000
- Sinking Funds - Cash and Securities: $50,515,000
Cash and Securities: $39,120,000
- State Intergovernmental - Other: $8,799,000
Other: $7,289,000
General Local Government Support: $5,698,000
- Tax - Property: $54,662,000
Property: $43,662,000
Other License: $12,658,000
Other License: $10,805,000
Other Selective Sales: $5,409,000
General Sales and Gross Receipts: $5,015,000
Motor Vehicle License: $1,984,000
Public Utilities Sales: $1,173,000
Occupation and Business License - Other: $9,000
- Total Salaries and Wages: $28,399,000
: $21,504,000
Georgetown County government finances - Revenue in 2018:
- Bond Funds - Cash and Securities: $21,934,000
- Charges - Solid Waste Management: $3,729,000
Sewerage: $1,724,000
Air Transportation: $648,000
Parks and Recreation: $138,000
- Construction - Health - Other: $8,147,000
Parks and Recreation: $6,112,000
Regular Highways: $2,194,000
Financial Administration: $1,270,000
Police Protection: $240,000
Local Fire Protection: $18,000
- Current Operations - General - Other: $16,112,000
Financial Administration: $15,508,000
Police Protection: $13,257,000
General - Other: $11,662,000
Police Protection: $10,159,000
Solid Waste Management: $8,293,000
Local Fire Protection: $8,066,000
Solid Waste Management: $5,881,000
Parks and Recreation: $4,724,000
Health - Other: $4,515,000
Health - Other: $4,451,000
Correctional Institutions: $4,008,000
Judicial and Legal Services: $3,835,000
Parks and Recreation: $3,589,000
Financial Administration: $2,708,000
Regular Highways: $2,219,000
Libraries: $2,042,000
Libraries: $1,958,000
General Public Buildings: $1,516,000
Central Staff Services: $1,383,000
Judicial and Legal Services: $825,000
Regular Highways: $777,000
General Public Buildings: $723,000
Sewerage: $712,000
Public Welfare - Other: $578,000
Air Transportation: $363,000
Air Transportation: $217,000
Public Welfare, Vendor Payments for Medical Care: $158,000
Public Welfare - Other: $66,000
Natural Resources - Other: $6,000
- General - Interest on Debt: $3,530,000
Interest on Debt: $2,842,000
- Long Term Debt - Outstanding Unspecified Public Purpose: $174,623,000
Beginning Outstanding - Unspecified Public Purpose: $167,310,000
Beginning Outstanding - Unspecified Public Purpose: $64,703,000
Outstanding Unspecified Public Purpose: $60,731,000
Issue, Unspecified Public Purpose: $49,287,000
Retired Unspecified Public Purpose: $41,974,000
Beginning Outstanding - Public Debt for Private Purpose: $40,050,000
Outstanding Nonguaranteed - Industrial Revenue: $36,969,000
Beginning Outstanding - Public Debt for Private Purpose: $33,888,000
Outstanding Nonguaranteed - Industrial Revenue: $30,807,000
Retired Unspecified Public Purpose: $21,342,000
Issue, Unspecified Public Purpose: $17,370,000
Retired Nonguaranteed - Public Debt for Private Purpose: $3,081,000
Retired Nonguaranteed - Public Debt for Private Purpose: $3,081,000
- Miscellaneous - General Revenue - Other: $4,114,000
Interest Earnings: $1,722,000
General Revenue - Other: $1,134,000
Fines and Forfeits: $606,000
Rents: $605,000
Fines and Forfeits: $515,000
Sale of Property: $346,000
Sale of Property: $257,000
Interest Earnings: $193,000
- Other Capital Outlay - General - Other: $4,143,000
Regular Highways: $1,707,000
Parks and Recreation: $486,000
Solid Waste Management: $139,000
Health - Other: $80,000
Financial Administration: $53,000
Police Protection: $20,000
Judicial and Legal Services: $10,000
Central Staff Services: $10,000
Air Transportation: $9,000
General Public Building: $4,000
- Other Funds - Cash and Securities: $77,905,000
Cash and Securities: $61,441,000
- Short Term Debt Outstanding - Beginning: $13,211,000
End of Fiscal Year: $12,090,000
- Sinking Funds - Cash and Securities: $50,515,000
Cash and Securities: $39,120,000
- State Intergovernmental - Other: $8,799,000
Other: $7,289,000
General Local Government Support: $5,698,000
- Tax - Property: $54,662,000
Property: $43,662,000
Other License: $12,658,000
Other License: $10,805,000
Other Selective Sales: $5,409,000
General Sales and Gross Receipts: $5,015,000
Motor Vehicle License: $1,984,000
Public Utilities Sales: $1,173,000
Occupation and Business License - Other: $9,000
- Total Salaries and Wages: $28,399,000
: $21,504,000
Georgetown County government finances - Debt in 2018:
- Bond Funds - Cash and Securities: $21,934,000
- Charges - Solid Waste Management: $3,729,000
Sewerage: $1,724,000
Air Transportation: $648,000
Parks and Recreation: $138,000
- Construction - Health - Other: $8,147,000
Parks and Recreation: $6,112,000
Regular Highways: $2,194,000
Financial Administration: $1,270,000
Police Protection: $240,000
Local Fire Protection: $18,000
- Current Operations - General - Other: $16,112,000
Financial Administration: $15,508,000
Police Protection: $13,257,000
General - Other: $11,662,000
Police Protection: $10,159,000
Solid Waste Management: $8,293,000
Local Fire Protection: $8,066,000
Solid Waste Management: $5,881,000
Parks and Recreation: $4,724,000
Health - Other: $4,515,000
Health - Other: $4,451,000
Correctional Institutions: $4,008,000
Judicial and Legal Services: $3,835,000
Parks and Recreation: $3,589,000
Financial Administration: $2,708,000
Regular Highways: $2,219,000
Libraries: $2,042,000
Libraries: $1,958,000
General Public Buildings: $1,516,000
Central Staff Services: $1,383,000
Judicial and Legal Services: $825,000
Regular Highways: $777,000
General Public Buildings: $723,000
Sewerage: $712,000
Public Welfare - Other: $578,000
Air Transportation: $363,000
Air Transportation: $217,000
Public Welfare, Vendor Payments for Medical Care: $158,000
Public Welfare - Other: $66,000
Natural Resources - Other: $6,000
- General - Interest on Debt: $3,530,000
Interest on Debt: $2,842,000
- Long Term Debt - Outstanding Unspecified Public Purpose: $174,623,000
Beginning Outstanding - Unspecified Public Purpose: $167,310,000
Beginning Outstanding - Unspecified Public Purpose: $64,703,000
Outstanding Unspecified Public Purpose: $60,731,000
Issue, Unspecified Public Purpose: $49,287,000
Retired Unspecified Public Purpose: $41,974,000
Beginning Outstanding - Public Debt for Private Purpose: $40,050,000
Outstanding Nonguaranteed - Industrial Revenue: $36,969,000
Beginning Outstanding - Public Debt for Private Purpose: $33,888,000
Outstanding Nonguaranteed - Industrial Revenue: $30,807,000
Retired Unspecified Public Purpose: $21,342,000
Issue, Unspecified Public Purpose: $17,370,000
Retired Nonguaranteed - Public Debt for Private Purpose: $3,081,000
Retired Nonguaranteed - Public Debt for Private Purpose: $3,081,000
- Miscellaneous - General Revenue - Other: $4,114,000
Interest Earnings: $1,722,000
General Revenue - Other: $1,134,000
Fines and Forfeits: $606,000
Rents: $605,000
Fines and Forfeits: $515,000
Sale of Property: $346,000
Sale of Property: $257,000
Interest Earnings: $193,000
- Other Capital Outlay - General - Other: $4,143,000
Regular Highways: $1,707,000
Parks and Recreation: $486,000
Solid Waste Management: $139,000
Health - Other: $80,000
Financial Administration: $53,000
Police Protection: $20,000
Judicial and Legal Services: $10,000
Central Staff Services: $10,000
Air Transportation: $9,000
General Public Building: $4,000
- Other Funds - Cash and Securities: $77,905,000
Cash and Securities: $61,441,000
- Short Term Debt Outstanding - Beginning: $13,211,000
End of Fiscal Year: $12,090,000
- Sinking Funds - Cash and Securities: $50,515,000
Cash and Securities: $39,120,000
- State Intergovernmental - Other: $8,799,000
Other: $7,289,000
General Local Government Support: $5,698,000
- Tax - Property: $54,662,000
Property: $43,662,000
Other License: $12,658,000
Other License: $10,805,000
Other Selective Sales: $5,409,000
General Sales and Gross Receipts: $5,015,000
Motor Vehicle License: $1,984,000
Public Utilities Sales: $1,173,000
Occupation and Business License - Other: $9,000
- Total Salaries and Wages: $28,399,000
: $21,504,000
Georgetown County government finances - Cash and Securities in 2018:
- Bond Funds - Cash and Securities: $21,934,000
- Charges - Solid Waste Management: $3,729,000
Sewerage: $1,724,000
Air Transportation: $648,000
Parks and Recreation: $138,000
- Construction - Health - Other: $8,147,000
Parks and Recreation: $6,112,000
Regular Highways: $2,194,000
Financial Administration: $1,270,000
Police Protection: $240,000
Local Fire Protection: $18,000
- Current Operations - General - Other: $16,112,000
Financial Administration: $15,508,000
Police Protection: $13,257,000
General - Other: $11,662,000
Police Protection: $10,159,000
Solid Waste Management: $8,293,000
Local Fire Protection: $8,066,000
Solid Waste Management: $5,881,000
Parks and Recreation: $4,724,000
Health - Other: $4,515,000
Health - Other: $4,451,000
Correctional Institutions: $4,008,000
Judicial and Legal Services: $3,835,000
Parks and Recreation: $3,589,000
Financial Administration: $2,708,000
Regular Highways: $2,219,000
Libraries: $2,042,000
Libraries: $1,958,000
General Public Buildings: $1,516,000
Central Staff Services: $1,383,000
Judicial and Legal Services: $825,000
Regular Highways: $777,000
General Public Buildings: $723,000
Sewerage: $712,000
Public Welfare - Other: $578,000
Air Transportation: $363,000
Air Transportation: $217,000
Public Welfare, Vendor Payments for Medical Care: $158,000
Public Welfare - Other: $66,000
Natural Resources - Other: $6,000
- General - Interest on Debt: $3,530,000
Interest on Debt: $2,842,000
- Long Term Debt - Outstanding Unspecified Public Purpose: $174,623,000
Beginning Outstanding - Unspecified Public Purpose: $167,310,000
Beginning Outstanding - Unspecified Public Purpose: $64,703,000
Outstanding Unspecified Public Purpose: $60,731,000
Issue, Unspecified Public Purpose: $49,287,000
Retired Unspecified Public Purpose: $41,974,000
Beginning Outstanding - Public Debt for Private Purpose: $40,050,000
Outstanding Nonguaranteed - Industrial Revenue: $36,969,000
Beginning Outstanding - Public Debt for Private Purpose: $33,888,000
Outstanding Nonguaranteed - Industrial Revenue: $30,807,000
Retired Unspecified Public Purpose: $21,342,000
Issue, Unspecified Public Purpose: $17,370,000
Retired Nonguaranteed - Public Debt for Private Purpose: $3,081,000
Retired Nonguaranteed - Public Debt for Private Purpose: $3,081,000
- Miscellaneous - General Revenue - Other: $4,114,000
Interest Earnings: $1,722,000
General Revenue - Other: $1,134,000
Fines and Forfeits: $606,000
Rents: $605,000
Fines and Forfeits: $515,000
Sale of Property: $346,000
Sale of Property: $257,000
Interest Earnings: $193,000
- Other Capital Outlay - General - Other: $4,143,000
Regular Highways: $1,707,000
Parks and Recreation: $486,000
Solid Waste Management: $139,000
Health - Other: $80,000
Financial Administration: $53,000
Police Protection: $20,000
Judicial and Legal Services: $10,000
Central Staff Services: $10,000
Air Transportation: $9,000
General Public Building: $4,000
- Other Funds - Cash and Securities: $77,905,000
Cash and Securities: $61,441,000
- Short Term Debt Outstanding - Beginning: $13,211,000
End of Fiscal Year: $12,090,000
- Sinking Funds - Cash and Securities: $50,515,000
Cash and Securities: $39,120,000
- State Intergovernmental - Other: $8,799,000
Other: $7,289,000
General Local Government Support: $5,698,000
- Tax - Property: $54,662,000
Property: $43,662,000
Other License: $12,658,000
Other License: $10,805,000
Other Selective Sales: $5,409,000
General Sales and Gross Receipts: $5,015,000
Motor Vehicle License: $1,984,000
Public Utilities Sales: $1,173,000
Occupation and Business License - Other: $9,000
- Total Salaries and Wages: $28,399,000
: $21,504,000
Supplemental Security Income (SSI) in 2006:
- Total number of recipients: 1,552
- Number of aged recipients: 168
- Number of blind and disabled recipients: 1,384
- Number of recipients under 18: 272
- Number of recipients between 18 and 64: 905
- Number of recipients older than 64: 375
- Number of recipients also receiving OASDI: 633
- Amount of payments (thousands of dollars): 588
| Most common first names in Georgetown County, SC among deceased individuals | ||
| Name | Count | Lived (average) |
|---|---|---|
| James | 360 | 71.0 years |
| John | 335 | 72.6 years |
| William | 328 | 73.5 years |
| Mary | 310 | 77.5 years |
| Robert | 219 | 69.9 years |
| Charles | 144 | 73.4 years |
| Joseph | 131 | 72.8 years |
| Thomas | 127 | 72.1 years |
| George | 116 | 72.6 years |
| Annie | 108 | 79.2 years |
| Most common last names in Georgetown County, SC among deceased individuals | ||
| Last name | Count | Lived (average) |
|---|---|---|
| Smith | 179 | 72.6 years |
| Johnson | 151 | 71.3 years |
| Williams | 125 | 73.1 years |
| Brown | 120 | 71.3 years |
| Green | 109 | 68.5 years |
| Washington | 95 | 69.1 years |
| Lambert | 85 | 67.0 years |
| Wilson | 80 | 72.4 years |
| Davis | 76 | 73.4 years |
| Holmes | 73 | 70.9 years |
| Businesses in Georgetown County, SC | ||||
| Name | Count | Name | Count | |
|---|---|---|---|---|
| AT&T | 1 | MasterBrand Cabinets | 1 | |
| Advance Auto Parts | 1 | Nike | 2 | |
| AutoZone | 1 | Pizza Hut | 1 | |
| Burger King | 1 | Quality | 1 | |
| CVS | 1 | RadioShack | 1 | |
| Church's Chicken | 2 | Rite Aid | 1 | |
| Curves | 1 | Ryan's Grill | 1 | |
| Domino's Pizza | 1 | Sears | 1 | |
| FedEx | 3 | Subway | 2 | |
| GameStop | 1 | T-Mobile | 3 | |
| H&R Block | 1 | Taco Bell | 1 | |
| Hardee's | 1 | U-Haul | 4 | |
| Hilton | 1 | UPS | 2 | |
| Jones New York | 2 | Verizon Wireless | 1 | |
| KFC | 1 | Walgreens | 1 | |
| Little Caesars Pizza | 1 | Walmart | 1 | |
Georgetown County on our top lists:
- #7 on the list of "Top 101 counties with the largest increase in the number of deaths per 1000 residents 2000-2006 to 2007-2013 (pop. 50,000+)"
- #32 on the list of "Top 101 counties with the smallest number of children under 18 without health insurance coverage in 2000 (pop. 50,000+)"
- #90 on the list of "Top 101 counties with the most Black Protestant congregations"
- #94 on the list of "Top 101 counties with the most Black Protestant congregations (pop. 50,000+)"