Giles County, Tennessee (TN)
County owner-occupied free and clear houses and condos in 2010: 3,724
County owner-occupied houses and condos in 2000: 8,831
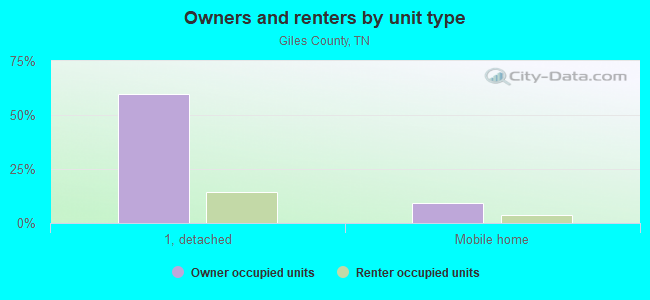
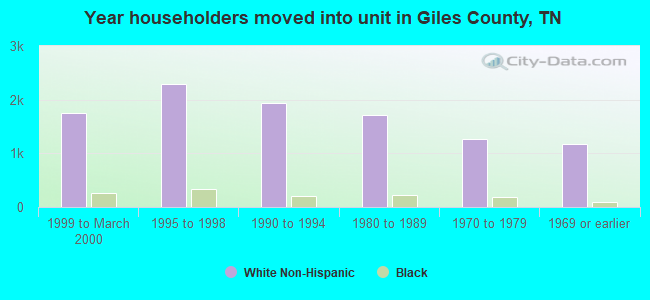
Renter-occupied apartments: 3,237 (it was 2,882 in 2000)
| % of renters here: | 25% |
| State: | 32% |
Land area: 611 sq. mi.
Water area: 0.2 sq. mi.
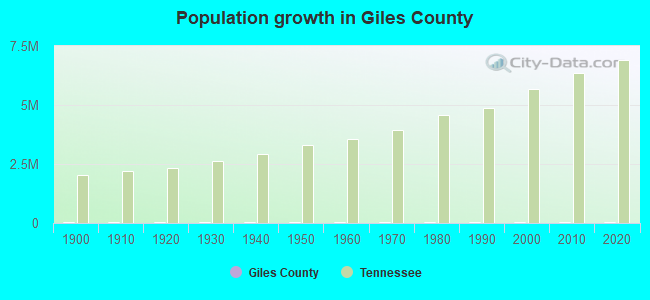
Population density: 51 people per square mile (average).
Industries providing employment: Manufacturing (24.0%), Educational, health and social services (19.3%), Retail trade (12.6%).
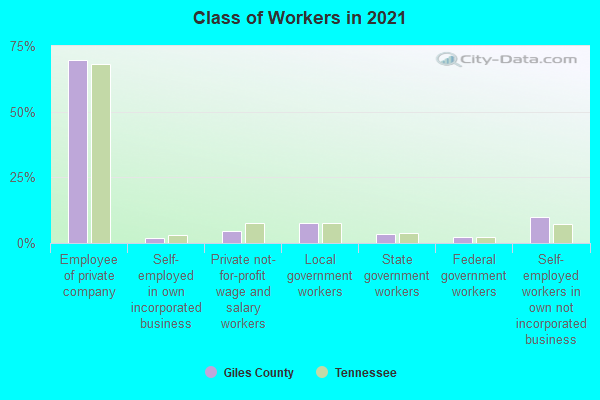
Type of workers:
- Private wage or salary: 82%
- Government: 12%
- Self-employed, not incorporated: 6%
- Unpaid family work: 0%
- OSM Map
- General Map
- Google Map
- MSN Map

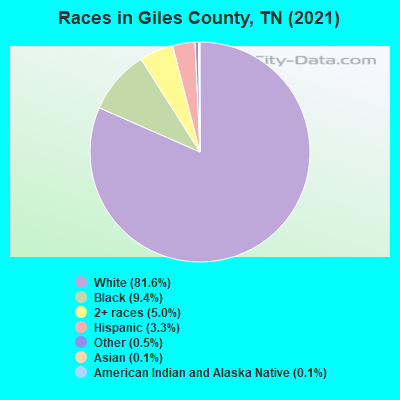
- 25,30781.5%White Non-Hispanic Alone
- 2,6008.4%Black Non-Hispanic Alone
- 1,8666.0%Two or more races
- 1,0733.5%Hispanic or Latino
- 1320.4%Some other race alone
- 330.1%Asian alone
- 280.09%American Indian and Alaska Native alone
| Median resident age: | 44.0 years |
| Tennessee median age: | 39.2 years |
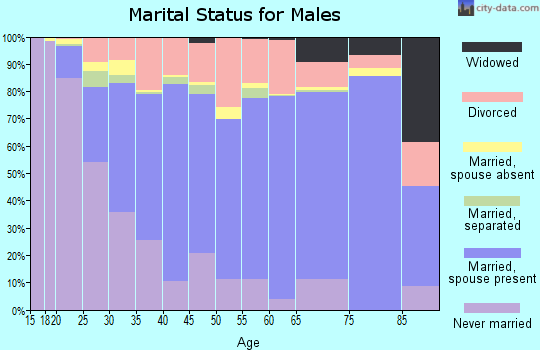
| Males: 14,947 | |
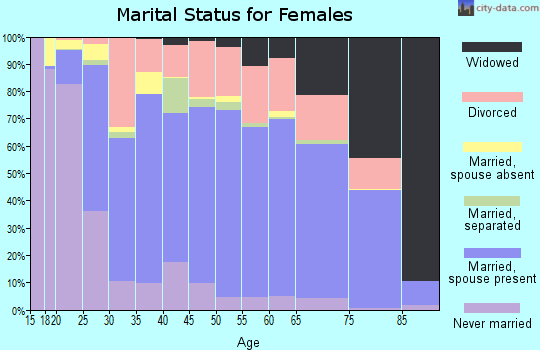
| Females: 15,928 |

 | COVID-19 in Tennessee (237 replies) |
| Is all of Tennessee high humidity? (42 replies) |
| Looking for Sparta (2 replies) |
| TN high schools not preparing kids for college (20 replies) |
| Tennessee Population Estimates 2016 (28 replies) |
| Questions about Tennessee and Tennesseans (67 replies) |
| Giles County: | 2.0 people |
| Tennessee: | 2 people |
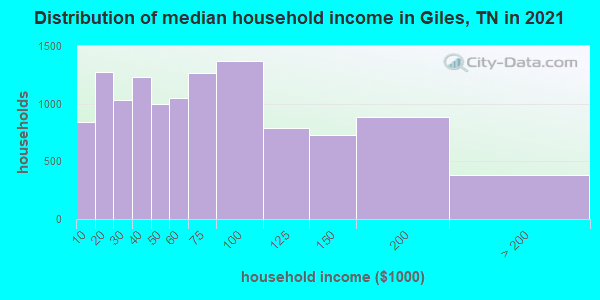
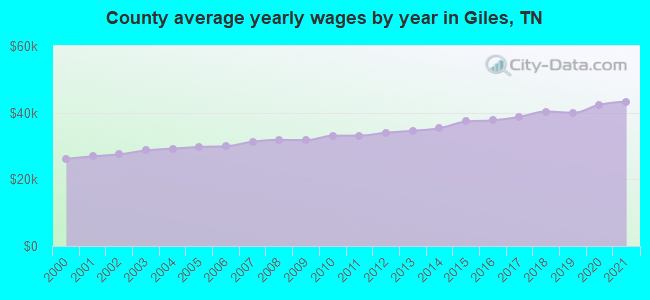
Estimated median household income in 2022: $57,959 ($34,824 in 1999)
| This county: | $57,959 |
| Tennessee: | $65,254 |
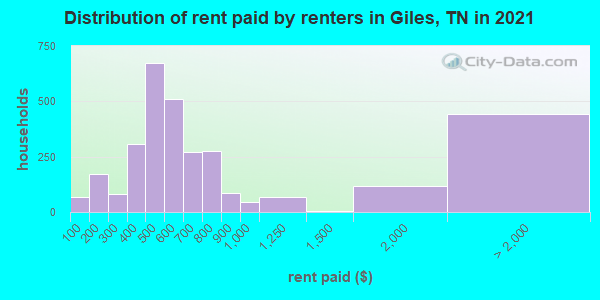
Median contract rent in 2022 for apartments: $612 (lower quartile is $486, upper quartile is $810)
| This county: | $612 |
| State: | $884 |
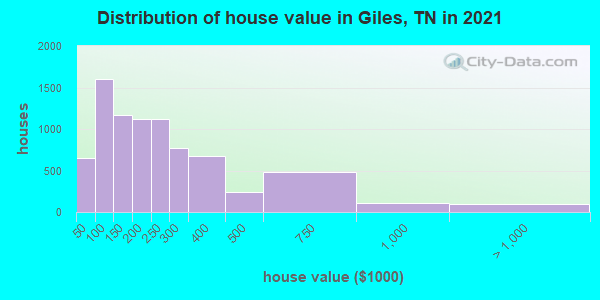
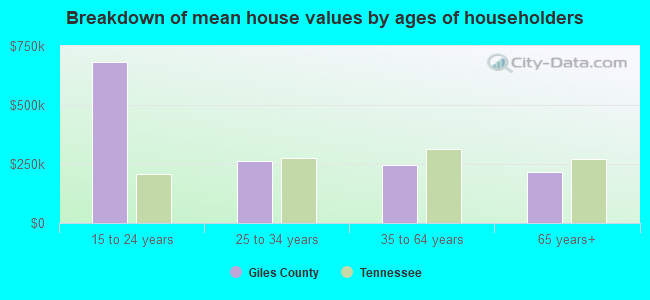
Estimated median house or condo value in 2022: $211,667 (it was $74,700 in 2000)
| Giles: | $211,667 |
| Tennessee: | $284,800 |
Mean price in 2022:
Median monthly housing costs for homes and condos with a mortgage: $1,220Detached houses: $292,327
Here: $292,327 State: $374,382 Townhouses or other attached units: $651,253
Here: $651,253 State: $354,101 Mobile homes: $120,074
Here: $120,074 State: $101,421 Occupied boats, RVs, vans, etc.: $29,876
Here: $29,876 State: $142,822
Median monthly housing costs for units without a mortgage: $384
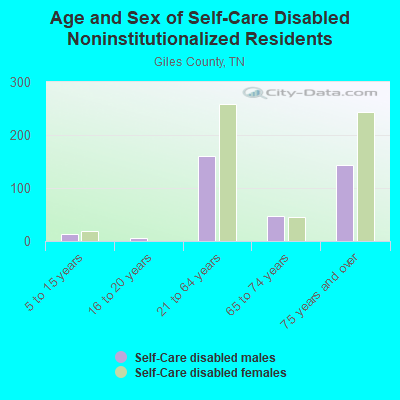
Institutionalized population: 362
Crime in 2021 (reported by the sheriff's office or county police, not the county total):
- Murders: 0
- Rapes: 1
- Robberies: 0
- Assaults: 34
- Burglaries: 25
- Thefts: 40
- Auto thefts: 18
Crime in 2020 (reported by the sheriff's office or county police, not the county total):
- Murders: 0
- Rapes: 5
- Robberies: 0
- Assaults: 52
- Burglaries: 35
- Thefts: 84
- Auto thefts: 25
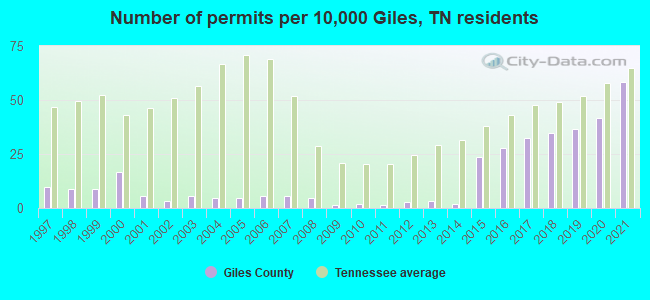
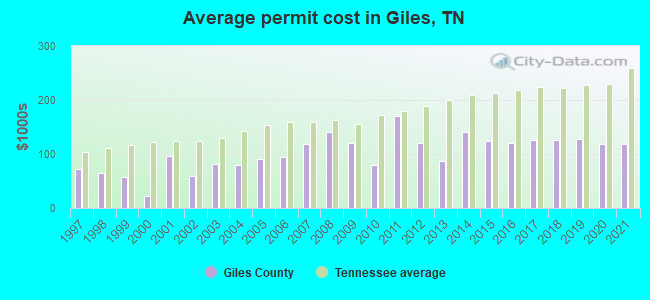
Single-family new house construction building permits:
- 2022: 165 buildings, average cost: $120,200
- 2021: 172 buildings, average cost: $118,400
- 2020: 123 buildings, average cost: $118,500
- 2019: 108 buildings, average cost: $127,600
- 2018: 102 buildings, average cost: $125,500
- 2017: 96 buildings, average cost: $125,900
- 2016: 82 buildings, average cost: $120,400
- 2015: 70 buildings, average cost: $124,600
- 2014: 5 buildings, average cost: $141,000
- 2013: 10 buildings, average cost: $87,100
- 2012: 8 buildings, average cost: $120,200
- 2011: 4 buildings, average cost: $170,800
- 2010: 5 buildings, average cost: $80,000
- 2009: 4 buildings, average cost: $121,300
- 2008: 13 buildings, average cost: $139,600
- 2007: 16 buildings, average cost: $117,500
- 2006: 17 buildings, average cost: $93,500
- 2005: 14 buildings, average cost: $90,100
- 2004: 13 buildings, average cost: $80,000
- 2003: 16 buildings, average cost: $81,400
- 2002: 10 buildings, average cost: $59,200
- 2001: 17 buildings, average cost: $96,300
- 2000: 49 buildings, average cost: $23,400
- 1999: 26 buildings, average cost: $57,600
- 1998: 26 buildings, average cost: $64,800
- 1997: 28 buildings, average cost: $72,300
Median real estate property taxes paid for housing units with mortgages in 2022: $1,118 (0.4%)
Median real estate property taxes paid for housing units with no mortgage in 2022: $796 (0.5%)
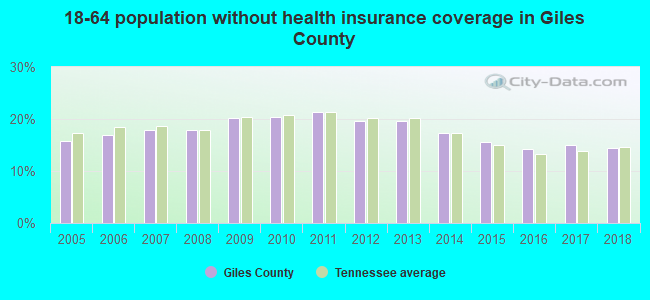
| Giles County: | 12.9% |
| Tennessee: | 13.3% |
Median age of residents in 2022: 44.0 years old
(Males: 43.6 years old, Females: 44.8 years old)
(Median age for: White residents: 45.4 years old, Black residents: 45.9 years old, American Indian residents: 31.4 years old, Asian residents: 22.2 years old, Hispanic or Latino residents: 28.9 years old, Other race residents: 60.2 years old)
Fair market rent in 2006 for a 1-bedroom apartment in Giles County is $381 a month.
Fair market rent for a 2-bedroom apartment is $502 a month.
Fair market rent for a 3-bedroom apartment is $604 a month.
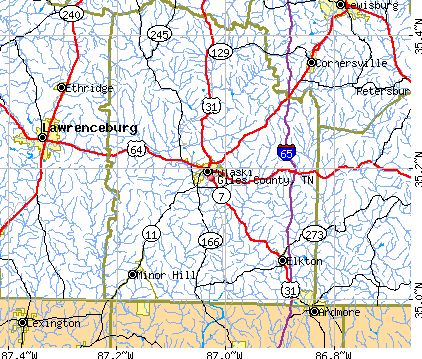
Cities in this county include: Pulaski, Prospect, Ardmore, Elkton, Minor Hill, Lynnville.
Neighboring counties: Grady County, Oklahoma  , Dare County, North Carolina
  , Hardeman County , Johnson County, Arkansas , Santa Barbara County, California , Okfuskee County, Oklahoma .
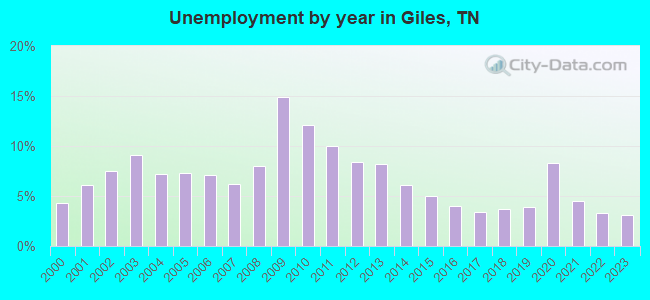
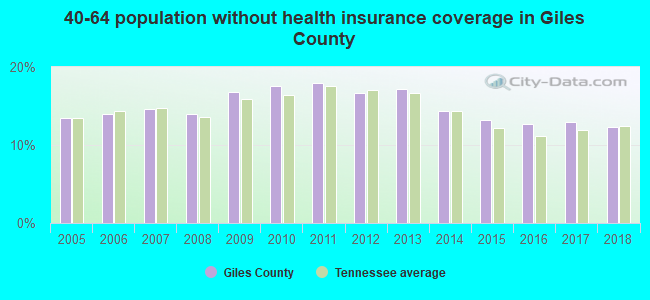
| Here: | 2.9% |
| Tennessee: | 3.0% |
Current college students: 1,011
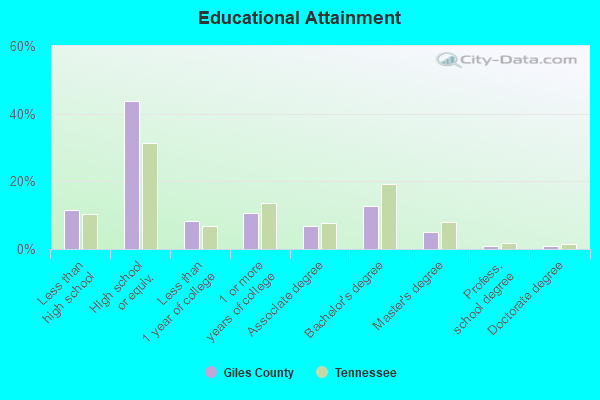
People 25 years of age or older with a high school degree or higher: 88.0%
People 25 years of age or older with a bachelor's degree or higher: 18.9%
Number of foreign born residents: 467 (60.2% naturalized citizens)
| Giles County: | 1.5% |
| Whole state: | 5.6% |
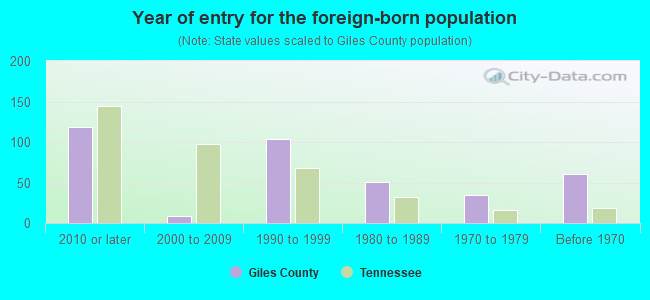
- Year of entry for the foreign-born population
- 1242010 or later
- 62000 to 2009
- 1651990 to 1999
- 511980 to 1989
- 341970 to 1979
- 61Before 1970
Mean travel time to work (commute): minutes
Percentage of county residents living and working in this county: 90.8%
Housing units in structures:
- One, detached: 10,264
- One, attached: 219
- Two: 354
- 3 or 4: 205
- 5 to 9: 225
- 10 to 19: 255
- 20 to 49: 203
- 50 or more: 13
- Mobile homes: 2,510
- Boats, RVs, vans, etc.: 52
Housing units in Giles County with a mortgage: 4,345 (279 second mortgage, 14 home equity loan, 195 both second mortgage and home equity loan)
Houses without a mortgage: 127
| Here: | 3.1% with mortgage |
| State: | 97.8% with mortgage |
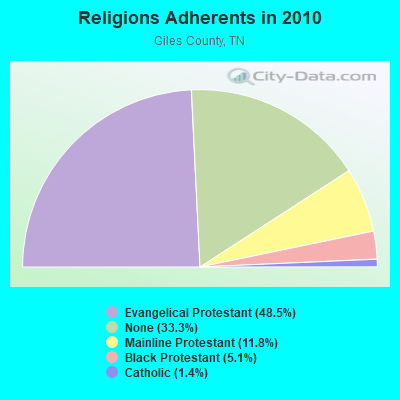
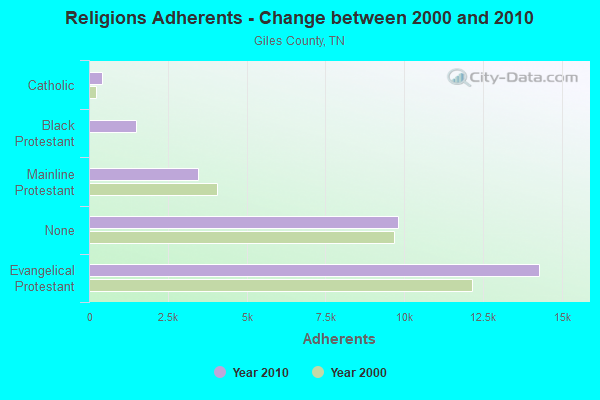
Religion statistics for Giles County
| Religion | Adherents | Congregations |
|---|---|---|
| Evangelical Protestant | 14,299 | 70 |
| Mainline Protestant | 3,467 | 31 |
| Black Protestant | 1,506 | 12 |
| Catholic | 400 | 1 |
| Other | 4 | 1 |
| None | 9,809 | - |
Source: Clifford Grammich, Kirk Hadaway, Richard Houseal, Dale E.Jones, Alexei Krindatch, Richie Stanley and Richard H.Taylor. 2012. 2010 U.S.Religion Census: Religious Congregations & Membership Study. Association of Statisticians of American Religious Bodies. Jones, Dale E., et al. 2002. Congregations and Membership in the United States 2000. Nashville, TN: Glenmary Research Center.
Food Environment Statistics:
| Giles County: | 2.76 / 10,000 pop. |
| State: | 1.99 / 10,000 pop. |
| Here: | 0.34 / 10,000 pop. |
| Tennessee: | 0.17 / 10,000 pop. |
| This county: | 1.38 / 10,000 pop. |
| Tennessee: | 0.65 / 10,000 pop. |
| Giles County: | 6.55 / 10,000 pop. |
| Tennessee: | 5.16 / 10,000 pop. |
| This county: | 4.14 / 10,000 pop. |
| State: | 6.56 / 10,000 pop. |
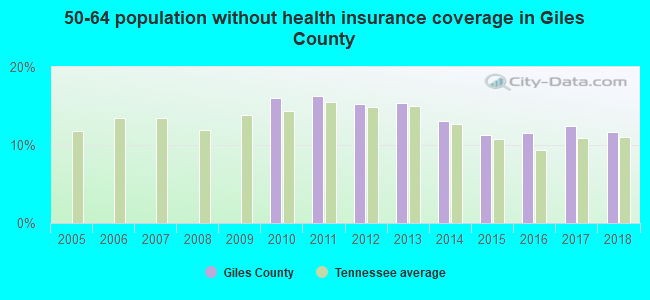
| Giles County: | 11.6% |
| Tennessee: | 11.4% |
| Giles County: | 32.7% |
| State: | 30.2% |
| Here: | 13.2% |
| State: | 13.5% |
Agriculture in Giles County:
Average size of farms: 141 acresAverage value of agricultural products sold per farm: $14,925
Average value of crops sold per acre for harvested cropland: $79.45
The value of nursery, greenhouse, floriculture, and sod as a percentage of the total market value of agricultural products sold: 0.53%
The value of livestock, poultry, and their products as a percentage of the total market value of agricultural products sold: 82.42%
Average total farm production expenses per farm: $18,548
Harvested cropland as a percentage of land in farms: 23.43%
Irrigated harvested cropland as a percentage of land in farms: 1.89%
Average market value of all machinery and equipment per farm: $31,711
The percentage of farms operated by a family or individual: 94.80%
Average age of principal farm operators: 55 years
Average number of cattle and calves per 100 acres of all land in farms: 23.63
Milk cows as a percentage of all cattle and calves: 2.35%
Corn for grain: 6804 harvested acres
All wheat for grain: 911 harvested acres
Upland cotton: 2647 harvested acres
Soybeans for beans: 6357 harvested acres
Vegetables: 94 harvested acres
Land in orchards: 26 acres
Earthquake activity:
Giles County-area historical earthquake activity is significantly above Tennessee state average. It is 196% greater than the overall U.S. average.On 4/29/2003 at 08:59:39, a magnitude 4.9 (4.4 MB, 4.6 MW, 4.9 LG, Class: Light, Intensity: IV - V) earthquake occurred 92.5 miles away from Giles County center
On 4/18/2008 at 09:36:59, a magnitude 5.4 (5.1 MB, 4.8 MS, 5.4 MW, 5.2 MW, Class: Moderate, Intensity: VI - VII) earthquake occurred 231.1 miles away from the county center
On 1/18/1999 at 07:00:53, a magnitude 4.8 (4.8 MB, 4.0 LG, Depth: 0.6 mi) earthquake occurred 123.6 miles away from the county center
On 4/29/2003 at 08:59:39, a magnitude 4.6 (4.6 MW, Depth: 12.3 mi) earthquake occurred 92.5 miles away from the county center
On 5/4/1991 at 01:18:54, a magnitude 5.0 (4.4 MB, 4.6 LG, 5.0 LG, Depth: 3.1 mi) earthquake occurred 183.5 miles away from Giles County center
On 3/25/1976 at 00:41:20, a magnitude 5.0 (4.9 MB, 5.0 LG) earthquake occurred 188.7 miles away from the county center
Magnitude types: regional Lg-wave magnitude (LG), body-wave magnitude (MB), surface-wave magnitude (MS), moment magnitude (MW)
Most recent natural disasters:
- Tennessee Covid-19 Pandemic, Incident Period: January 20, 2020, FEMA Id: 4514, Natural disaster type: Other
- Tennessee Severe Storms, Flooding, Landslides, And Mudslides, Incident Period: February 19, 2019 - March 30, 2019, FEMA Id: 4427, Natural disaster type: Storm, Mudslide, Landslide, Flood
- Tennessee Severe Winter Storm and Flooding, Incident Period: February 15, 2015 to February 23, 2015, Major Disaster (Presidential) Declared DR-4211: April 02, 2015, FEMA Id: 4211, Natural disaster type: Winter Storm, Flood
- Tennessee Severe Storms, Tornadoes, Straight-line Winds, and Flooding, Incident Period: June 05, 2014 to June 10, 2014, Major Disaster (Presidential) Declared DR-4189: August 13, 2014, FEMA Id: 4189, Natural disaster type: Storm, Tornado, Flood, Wind
- Tennessee Severe Storms, Tornadoes, Straight-line Winds, and Associated Flooding, Incident Period: April 25, 2011 to April 28, 2011, Major Disaster (Presidential) Declared DR-1974: May 01, 2011, FEMA Id: 1974, Natural disaster type: Storm, Tornado, Flood, Wind
- Tennessee Severe Storms, Flooding, Straight-Line Winds, and Tornadoes, Incident Period: April 30, 2010 to May 18, 2010, Major Disaster (Presidential) Declared DR-1909: May 04, 2010, FEMA Id: 1909, Natural disaster type: Storm, Tornado, Flood, Wind
- Tennessee Hurricane Katrina Evacuation, Incident Period: August 29, 2005 to October 01, 2005, Emergency Declared EM-3217: September 05, 2005, FEMA Id: 3217, Natural disaster type: Hurricane
- Tennessee Severe Storms and Flooding, Incident Period: September 16, 2004 to September 20, 2004, Major Disaster (Presidential) Declared DR-1568: October 07, 2004, FEMA Id: 1568, Natural disaster type: Storm, Flood
- Tennessee Severe Storms, Tornadoes and Flooding, Incident Period: May 04, 2003 to May 30, 2003, Major Disaster (Presidential) Declared DR-1464: May 08, 2003, FEMA Id: 1464, Natural disaster type: Storm, Tornado, Flood
- Tennessee Storms and Flooding, Incident Period: January 23, 2002 to March 20, 2002, Major Disaster (Presidential) Declared DR-1408: April 05, 2002, FEMA Id: 1408, Natural disaster type: Storm, Flood
- 7 other natural disasters have been reported since 1953.
The number of natural disasters in Giles County (17) is near the US average (15).
Major Disasters (Presidential) Declared: 14
Emergencies Declared: 1
Causes of natural disasters: Floods: 11, Storms: 10, Tornadoes: 7, Winds: 4, Winter Storms: 3, Flash Flood: 1, Heavy Rain: 1, Hurricane: 1, Ice Storm: 1, Landslide: 1, Mudslide: 1, Other: 1 (Note: some incidents may be assigned to more than one category).
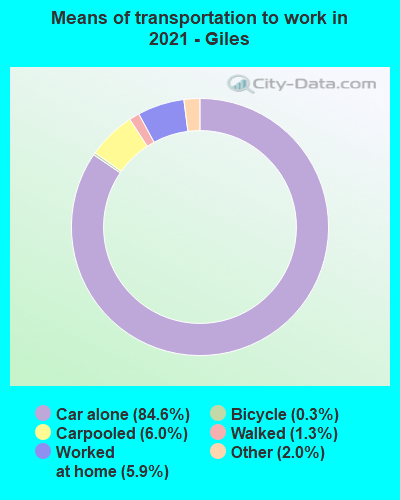
Means of transportation to work:
- Drove a car alone: 8,175 (81.8%)
- Carpooled: 559 (5.6%)
- Taxicab, motorcycle, or other means: 126 (1.3%)
- Bicycle: 46 (0.5%)
- Walked: 132 (1.3%)
- Worked at home: 780 (7.8%)
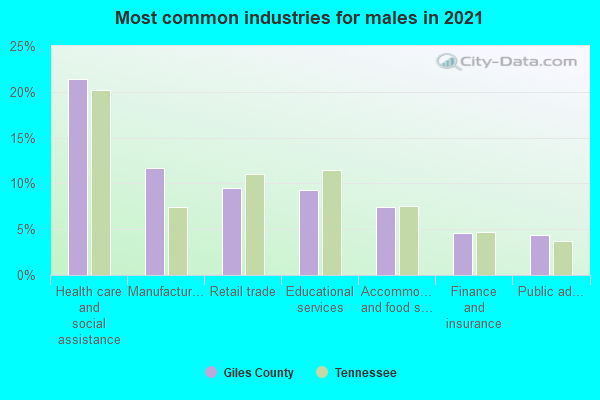
- Health care and social assistance (21%)
- Manufacturing (14%)
- Retail trade (13%)
- Educational services (9%)
- Accommodation and food services (8%)
- Finance and insurance (7%)
- Public administration (4%)
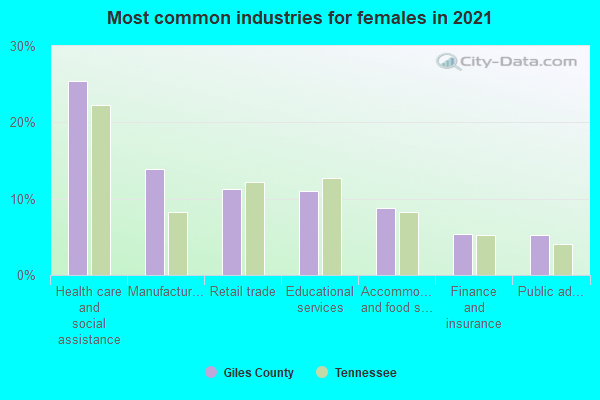
- Health care and social assistance (23%)
- Manufacturing (15%)
- Retail trade (15%)
- Educational services (9%)
- Accommodation and food services (9%)
- Finance and insurance (7%)
- Public administration (4%)
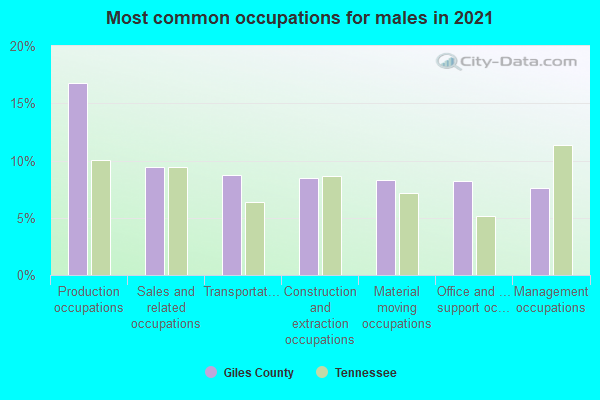
- Production occupations (14%)
- Sales and related occupations (11%)
- Transportation occupations (10%)
- Office and administrative support occupations (10%)
- Construction and extraction occupations (9%)
- Management occupations (9%)
- Installation, maintenance, and repair occupations (8%)
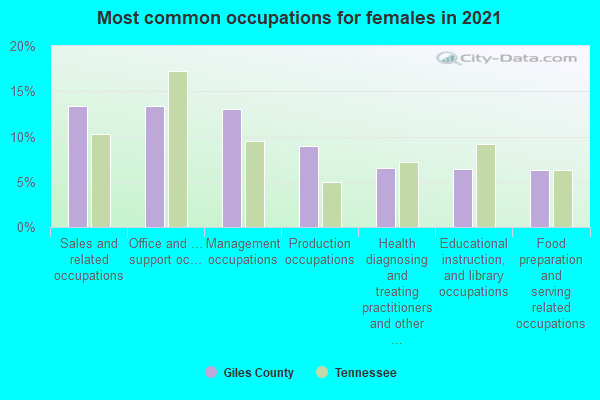
- Office and administrative support occupations (15%)
- Sales and related occupations (14%)
- Management occupations (13%)
- Production occupations (10%)
- Health diagnosing and treating practitioners and other technical occupations (8%)
- Food preparation and serving related occupations (6%)
- Health technologists and technicians (6%)
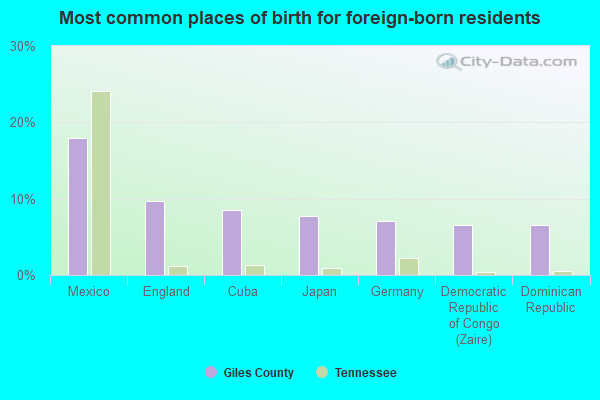
- Mexico (19%)
- Cuba (17%)
- Australia (14%)
- Dominican Republic (11%)
- Colombia (9%)
- Germany (8%)
- England (7%)
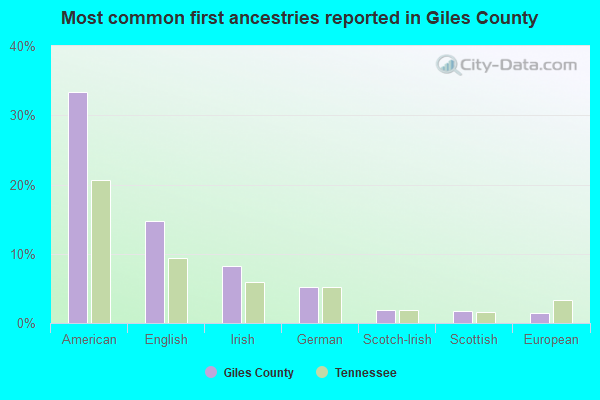
- American (32%)
- English (16%)
- Irish (7%)
- German (5%)
- Scottish (3%)
- Scotch-Irish (2%)
- European (1%)
People in group quarters in Giles County, Tennessee in 2010:
- 284 people in college/university student housing
- 238 people in nursing facilities/skilled-nursing facilities
- 124 people in local jails and other municipal confinement facilities
- 28 people in residential treatment centers for adults
- 4 people in group homes intended for adults
People in group quarters in Giles County, Tennessee in 2000:
- 255 people in nursing homes
- 165 people in college dormitories (includes college quarters off campus)
- 83 people in local jails and other confinement facilities (including police lockups)
- 28 people in other noninstitutional group quarters
- 7 people in homes or halfway houses for drug/alcohol abuse
- 4 people in homes for the mentally retarded
- 4 people in other nonhousehold living situations
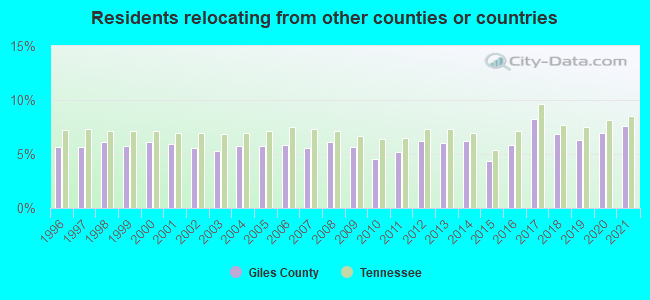
7.59% of this county's 2021 resident taxpayers lived in other counties in 2020 ($56,186 average adjusted gross income)
| Here: | 7.59% |
| Tennessee average: | 8.49% |
10 or fewer of this county's residents moved from foreign countries.
4.18% relocated from other counties in Tennessee ($28,396 average AGI)
3.41% relocated from other states ($27,789 average AGI)
Giles County: 3.41% Tennessee average: 4.34%
Top counties from which taxpayers relocated into this county between 2020 and 2021:
| from Maury County, TN | |
| from Lawrence County, TN | |
| from Marshall County, TN | |
| from Limestone County, AL | |
| from Madison County, AL | |
| from Lincoln County, TN | |
| from Davidson County, TN |
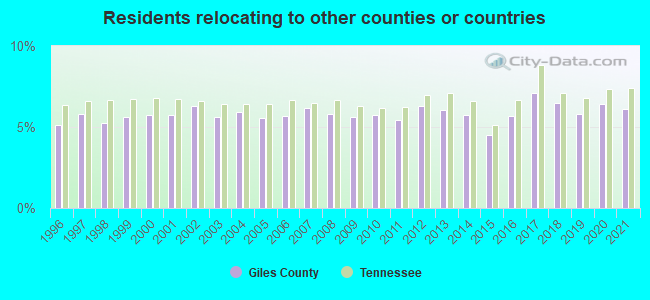
6.12% of this county's 2020 resident taxpayers moved to other counties in 2021 ($42,551 average adjusted gross income)
| Here: | 6.12% |
| Tennessee average: | 7.40% |
10 or fewer of this county's residents moved to foreign countries.
3.51% relocated to other counties in Tennessee ($24,040 average AGI)
2.61% relocated to other states ($18,510 average AGI)
Giles County: 2.61% Tennessee average: 3.20%
Top counties to which taxpayers relocated from this county between 2020 and 2021:
| to Lawrence County, TN | |
| to Maury County, TN | |
| to Limestone County, AL | |
| to Marshall County, TN | |
| to Madison County, AL | |
| to Davidson County, TN | |
| to Lincoln County, TN |
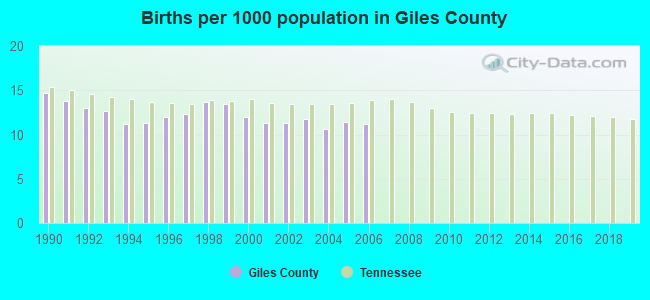
Births per 1000 population from 1990 to 1999: 12.8
Births per 1000 population from 2000 to 2006: 11.4
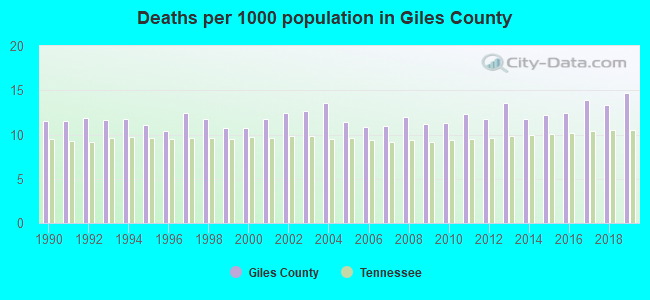
Deaths per 1000 population from 1990 to 1999: 11.4
Deaths per 1000 population from 2000 to 2009: 11.7
Deaths per 1000 population from 2010 to 2020: 13.1
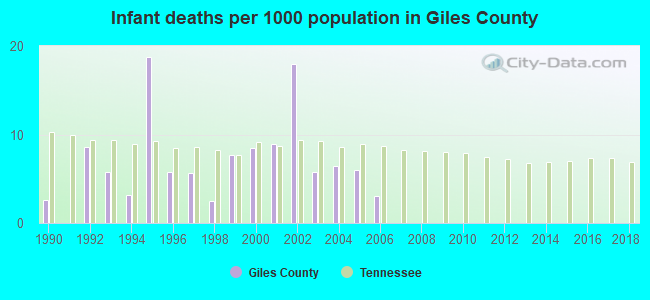
Infant deaths per 1000 live births from 1990 to 1999: 6.1
Infant deaths per 1000 live births from 2000 to 2006: 8.1
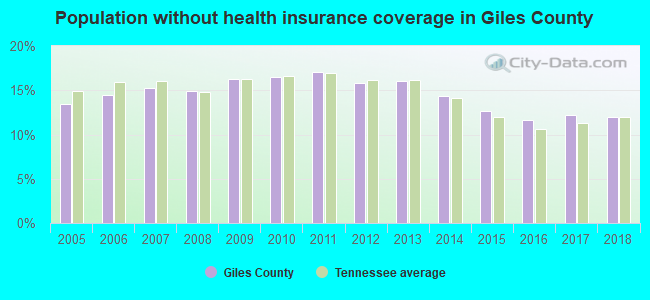
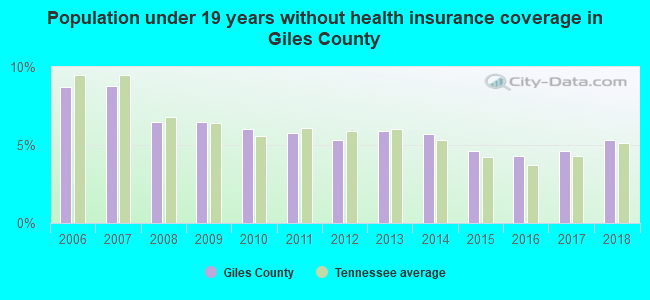
Persons under 19 years old without health insurance coverage in 2018: 5.3%
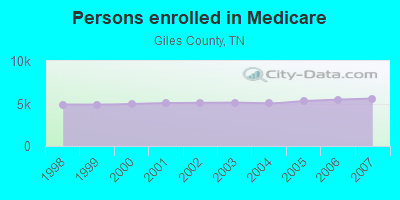
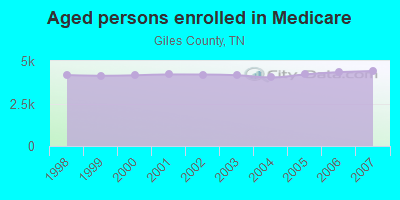
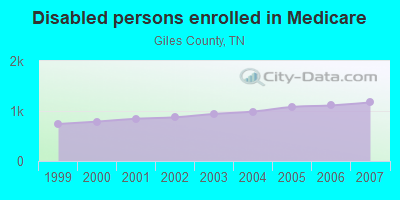
Persons enrolled in hospital insurance and/or supplemental medical insurance (Medicare) in July 1, 2007: 5,586 (4,414 aged, 1,172 disabled)
Children under 18 without health insurance coverage in 2007: 480 (7%)
Most common underlying causes of death in Giles County, Tennessee in 1999 - 2019:
- Acute myocardial infarction, unspecified (621)
- Atherosclerotic cardiovascular disease, so described (599)
- Bronchus or lung, unspecified - Malignant neoplasms (494)
- Atherosclerotic heart disease (303)
- Chronic obstructive pulmonary disease, unspecified (299)
- Stroke, not specified as haemorrhage or infarction (189)
- Alzheimer disease, unspecified (186)
- Unspecified dementia (132)
- Pneumonia, unspecified (85)
- Colon, unspecified - Malignant neoplasms (13)
Population without health insurance coverage in 2000: 12%
Children under 18 without health insurance coverage in 2000: 7%
Short term general hospital admissions per 100,000 population in 2004: 10,333
Short term general hospital beds per 100,000 population in 2004: 325
Emergency room visits per 100,000 population in 2004: 43,743
General practice office based MDs per 100,000 population in 2005: 1,051
Medical specialist MDs per 100,000 population in 2005: 1,406
Dentists per 100,000 population in 1998: 7
Total births per 100,000 population, July 2005 - July 2006 : 28
Total deaths per 100,000 population, July 2005 - July 2006: 72
Limited-service eating places per 100,000 population in 2005 : 10
Suicides per 1,000,000 population from 2000 to 2006: 185.7. This is more than state average.
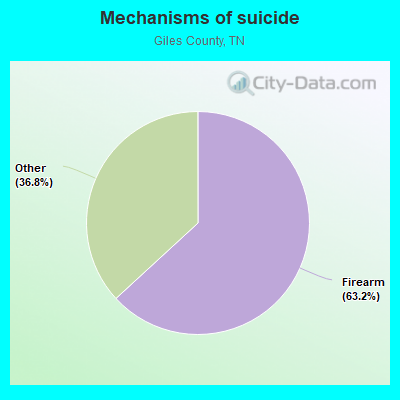
- Firearm - 117.3
- Other - 68.4
Household type by relationship:
Households: 30,875- Male householders: 5,369 (1,341 living alone), Female householders: 6,581 (2,033 living alone)
5,597 spouses (5,557 opposite-sex spouses), 747 unmarried partners, (747 opposite-sex unmarried partners), 8,518 children (7,649 natural, 207 adopted, 645 stepchildren), 1,023 grandchildren, 728 brothers or sisters, 195 parents, 40 foster children, 372 other relatives, 899 non-relatives
- In group quarters: 734
Size of family households: 4,284 2-persons, 1,821 3-persons, 1,283 4-persons, 465 5-persons, 123 6-persons, 86 7-or-more-persons.
Size of nonfamily households: 3,383 1-person, 360 2-persons, 94 3-persons, 18 5-persons.
3,299 married couples with children.
1,822 single-parent households (499 men, 1,323 women).
96.8% of residents of Giles speak English at home.
2.3% of residents speak Spanish at home (67% speak English very well, 23% speak English well, 10% speak English not well).
0.6% of residents speak other Indo-European language at home (87% speak English very well, 7% speak English well, 5% speak English not well).
0.1% of residents speak Asian or Pacific Island language at home (58% speak English very well, 42% speak English not well).
In fiscal year 2004:
Federal Government expenditure: $176,191,000 ($6,023 per capita)
Department of Defense expenditure: $5,126,000
Federal direct payments to individuals for retirement and disability: $78,721,000
Federal other direct payments to individuals: $43,464,000
Federal direct payments not to individuals: $1,697,000
Federal grants: $46,110,000
Federal procurement contracts: $1,403,000 ($67,000 Department of Defense)
Federal salaries and wages: $4,795,000 ($331,000 Department of Defense)
Federal Government direct loans: $2,387,000
Federal guaranteed/insured loans: $8,031,000
Federal Government insurance: $15,656,000
Population change from April 1, 2000 to July 1, 2005:
Births: 1,791| Here: | 61 per 1000 residents |
| State: | 69 per 1000 residents |
Deaths: 1,864
| Here: | 64 per 1000 residents |
| State: | 50 per 1000 residents |
Net international migration: +62
| Here: | +2 per 1000 residents |
| State: | +8 per 1000 residents |
Net internal migration: -101
| Here: | |
| State: |
Total withdrawal of fresh water for public supply: 3.65 millions of gallons per day (8% from ground, 92% from surface)
| Here: | 6.2 |
| State: | 6.5 |
| Here: | 4.6 |
| State: | 4.4 |
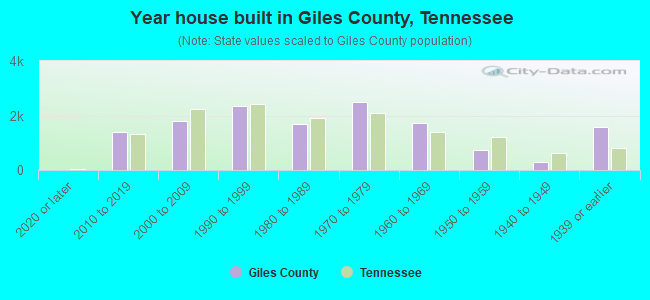
- Year house built in Giles County, Tennessee
- 542020 or later
- 1,5822010 to 2019
- 1,5142000 to 2009
- 2,3581990 to 1999
- 1,7991980 to 1989
- 2,5741970 to 1979
- 1,5861960 to 1969
- 6871950 to 1959
- 3461940 to 1949
- 1,5521939 or earlier
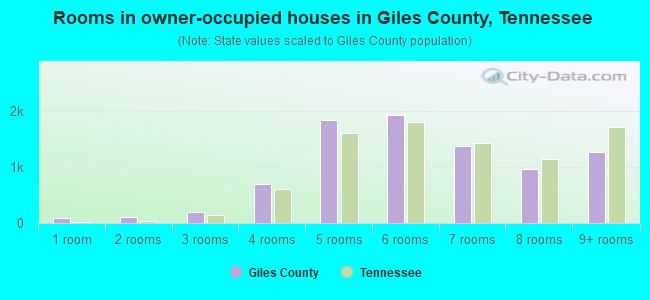
- Rooms in owner-occupied houses in Giles County, Tennessee
- 691 room
- 712 rooms
- 2463 rooms
- 8184 rooms
- 1,7465 rooms
- 2,1026 rooms
- 1,4127 rooms
- 1,1188 rooms
- 1,1839+ rooms
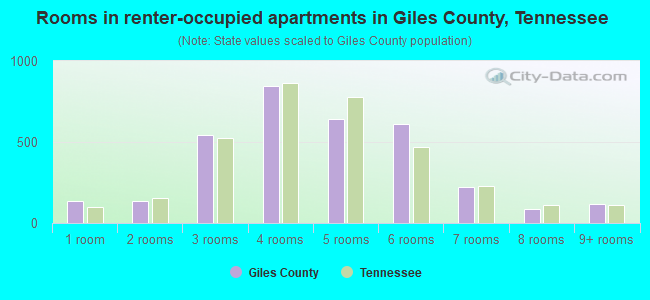
- Rooms in renter-occupied apartments in Giles County, Tennessee
- 1071 room
- 1322 rooms
- 6203 rooms
- 6524 rooms
- 6415 rooms
- 5386 rooms
- 2847 rooms
- 768 rooms
- 1259+ rooms
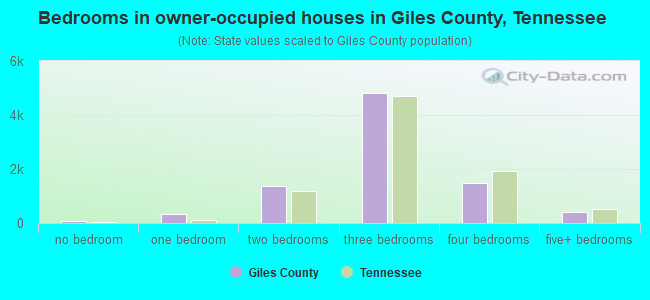
- Bedrooms in owner-occupied houses in Giles County, Tennessee
- 82no bedroom
- 3111 bedroom
- 1,5582 bedrooms
- 4,8313 bedrooms
- 1,5444 bedrooms
- 4295+ bedrooms
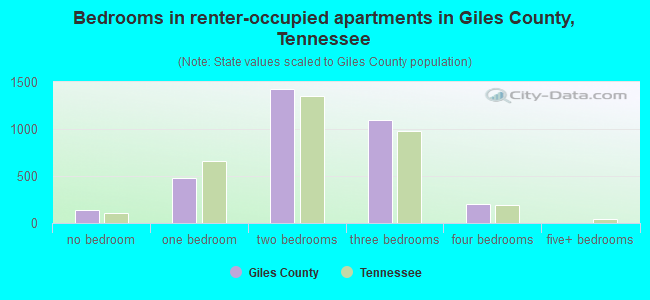
- Bedrooms in renter-occupied apartments in Giles County, Tennessee
- 110no bedroom
- 2851 bedroom
- 1,4652 bedrooms
- 1,0733 bedrooms
- 2384 bedrooms
- 05+ bedrooms
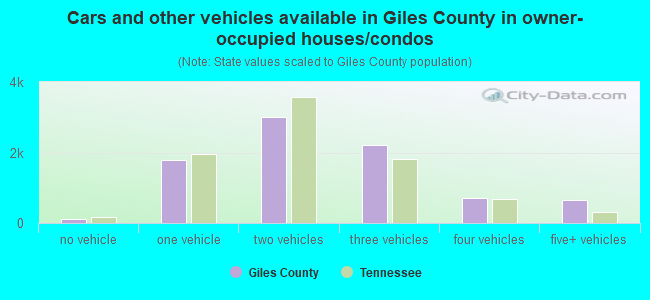
- Cars and other vehicles available in Giles County in owner-occupied houses/condos
- 170no vehicle
- 1,9561 vehicle
- 2,8562 vehicles
- 2,2893 vehicles
- 8824 vehicles
- 5815+ vehicles
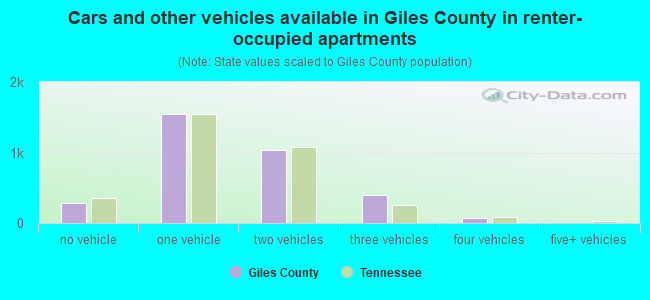
- Cars and other vehicles available in Giles County in renter-occupied apartments
- 285no vehicle
- 1,4431 vehicle
- 9482 vehicles
- 4443 vehicles
- 664 vehicles
- 05+ vehicles
87.8% of Giles County residents lived in the same house 1 years ago.
Out of people who lived in different houses, 32% lived in this county.
Out of people who lived in different counties, 64% lived in Tennessee.
| Giles County: | 87.8% |
| State average: | 87.0% |
Place of birth for U.S.-born residents:
- This state: 18,696
- Other state: 11,463
- Northeast: 801
- Midwest: 2,948
- South: 6,691
- West: 965
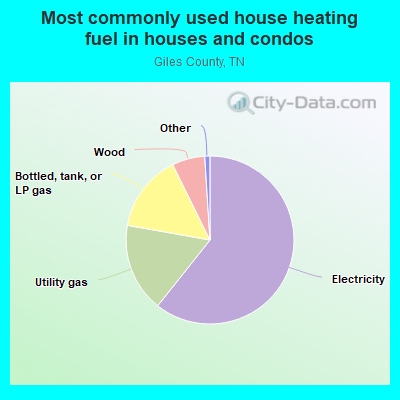
- 62.4%Electricity
- 18.3%Utility gas
- 13.6%Bottled, tank, or LP gas
- 4.8%Wood
- 0.6%No fuel used
- 0.3%Fuel oil, kerosene, etc.
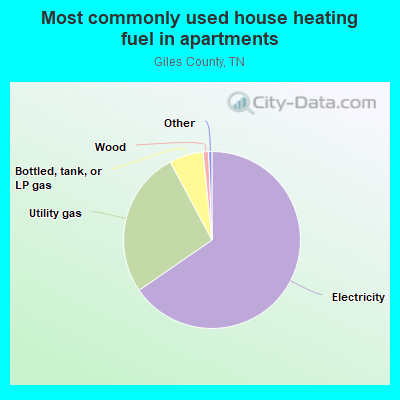
- 69.2%Electricity
- 23.4%Utility gas
- 5.0%Bottled, tank, or LP gas
- 2.2%Wood
- 0.2%Other fuel
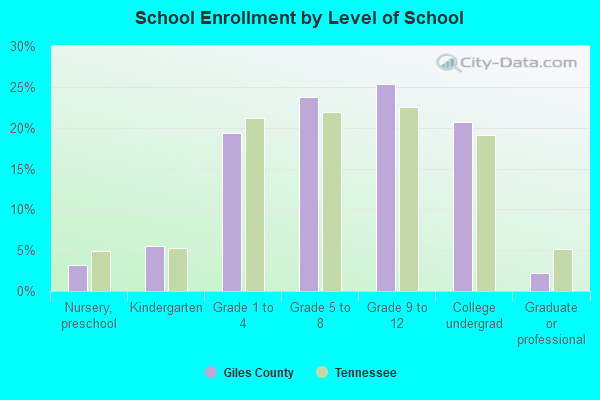
Private vs. public school enrollment:
| Here: | 14.7% |
| Tennessee: | 15.0% |
| Here: | 11.1% |
| Tennessee: | 16.2% |
| Here: | 47.2% |
| Tennessee: | 23.5% |
Giles County government finances - Expenditure in 2017:
- Bond Funds - Cash and Securities: $322,000
- Charges - Other: $2,912,000
Elementary and Secondary Education - Other: $1,434,000
Elementary and Secondary Education School Lunch: $126,000
Regular Highways: $2,000
- Construction - Elementary and Secondary Education: $1,783,000
Regular Highways: $1,113,000
- Current Operations - Elementary and Secondary Education: $35,492,000
Regular Highways: $4,091,000
Health - Other: $2,859,000
General - Other: $2,311,000
Correctional Institutions: $2,157,000
Police Protection: $2,072,000
Financial Administration: $870,000
Judicial and Legal Services: $850,000
Central Staff Services: $571,000
Local Fire Protection: $504,000
General Public Buildings: $452,000
Natural Resources - Other: $280,000
Sewerage: $204,000
Parks and Recreation: $118,000
Libraries: $100,000
Public Welfare - Other: $79,000
Transit Utilities: $48,000
- Federal Intergovernmental - Other: $513,000
- General - Interest on Debt: $114,000
- Intergovernmental to Local - Other - General - Other: $114,000
Other - Elementary and Secondary Education: $22,000
- Local Intergovernmental - Other: $1,159,000
Education: $98,000
Highways: $75,000
- Long Term Debt - Beginning Outstanding - Unspecified Public Purpose: $2,844,000
Outstanding Unspecified Public Purpose: $2,297,000
Retired Unspecified Public Purpose: $575,000
Issue, Unspecified Public Purpose: $28,000
- Miscellaneous - General Revenue - Other: $270,000
Fines and Forfeits: $246,000
Donations From Private Sources: $13,000
Sale of Property: $12,000
Interest Earnings: $1,000
- Other Capital Outlay - Elementary and Secondary Education: $1,153,000
- Other Funds - Cash and Securities: $11,472,000
- Sinking Funds - Cash and Securities: $3,475,000
- State Intergovernmental - Education: $25,719,000
Highways: $2,506,000
Other: $1,156,000
- Tax - Property: $10,608,000
Other Selective Sales: $866,000
General Sales and Gross Receipts: $627,000
Occupation and Business License - Other: $290,000
Other License: $24,000
Alcoholic Beverage Sales: $21,000
- Total Salaries and Wages: $20,784,000
Giles County government finances - Revenue in 2017:
- Bond Funds - Cash and Securities: $322,000
- Charges - Other: $2,912,000
Elementary and Secondary Education - Other: $1,434,000
Elementary and Secondary Education School Lunch: $126,000
Regular Highways: $2,000
- Construction - Elementary and Secondary Education: $1,783,000
Regular Highways: $1,113,000
- Current Operations - Elementary and Secondary Education: $35,492,000
Regular Highways: $4,091,000
Health - Other: $2,859,000
General - Other: $2,311,000
Correctional Institutions: $2,157,000
Police Protection: $2,072,000
Financial Administration: $870,000
Judicial and Legal Services: $850,000
Central Staff Services: $571,000
Local Fire Protection: $504,000
General Public Buildings: $452,000
Natural Resources - Other: $280,000
Sewerage: $204,000
Parks and Recreation: $118,000
Libraries: $100,000
Public Welfare - Other: $79,000
Transit Utilities: $48,000
- Federal Intergovernmental - Other: $513,000
- General - Interest on Debt: $114,000
- Intergovernmental to Local - Other - General - Other: $114,000
Other - Elementary and Secondary Education: $22,000
- Local Intergovernmental - Other: $1,159,000
Education: $98,000
Highways: $75,000
- Long Term Debt - Beginning Outstanding - Unspecified Public Purpose: $2,844,000
Outstanding Unspecified Public Purpose: $2,297,000
Retired Unspecified Public Purpose: $575,000
Issue, Unspecified Public Purpose: $28,000
- Miscellaneous - General Revenue - Other: $270,000
Fines and Forfeits: $246,000
Donations From Private Sources: $13,000
Sale of Property: $12,000
Interest Earnings: $1,000
- Other Capital Outlay - Elementary and Secondary Education: $1,153,000
- Other Funds - Cash and Securities: $11,472,000
- Sinking Funds - Cash and Securities: $3,475,000
- State Intergovernmental - Education: $25,719,000
Highways: $2,506,000
Other: $1,156,000
- Tax - Property: $10,608,000
Other Selective Sales: $866,000
General Sales and Gross Receipts: $627,000
Occupation and Business License - Other: $290,000
Other License: $24,000
Alcoholic Beverage Sales: $21,000
- Total Salaries and Wages: $20,784,000
Giles County government finances - Debt in 2017:
- Bond Funds - Cash and Securities: $322,000
- Charges - Other: $2,912,000
Elementary and Secondary Education - Other: $1,434,000
Elementary and Secondary Education School Lunch: $126,000
Regular Highways: $2,000
- Construction - Elementary and Secondary Education: $1,783,000
Regular Highways: $1,113,000
- Current Operations - Elementary and Secondary Education: $35,492,000
Regular Highways: $4,091,000
Health - Other: $2,859,000
General - Other: $2,311,000
Correctional Institutions: $2,157,000
Police Protection: $2,072,000
Financial Administration: $870,000
Judicial and Legal Services: $850,000
Central Staff Services: $571,000
Local Fire Protection: $504,000
General Public Buildings: $452,000
Natural Resources - Other: $280,000
Sewerage: $204,000
Parks and Recreation: $118,000
Libraries: $100,000
Public Welfare - Other: $79,000
Transit Utilities: $48,000
- Federal Intergovernmental - Other: $513,000
- General - Interest on Debt: $114,000
- Intergovernmental to Local - Other - General - Other: $114,000
Other - Elementary and Secondary Education: $22,000
- Local Intergovernmental - Other: $1,159,000
Education: $98,000
Highways: $75,000
- Long Term Debt - Beginning Outstanding - Unspecified Public Purpose: $2,844,000
Outstanding Unspecified Public Purpose: $2,297,000
Retired Unspecified Public Purpose: $575,000
Issue, Unspecified Public Purpose: $28,000
- Miscellaneous - General Revenue - Other: $270,000
Fines and Forfeits: $246,000
Donations From Private Sources: $13,000
Sale of Property: $12,000
Interest Earnings: $1,000
- Other Capital Outlay - Elementary and Secondary Education: $1,153,000
- Other Funds - Cash and Securities: $11,472,000
- Sinking Funds - Cash and Securities: $3,475,000
- State Intergovernmental - Education: $25,719,000
Highways: $2,506,000
Other: $1,156,000
- Tax - Property: $10,608,000
Other Selective Sales: $866,000
General Sales and Gross Receipts: $627,000
Occupation and Business License - Other: $290,000
Other License: $24,000
Alcoholic Beverage Sales: $21,000
- Total Salaries and Wages: $20,784,000
Giles County government finances - Cash and Securities in 2017:
- Bond Funds - Cash and Securities: $322,000
- Charges - Other: $2,912,000
Elementary and Secondary Education - Other: $1,434,000
Elementary and Secondary Education School Lunch: $126,000
Regular Highways: $2,000
- Construction - Elementary and Secondary Education: $1,783,000
Regular Highways: $1,113,000
- Current Operations - Elementary and Secondary Education: $35,492,000
Regular Highways: $4,091,000
Health - Other: $2,859,000
General - Other: $2,311,000
Correctional Institutions: $2,157,000
Police Protection: $2,072,000
Financial Administration: $870,000
Judicial and Legal Services: $850,000
Central Staff Services: $571,000
Local Fire Protection: $504,000
General Public Buildings: $452,000
Natural Resources - Other: $280,000
Sewerage: $204,000
Parks and Recreation: $118,000
Libraries: $100,000
Public Welfare - Other: $79,000
Transit Utilities: $48,000
- Federal Intergovernmental - Other: $513,000
- General - Interest on Debt: $114,000
- Intergovernmental to Local - Other - General - Other: $114,000
Other - Elementary and Secondary Education: $22,000
- Local Intergovernmental - Other: $1,159,000
Education: $98,000
Highways: $75,000
- Long Term Debt - Beginning Outstanding - Unspecified Public Purpose: $2,844,000
Outstanding Unspecified Public Purpose: $2,297,000
Retired Unspecified Public Purpose: $575,000
Issue, Unspecified Public Purpose: $28,000
- Miscellaneous - General Revenue - Other: $270,000
Fines and Forfeits: $246,000
Donations From Private Sources: $13,000
Sale of Property: $12,000
Interest Earnings: $1,000
- Other Capital Outlay - Elementary and Secondary Education: $1,153,000
- Other Funds - Cash and Securities: $11,472,000
- Sinking Funds - Cash and Securities: $3,475,000
- State Intergovernmental - Education: $25,719,000
Highways: $2,506,000
Other: $1,156,000
- Tax - Property: $10,608,000
Other Selective Sales: $866,000
General Sales and Gross Receipts: $627,000
Occupation and Business License - Other: $290,000
Other License: $24,000
Alcoholic Beverage Sales: $21,000
- Total Salaries and Wages: $20,784,000
Supplemental Security Income (SSI) in 2006:
- Total number of recipients: 779
- Number of aged recipients: 117
- Number of blind and disabled recipients: 662
- Number of recipients under 18: 81
- Number of recipients between 18 and 64: 473
- Number of recipients older than 64: 225
- Number of recipients also receiving OASDI: 350
- Amount of payments (thousands of dollars): 310
| Most common first names in Giles County, TN among deceased individuals | ||
| Name | Count | Lived (average) |
|---|---|---|
| James | 333 | 70.8 years |
| William | 302 | 73.3 years |
| Mary | 286 | 79.7 years |
| John | 249 | 74.8 years |
| Robert | 189 | 72.1 years |
| Thomas | 108 | 72.8 years |
| Charles | 92 | 70.2 years |
| George | 92 | 73.5 years |
| Annie | 88 | 81.7 years |
| Joe | 76 | 70.8 years |
| Most common last names in Giles County, TN among deceased individuals | ||
| Last name | Count | Lived (average) |
|---|---|---|
| Smith | 217 | 77.8 years |
| White | 116 | 77.2 years |
| Johnson | 88 | 75.8 years |
| Brown | 87 | 72.5 years |
| Jones | 79 | 74.4 years |
| Harwell | 69 | 78.8 years |
| Davis | 69 | 78.1 years |
| Holt | 68 | 79.0 years |
| Williams | 64 | 75.3 years |
| Abernathy | 54 | 79.1 years |
| Businesses in Giles County, TN | ||||
| Name | Count | Name | Count | |
|---|---|---|---|---|
| Ace Hardware | 1 | Little Caesars Pizza | 1 | |
| Advance Auto Parts | 1 | Long John Silver's | 1 | |
| AutoZone | 1 | MasterBrand Cabinets | 1 | |
| Burger King | 1 | McDonald's | 1 | |
| CVS | 1 | Pizza Hut | 2 | |
| Chevrolet | 1 | RadioShack | 1 | |
| Comfort Inn | 1 | SONIC Drive-In | 2 | |
| Curves | 1 | Subway | 3 | |
| FedEx | 2 | Super 8 | 1 | |
| Ford | 1 | T-Mobile | 1 | |
| H&R Block | 2 | Taco Bell | 2 | |
| Hardee's | 2 | U-Haul | 1 | |
| Home Depot | 1 | Vans | 1 | |
| KFC | 2 | Walgreens | 1 | |
| La-Z-Boy | 1 | Walmart | 1 | |