Golden Valley County, Montana (MT)
County owner-occupied free and clear houses and condos in 2010: 180
County owner-occupied houses and condos in 2000: 283
Renter-occupied apartments: 87 (it was 82 in 2000)
| % of renters here: | 22% |
| State: | 32% |
Land area: 1175 sq. mi.
Water area: 1.1 sq. mi.
Population density: 1 people per square mile (very low).
Industries providing employment: Agriculture,forestry,fishing and hunting, and mining (39.3%), Educational, health and social services (21.2%).
Type of workers:
- Private wage or salary: 70%
- Government: 18%
- Self-employed, not incorporated: 11%
- Unpaid family work: 1%
- OSM Map
- General Map
- Google Map
- MSN Map


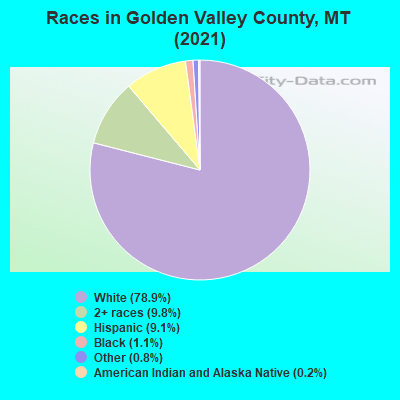
- 72984.3%White Non-Hispanic Alone
- 789.0%Hispanic or Latino
- 465.3%Two or more races
- 60.7%Some other race alone
- 50.6%Black Non-Hispanic Alone
- 10.1%American Indian and Alaska Native alone
| Median resident age: | 55.0 years |
| Montana median age: | 40.2 years |
| Males: 428 | |
| Females: 436 |

 | Getting ready to pull the trigger (25 replies) |
| V-Bar Ranch (6 replies) |
| Summer Weather Alerts, 2013 (Road Conditions and Highway Cams) (41 replies) |
| Recommendations on affordable, mid-size towns for libertarian couple (15 replies) |
| severe weather 2009 (16 replies) |
| Ryegate, MT (18 replies) |
| Golden Valley County: | 2.0 people |
| Montana: | 2 people |
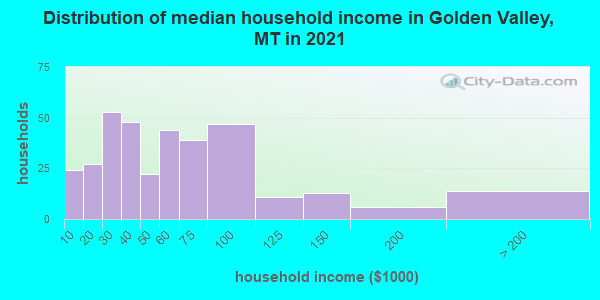
Estimated median household income in 2022: $55,857 ($27,308 in 1999)
| This county: | $55,857 |
| Montana: | $67,631 |
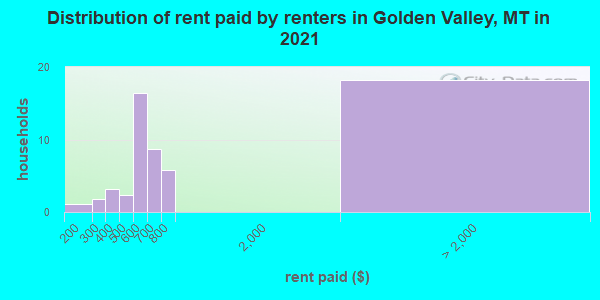
Median contract rent in 2022 for apartments: $541 (lower quartile is $348, upper quartile is $624)
| This county: | $541 |
| State: | $871 |
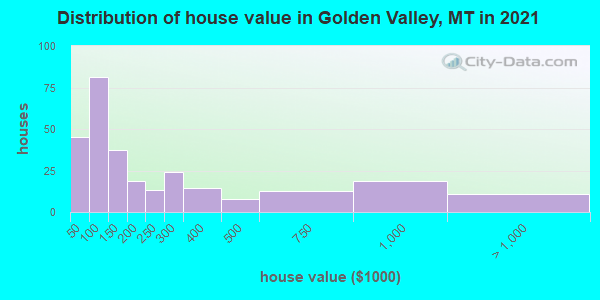
Estimated median house or condo value in 2022: $166,480 (it was $58,400 in 2000)
| Golden Valley: | $166,480 |
| Montana: | $366,400 |
Mean price in 2022:
Median monthly housing costs for homes and condos with a mortgage: $1,091Detached houses: $791,495
Here: $791,495 State: $518,333 Mobile homes: $125,071
Here: $125,071 State: $139,111
Median monthly housing costs for units without a mortgage: $400
Institutionalized population: 0
Crime in 2021 (reported by the sheriff's office or county police, not the county total):
- Murders: 0
- Rapes: 1
- Robberies: 0
- Assaults: 1
- Burglaries: 0
- Thefts: 4
- Auto thefts: 1
Crime in 2020 (reported by the sheriff's office or county police, not the county total):
- Murders: 0
- Rapes: 1
- Robberies: 0
- Assaults: 1
- Burglaries: 0
- Thefts: 0
- Auto thefts: 0
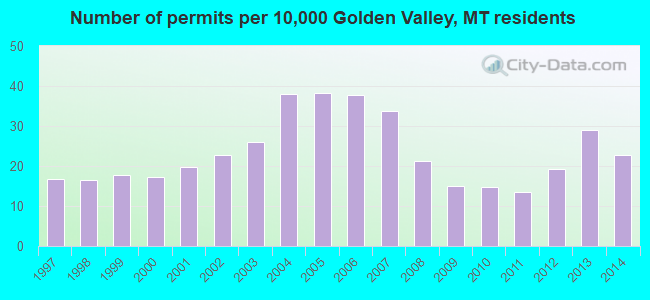
Single-family new house construction building permits:
- 2014: 0 buildings
- 2013: 0 buildings
- 2012: 0 buildings
- 2011: 0 buildings
- 2010: 0 buildings
- 2009: 0 buildings
- 2008: 0 buildings
- 2007: 0 buildings
- 2006: 0 buildings
- 2005: 0 buildings
- 2004: 0 buildings
- 2003: 0 buildings
- 2002: 0 buildings
- 2001: 0 buildings
- 2000: 0 buildings
- 1999: 0 buildings
- 1998: 0 buildings
- 1997: 0 buildings
Median real estate property taxes paid for housing units with mortgages in 2022: $1,201 (0.5%)
Median real estate property taxes paid for housing units with no mortgage in 2022: $874 (0.6%)
| Golden Valley County: | 15.6% |
| Montana: | 12.1% |
Median age of residents in 2022: 55.0 years old
(Males: 56.3 years old, Females: 54.6 years old)
(Median age for: White residents: 57.4 years old, Black residents: 70.3 years old, Hispanic or Latino residents: 15.3 years old)
Fair market rent in 2006 for a 1-bedroom apartment in Golden Valley County is $424 a month.
Fair market rent for a 2-bedroom apartment is $503 a month.
Fair market rent for a 3-bedroom apartment is $678 a month.
Neighboring counties: Adams County, Washington  , Columbia County, Washington , Franklin County, Washington , Houghton County, Michigan
  , Slope County, North Dakota , Red Lake County, Minnesota .
| Here: | 4.5% |
| Montana: | 3.8% |

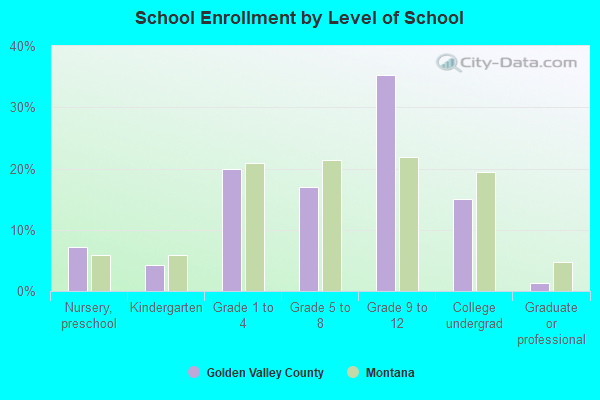
Current college students: 13
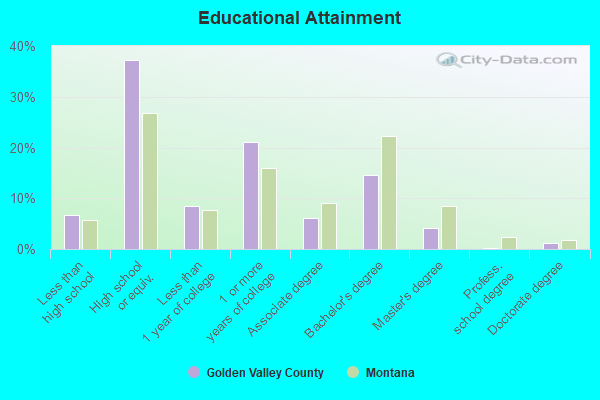
People 25 years of age or older with a high school degree or higher: 91.3%
People 25 years of age or older with a bachelor's degree or higher: 23.4%
Number of foreign born residents: 11 (92.9% naturalized citizens)
| Golden Valley County: | 1.4% |
| Whole state: | 2.3% |

- Year of entry for the foreign-born population
- 02010 or later
- 32000 to 2009
- 01990 to 1999
- 41980 to 1989
- 01970 to 1979
- 23Before 1970
Mean travel time to work (commute): " minutes
Percentage of county residents living and working in this county: 99.0%
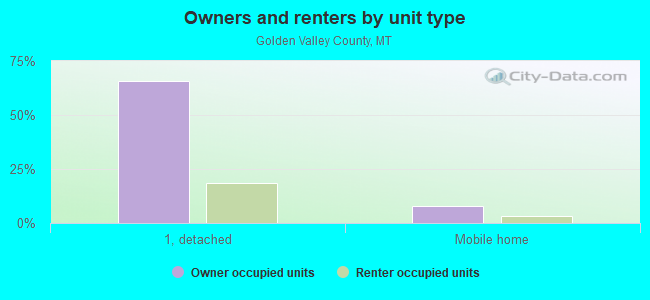
Housing units in structures:
- One, detached: 369
- 5 to 9: 11
- Mobile homes: 91
Housing units in Golden Valley County with a mortgage: 101 (6 second mortgage, 0 home equity loan, 5 both second mortgage and home equity loan)
Houses without a mortgage: 9
| Here: | 91.8% with mortgage |
| State: | 97.4% with mortgage |
Religion statistics for Golden Valley County
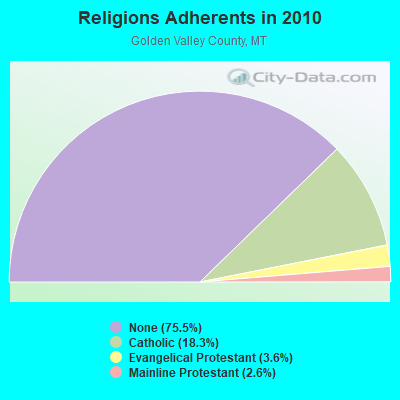
| Religion | Adherents | Congregations |
|---|---|---|
| Catholic | 162 | 1 |
| Evangelical Protestant | 32 | 2 |
| Mainline Protestant | 23 | 3 |
| None | 667 | - |
Source: Clifford Grammich, Kirk Hadaway, Richard Houseal, Dale E.Jones, Alexei Krindatch, Richie Stanley and Richard H.Taylor. 2012. 2010 U.S.Religion Census: Religious Congregations & Membership Study. Association of Statisticians of American Religious Bodies. Jones, Dale E., et al. 2002. Congregations and Membership in the United States 2000. Nashville, TN: Glenmary Research Center.
Food Environment Statistics:
| Golden Valley County: | 8.94 / 10,000 pop. |
| Montana: | 4.69 / 10,000 pop. |
| This county: | 17.89 / 10,000 pop. |
| State: | 10.38 / 10,000 pop. |
| Golden Valley County: | 7.4% |
| Montana: | 7.2% |
| Golden Valley County: | 24.4% |
| State: | 23.1% |
Agriculture in Golden Valley County:
Average size of farms: 4720 acresAverage value of agricultural products sold per farm: $57,146
Average value of crops sold per acre for harvested cropland: $35.46
The value of nursery, greenhouse, floriculture, and sod as a percentage of the total market value of agricultural products sold: 0.00%
The value of livestock, poultry, and their products as a percentage of the total market value of agricultural products sold: 88.00%
Average total farm production expenses per farm: $70,880
Harvested cropland as a percentage of land in farms: 4.10%
Irrigated harvested cropland as a percentage of land in farms: 16.99%
Average market value of all machinery and equipment per farm: $80,251
The percentage of farms operated by a family or individual: 77.14%
Average age of principal farm operators: 57 years
Average number of cattle and calves per 100 acres of all land in farms: 2.24
All wheat for grain: 12156 harvested acres
Earthquake activity:
Golden Valley County-area historical earthquake activity is significantly above Montana state average. It is 662% greater than the overall U.S. average.On 8/18/1959 at 06:37:13, a magnitude 7.7 (7.7 UK, Class: Major, Intensity: VIII - XII) earthquake occurred 146.4 miles away from Golden Valley County center, causing $26,000,000 total damage
On 10/28/1983 at 14:06:06, a magnitude 7.3 (6.2 MB, 7.3 MS, 7.0 MW) earthquake occurred 278.3 miles away from the county center, causing 2 deaths (2 shaking deaths) and 3 injuries, causing $15,000,000 total damage
On 6/30/1975 at 18:54:13, a magnitude 6.1 (5.6 MB, 5.9 MS, 6.1 UK, 6.1 ML, Class: Strong, Intensity: VII - IX) earthquake occurred 142.2 miles away from the county center
On 7/6/2017 at 06:30:17, a magnitude 5.8 (5.8 MW, Depth: 7.6 mi, Class: Moderate, Intensity: VI - VII) earthquake occurred 167.3 miles away from the county center
On 3/31/2020 at 23:52:30, a magnitude 6.5 (6.5 MW, Depth: 7.5 mi) earthquake occurred 319.8 miles away from Golden Valley County center
On 7/26/2005 at 04:08:37, a magnitude 5.7 (5.7 MB, 5.2 MS, 5.6 MW) earthquake occurred 179.7 miles away from the county center
Magnitude types: body-wave magnitude (MB), local magnitude (ML), surface-wave magnitude (MS), moment magnitude (MW)
Most recent natural disasters:
- Montana Covid-19 Pandemic, Incident Period: January 20, 2020, FEMA Id: 4508, Natural disaster type: Other
- Montana Flooding, Incident Period: May 1, 2018 - June 10, 2018, FEMA Id: 4405, Natural disaster type: Flood
- Montana Ice Jams and Flooding, Incident Period: March 01, 2014 to March 17, 2014, Major Disaster (Presidential) Declared DR-4172: April 17, 2014, FEMA Id: 4172, Natural disaster type: Flood
- Montana Severe Storms and Flooding, Incident Period: April 04, 2011 to July 22, 2011, Major Disaster (Presidential) Declared DR-1996: June 17, 2011, FEMA Id: 1996, Natural disaster type: Storm, Flood
- Montana Hurricane Katrina Evacuation, Incident Period: August 29, 2005 to October 01, 2005, Emergency Declared EM-3253: September 13, 2005, FEMA Id: 3253, Natural disaster type: Hurricane
- Montana Wildfires, Incident Period: July 13, 2000 to September 25, 2000, Major Disaster (Presidential) Declared DR-1340: August 30, 2000, FEMA Id: 1340, Natural disaster type: Fire
- Montana Drought, Incident Period: August 22, 1977, Emergency Declared EM-3050: August 22, 1977, FEMA Id: 3050, Natural disaster type: Drought
The number of natural disasters in Golden Valley County (7) is smaller than the US average (15).
Major Disasters (Presidential) Declared: 3
Emergencies Declared: 2
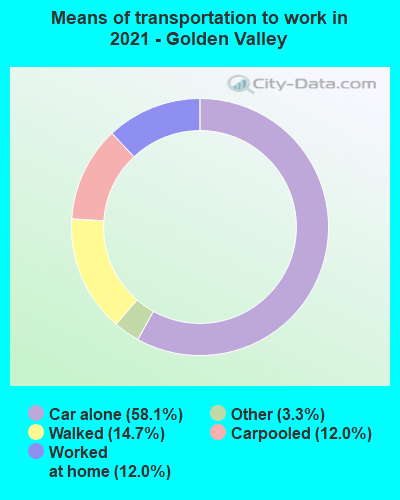
Means of transportation to work:
- Drove a car alone: 205 (51.2%)
- Carpooled: 53 (13.2%)
- Taxicab, motorcycle, or other means: 13 (3.2%)
- Walked: 82 (20.5%)
- Worked at home: 55 (13.8%)
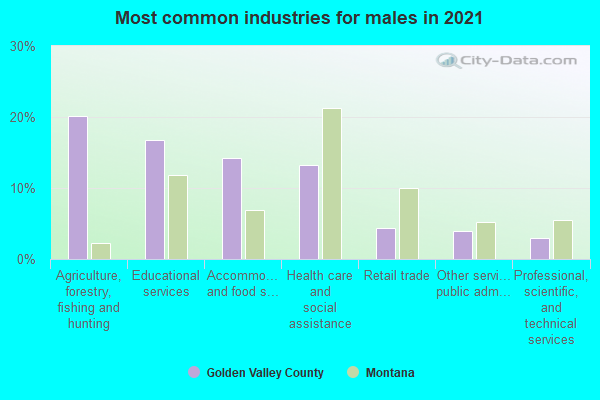
- Educational services (18%)
- Agriculture, forestry, fishing and hunting (17%)
- Accommodation and food services (13%)
- Health care and social assistance (12%)
- Retail trade (5%)
- Professional, scientific, and technical services (4%)
- Public administration (3%)
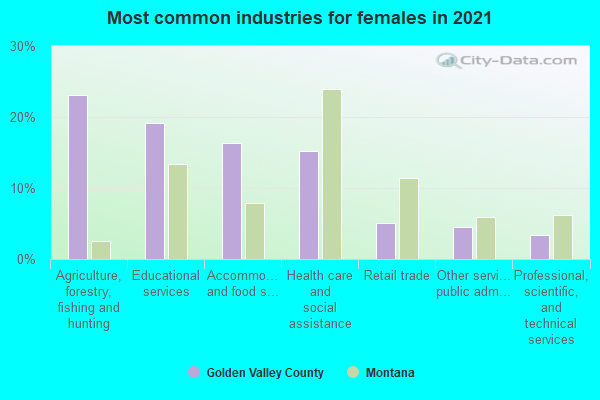
- Educational services (23%)
- Agriculture, forestry, fishing and hunting (21%)
- Accommodation and food services (16%)
- Health care and social assistance (15%)
- Retail trade (7%)
- Professional, scientific, and technical services (5%)
- Public administration (3%)
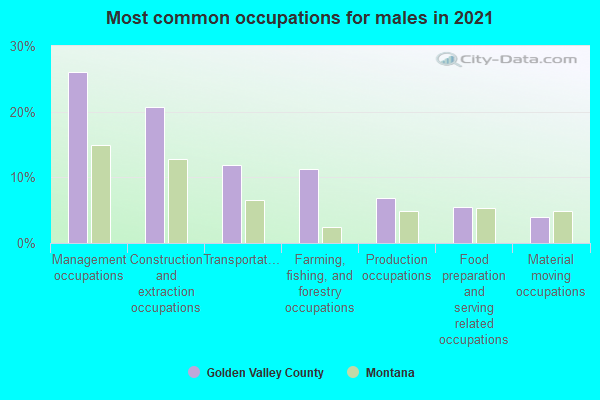
- Management occupations (31%)
- Farming, fishing, and forestry occupations (19%)
- Construction and extraction occupations (15%)
- Transportation occupations (8%)
- Production occupations (6%)
- Installation, maintenance, and repair occupations (5%)
- Material moving occupations (5%)
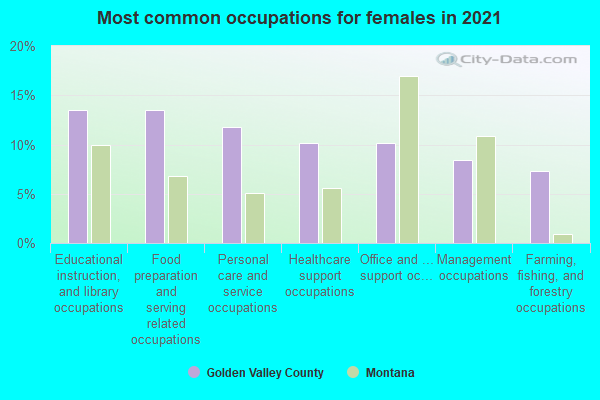
- Educational instruction, and library occupations (16%)
- Food preparation and serving related occupations (15%)
- Management occupations (9%)
- Office and administrative support occupations (9%)
- Farming, fishing, and forestry occupations (9%)
- Healthcare support occupations (8%)
- Personal care and service occupations (6%)
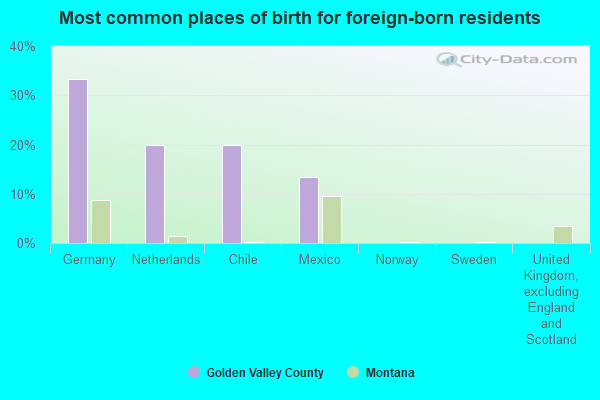
- Netherlands (27%)
- Germany (18%)
- Chile (18%)
- Mexico (9%)
- Norway (0%)
- Sweden (0%)
- United Kingdom, excluding England and Scotland (0%)
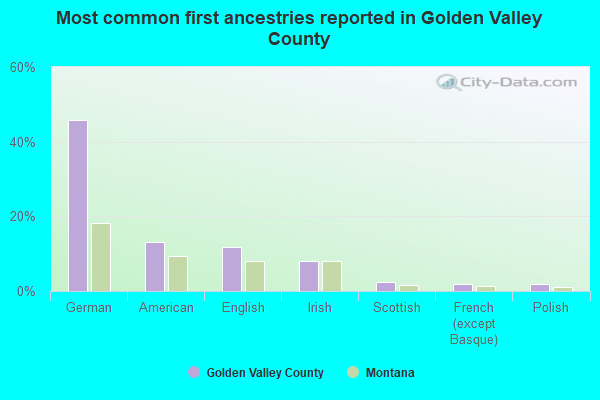
- German (44%)
- American (14%)
- English (12%)
- Irish (8%)
- Dutch (3%)
- Scottish (2%)
- Czech (2%)
162 people in agriculture workers' dormitories on farms
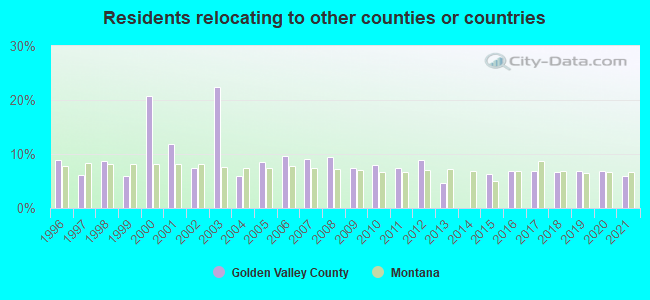
6.37% of this county's 2021 resident taxpayers lived in other counties in 2020 ($51,583 average adjusted gross income)
| Here: | 6.37% |
| Montana average: | 8.17% |
10 or fewer of this county's residents moved from foreign countries.
6.37% relocated from other counties in Montana ($51,583 average AGI)
10 or fewer of this county's residents relocated from other states.
5.87% of this county's 2020 resident taxpayers moved to other counties in 2021 ($57,545 average adjusted gross income)
| Here: | 5.87% |
| Montana average: | 6.62% |
10 or fewer of this county's residents moved to foreign countries.
5.87% relocated to other counties in Montana ($57,545 average AGI)
10 or fewer of this county's residents relocated to other states.
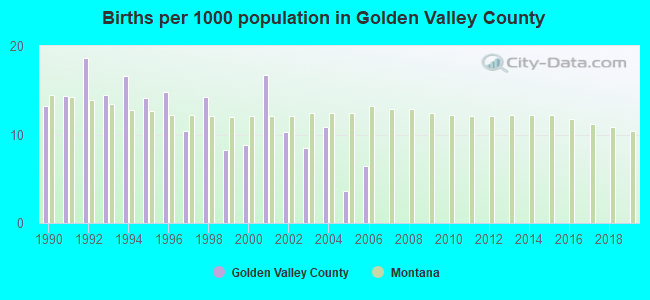
Births per 1000 population from 1990 to 1999: 13.9
Births per 1000 population from 2000 to 2006: 9.3
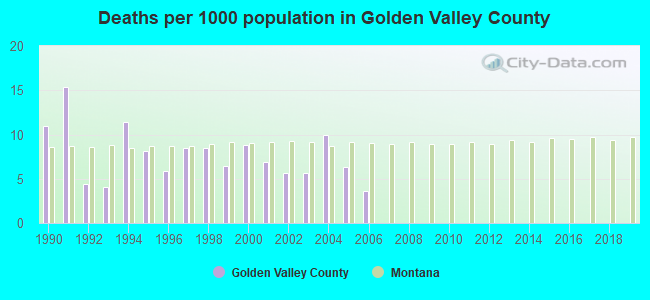
Deaths per 1000 population from 1990 to 1999: 8.4
Deaths per 1000 population from 2000 to 2009: 4.7
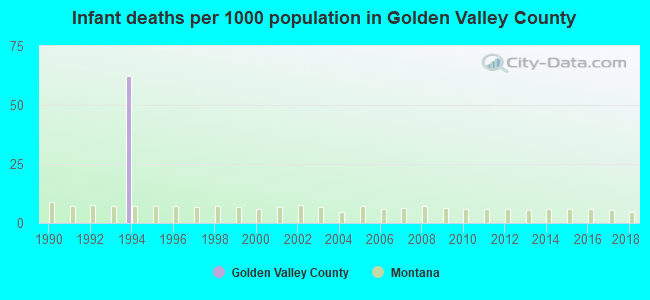
Infant deaths per 1000 live births from 1990 to 1999: 6.2
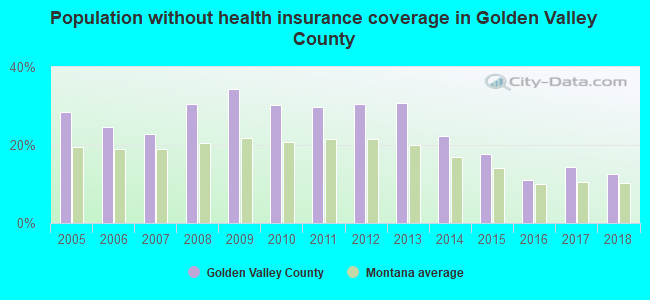
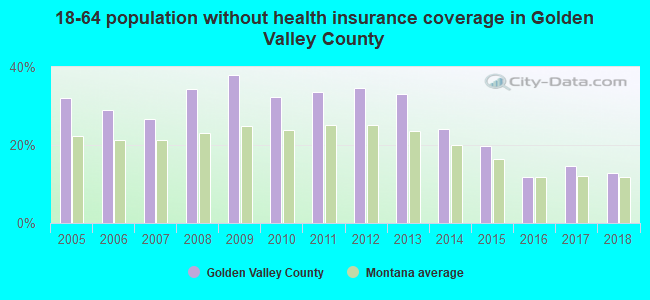
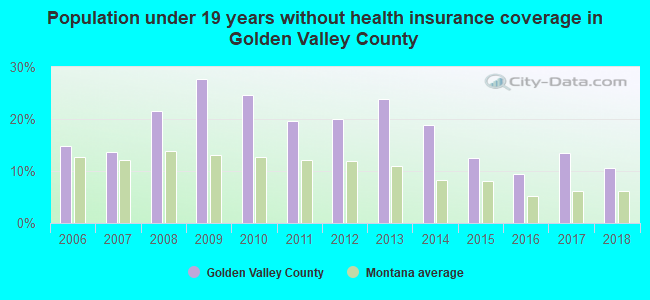
Persons under 19 years old without health insurance coverage in 2018: 10.6%
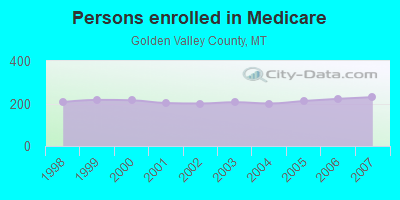
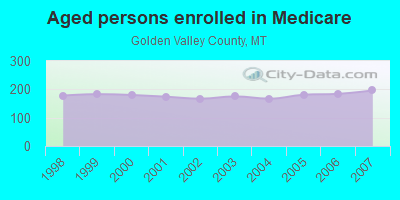
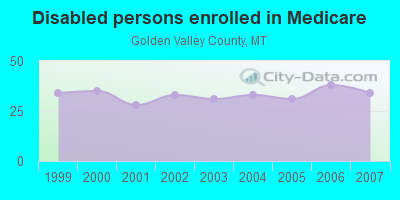
Persons enrolled in hospital insurance and/or supplemental medical insurance (Medicare) in July 1, 2007: 230 (196 aged, 34 disabled)
Children under 18 without health insurance coverage in 2007: 31 (12%)
Population without health insurance coverage in 2000: 25%
Children under 18 without health insurance coverage in 2000: 25%
Medical specialist MDs per 100,000 population in 2005: 1,467
Crimes per 100,000 population in 1996: 1
Household type by relationship:
Households: 864- Male householders: 203 (77 living alone), Female householders: 166 (63 living alone)
200 spouses (200 opposite-sex spouses), 55 unmarried partners, (55 opposite-sex unmarried partners), 202 children (200 natural, 0 adopted, 1 stepchildren), 0 grandchildren, 0 brothers or sisters, 7 parents, 0 foster children, 3 other relatives, 14 non-relatives
- In group quarters: 15
Size of family households: 139 2-persons, 26 3-persons, 21 4-persons, 12 5-persons, 8 6-persons, 3 7-or-more-persons.
Size of nonfamily households: 141 1-person, 14 2-persons, 2 3-persons.
123 married couples with children.
10 single-parent households (7 men, 3 women).
95.2% of residents of Golden Valley speak English at home.
1.7% of residents speak Spanish at home (43% speak English very well, 57% speak English well).
3.2% of residents speak other Indo-European language at home (85% speak English very well, 15% speak English well).
0.2% of residents speak other language at home (100% speak English very well).
In fiscal year 2004:
Federal Government expenditure: $10,790,000 ($9,660 per capita)
Department of Defense expenditure: $159,000
Federal direct payments to individuals for retirement and disability: $3,207,000
Federal other direct payments to individuals: $1,196,000
Federal direct payments not to individuals: $4,430,000
Federal grants: $1,536,000
Federal procurement contracts: $106,000 ($0,000 Department of Defense)
Federal salaries and wages: $314,000 ($0,000 Department of Defense)
Federal Government direct loans: $822,000
Federal guaranteed/insured loans: $742,000
Federal Government insurance: $3,634,000
Population change from April 1, 2000 to July 1, 2005:
Births: 59| Here: | 51 per 1000 residents |
| State: | 62 per 1000 residents |
Deaths: 36
| Here: | 31 per 1000 residents |
| State: | 47 per 1000 residents |
Net international migration: -1
| Here: | |
| State: |
Net internal migration: +99
| Here: | +85 per 1000 residents |
| State: | +20 per 1000 residents |
Total withdrawal of fresh water for public supply: 0.09 millions of gallons per day (11% from ground, 89% from surface)
| Here: | 6.0 |
| State: | 6.4 |
| Here: | 4.9 |
| State: | 4.2 |
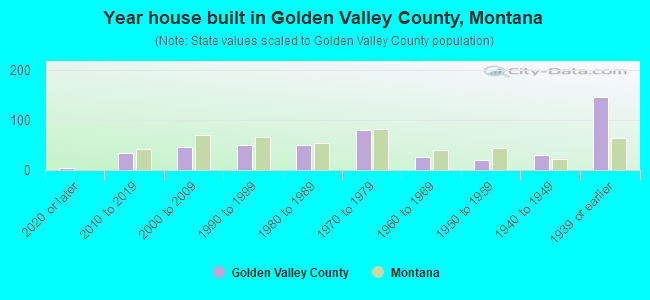
- Year house built in Golden Valley County, Montana
- 42020 or later
- 352010 to 2019
- 372000 to 2009
- 631990 to 1999
- 411980 to 1989
- 711970 to 1979
- 281960 to 1969
- 251950 to 1959
- 311940 to 1949
- 1301939 or earlier
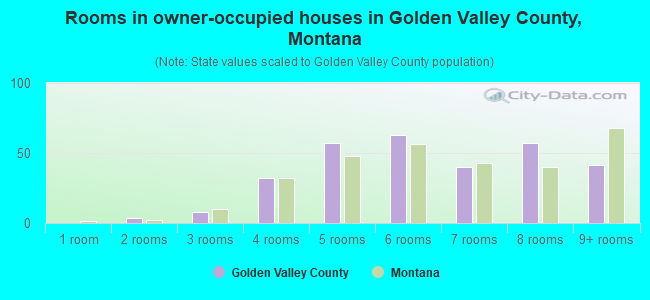
- Rooms in owner-occupied houses in Golden Valley County, Montana
- 01 room
- 12 rooms
- 173 rooms
- 394 rooms
- 645 rooms
- 686 rooms
- 427 rooms
- 398 rooms
- 489+ rooms
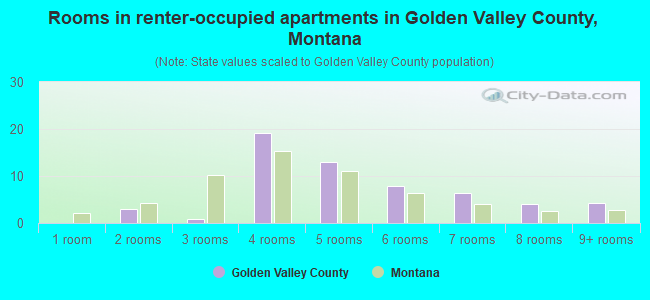
- Rooms in renter-occupied apartments in Golden Valley County, Montana
- 01 room
- 02 rooms
- 43 rooms
- 174 rooms
- 125 rooms
- 116 rooms
- 37 rooms
- 48 rooms
- 29+ rooms
- Bedrooms in owner-occupied houses in Golden Valley County, Montana
- 0no bedroom
- 301 bedroom
- 912 bedrooms
- 1363 bedrooms
- 344 bedrooms
- 245+ bedrooms
- Bedrooms in renter-occupied apartments in Golden Valley County, Montana
- 0no bedroom
- 21 bedroom
- 372 bedrooms
- 123 bedrooms
- 24 bedrooms
- 15+ bedrooms
- Cars and other vehicles available in Golden Valley County in owner-occupied houses/condos
- 8no vehicle
- 801 vehicle
- 1032 vehicles
- 733 vehicles
- 334 vehicles
- 215+ vehicles

- Cars and other vehicles available in Golden Valley County in renter-occupied apartments
- 1no vehicle
- 151 vehicle
- 262 vehicles
- 83 vehicles
- 04 vehicles
- 45+ vehicles
96.2% of Golden Valley County residents lived in the same house 1 years ago.
Out of people who lived in different houses, 18% lived in this county.
Out of people who lived in different counties, 47% lived in Montana.
| Golden Valley County: | 96.2% |
| State average: | 86.7% |
Place of birth for U.S.-born residents:
- This state: 448
- Other state: 396
- Northeast: 35
- Midwest: 91
- South: 82
- West: 189
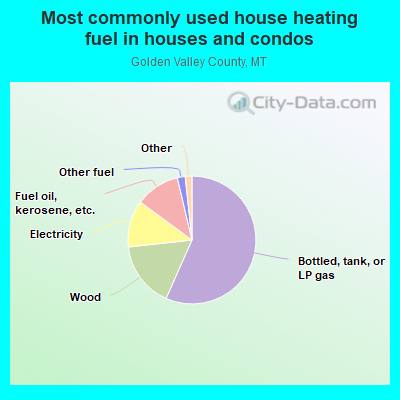
- 59.5%Bottled, tank, or LP gas
- 15.5%Wood
- 10.2%Electricity
- 9.2%Fuel oil, kerosene, etc.
- 2.3%Other fuel
- 2.0%Utility gas
- 0.7%Solar energy
- 0.7%No fuel used
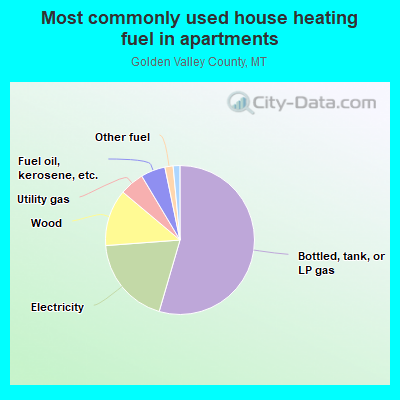
- 62.7%Bottled, tank, or LP gas
- 11.8%Electricity
- 9.8%Fuel oil, kerosene, etc.
- 7.8%Wood
- 5.9%Utility gas
- 2.0%Other fuel
Private vs. public school enrollment:
| Here: | 14.5% |
| Montana: | 15.3% |
| Here: | 12.5% |
| Montana: | 12.2% |
| Here: | 0.0% |
| Montana: | 15.0% |
Golden Valley County government finances - Expenditure in 2020:
- Charges - Other: $103,000
Other: $7,000
Regular Highways: $2,000
- Current Operations - Regular Highways: $419,000
Regular Highways: $396,000
General - Other: $371,000
Police Protection: $250,000
Police Protection: $233,000
Financial Administration: $183,000
Central Staff Services: $148,000
Judicial and Legal Services: $116,000
General Public Buildings: $98,000
Health - Other: $97,000
General - Other: $92,000
Financial Administration: $80,000
Natural Resources - Other: $62,000
Health - Other: $43,000
Local Fire Protection: $32,000
Central Staff Services: $27,000
Public Welfare - Other: $27,000
Public Welfare - Other: $26,000
Judicial and Legal Services: $19,000
Local Fire Protection: $18,000
- Federal Intergovernmental - General Local Government Support: $74,000
Highways: $19,000
Other: $5,000
- General - Interest on Debt: $1,000
Interest on Debt: $1,000
- Intergovernmental to Local - Other - Elementary and Secondary Education: $269,000
Other - Elementary and Secondary Education: $260,000
- Long Term Debt - Beginning Outstanding - Unspecified Public Purpose: $22,000
Outstanding Unspecified Public Purpose: $16,000
Retired Unspecified Public Purpose: $6,000
- Miscellaneous - General Revenue - Other: $55,000
General Revenue - Other: $53,000
Interest Earnings: $48,000
Interest Earnings: $47,000
Rents: $11,000
Fines and Forfeits: $11,000
Fines and Forfeits: $8,000
Royalties: $6,000
Donations From Private Sources: $1,000
- Other Funds - Cash and Securities: $1,340,000
Cash and Securities: $1,248,000
- State Intergovernmental - Other: $275,000
Other: $275,000
General Local Government Support: $136,000
Highways: $42,000
General Local Government Support: $41,000
Highways: $22,000
- Tax - Property: $979,000
Property: $909,000
Other License: $1,000
- Total Salaries and Wages: $709,000
: $687,000
Golden Valley County government finances - Revenue in 2020:
- Charges - Other: $103,000
Other: $7,000
Regular Highways: $2,000
- Current Operations - Regular Highways: $419,000
Regular Highways: $396,000
General - Other: $371,000
Police Protection: $250,000
Police Protection: $233,000
Financial Administration: $183,000
Central Staff Services: $148,000
Judicial and Legal Services: $116,000
General Public Buildings: $98,000
Health - Other: $97,000
General - Other: $92,000
Financial Administration: $80,000
Natural Resources - Other: $62,000
Health - Other: $43,000
Local Fire Protection: $32,000
Central Staff Services: $27,000
Public Welfare - Other: $27,000
Public Welfare - Other: $26,000
Judicial and Legal Services: $19,000
Local Fire Protection: $18,000
- Federal Intergovernmental - General Local Government Support: $74,000
Highways: $19,000
Other: $5,000
- General - Interest on Debt: $1,000
Interest on Debt: $1,000
- Intergovernmental to Local - Other - Elementary and Secondary Education: $269,000
Other - Elementary and Secondary Education: $260,000
- Long Term Debt - Beginning Outstanding - Unspecified Public Purpose: $22,000
Outstanding Unspecified Public Purpose: $16,000
Retired Unspecified Public Purpose: $6,000
- Miscellaneous - General Revenue - Other: $55,000
General Revenue - Other: $53,000
Interest Earnings: $48,000
Interest Earnings: $47,000
Rents: $11,000
Fines and Forfeits: $11,000
Fines and Forfeits: $8,000
Royalties: $6,000
Donations From Private Sources: $1,000
- Other Funds - Cash and Securities: $1,340,000
Cash and Securities: $1,248,000
- State Intergovernmental - Other: $275,000
Other: $275,000
General Local Government Support: $136,000
Highways: $42,000
General Local Government Support: $41,000
Highways: $22,000
- Tax - Property: $979,000
Property: $909,000
Other License: $1,000
- Total Salaries and Wages: $709,000
: $687,000
Golden Valley County government finances - Debt in 2020:
- Charges - Other: $103,000
Other: $7,000
Regular Highways: $2,000
- Current Operations - Regular Highways: $419,000
Regular Highways: $396,000
General - Other: $371,000
Police Protection: $250,000
Police Protection: $233,000
Financial Administration: $183,000
Central Staff Services: $148,000
Judicial and Legal Services: $116,000
General Public Buildings: $98,000
Health - Other: $97,000
General - Other: $92,000
Financial Administration: $80,000
Natural Resources - Other: $62,000
Health - Other: $43,000
Local Fire Protection: $32,000
Central Staff Services: $27,000
Public Welfare - Other: $27,000
Public Welfare - Other: $26,000
Judicial and Legal Services: $19,000
Local Fire Protection: $18,000
- Federal Intergovernmental - General Local Government Support: $74,000
Highways: $19,000
Other: $5,000
- General - Interest on Debt: $1,000
Interest on Debt: $1,000
- Intergovernmental to Local - Other - Elementary and Secondary Education: $269,000
Other - Elementary and Secondary Education: $260,000
- Long Term Debt - Beginning Outstanding - Unspecified Public Purpose: $22,000
Outstanding Unspecified Public Purpose: $16,000
Retired Unspecified Public Purpose: $6,000
- Miscellaneous - General Revenue - Other: $55,000
General Revenue - Other: $53,000
Interest Earnings: $48,000
Interest Earnings: $47,000
Rents: $11,000
Fines and Forfeits: $11,000
Fines and Forfeits: $8,000
Royalties: $6,000
Donations From Private Sources: $1,000
- Other Funds - Cash and Securities: $1,340,000
Cash and Securities: $1,248,000
- State Intergovernmental - Other: $275,000
Other: $275,000
General Local Government Support: $136,000
Highways: $42,000
General Local Government Support: $41,000
Highways: $22,000
- Tax - Property: $979,000
Property: $909,000
Other License: $1,000
- Total Salaries and Wages: $709,000
: $687,000
Golden Valley County government finances - Cash and Securities in 2020:
- Charges - Other: $103,000
Other: $7,000
Regular Highways: $2,000
- Current Operations - Regular Highways: $419,000
Regular Highways: $396,000
General - Other: $371,000
Police Protection: $250,000
Police Protection: $233,000
Financial Administration: $183,000
Central Staff Services: $148,000
Judicial and Legal Services: $116,000
General Public Buildings: $98,000
Health - Other: $97,000
General - Other: $92,000
Financial Administration: $80,000
Natural Resources - Other: $62,000
Health - Other: $43,000
Local Fire Protection: $32,000
Central Staff Services: $27,000
Public Welfare - Other: $27,000
Public Welfare - Other: $26,000
Judicial and Legal Services: $19,000
Local Fire Protection: $18,000
- Federal Intergovernmental - General Local Government Support: $74,000
Highways: $19,000
Other: $5,000
- General - Interest on Debt: $1,000
Interest on Debt: $1,000
- Intergovernmental to Local - Other - Elementary and Secondary Education: $269,000
Other - Elementary and Secondary Education: $260,000
- Long Term Debt - Beginning Outstanding - Unspecified Public Purpose: $22,000
Outstanding Unspecified Public Purpose: $16,000
Retired Unspecified Public Purpose: $6,000
- Miscellaneous - General Revenue - Other: $55,000
General Revenue - Other: $53,000
Interest Earnings: $48,000
Interest Earnings: $47,000
Rents: $11,000
Fines and Forfeits: $11,000
Fines and Forfeits: $8,000
Royalties: $6,000
Donations From Private Sources: $1,000
- Other Funds - Cash and Securities: $1,340,000
Cash and Securities: $1,248,000
- State Intergovernmental - Other: $275,000
Other: $275,000
General Local Government Support: $136,000
Highways: $42,000
General Local Government Support: $41,000
Highways: $22,000
- Tax - Property: $979,000
Property: $909,000
Other License: $1,000
- Total Salaries and Wages: $709,000
: $687,000
Supplemental Security Income (SSI) in 2006:
- Total number of recipients: 12
- Number of aged recipients: 0
- Number of blind and disabled recipients: 0
- Number of recipients under 18: 0
- Number of recipients between 18 and 64: 0
- Number of recipients older than 64: 0
- Number of recipients also receiving OASDI: 0
- Amount of payments (thousands of dollars): 4
| Most common first names in Golden Valley County, MT among deceased individuals | ||
| Name | Count | Lived (average) |
|---|---|---|
| John | 9 | 82.8 years |
| James | 9 | 68.7 years |
| Margaret | 7 | 77.4 years |
| Robert | 7 | 64.9 years |
| William | 5 | 78.4 years |
| Henry | 4 | 88.2 years |
| Anna | 4 | 83.5 years |
| Mary | 4 | 75.5 years |
| Carl | 3 | 87.0 years |
| Harold | 3 | 78.1 years |
| Most common last names in Golden Valley County, MT among deceased individuals | ||
| Last name | Count | Lived (average) |
|---|---|---|
| Anderson | 7 | 79.0 years |
| Zeier | 6 | 87.0 years |
| Fiske | 5 | 72.6 years |
| Lehfeldt | 5 | 81.4 years |
| Johnson | 4 | 88.0 years |
| Krause | 4 | 76.7 years |
| Schaff | 4 | 71.5 years |
| Stephenson | 3 | 83.3 years |
| Horpestad | 3 | 72.7 years |
| Larson | 3 | 80.0 years |
Golden Valley County on our top lists:
- #25 on the list of "Top 101 counties with the lowest ground withdrawal of fresh water for public supply"
- #50 on the list of "Top 101 counties with the lowest surface withdrawal of fresh water for public supply"
- #53 on the list of "Top 101 counties with highest percentage of residents voting for 3rd party candidates in the 2012 Presidential Election"
- #75 on the list of "Top 101 counties with the lowest total withdrawal of fresh water for public supply"