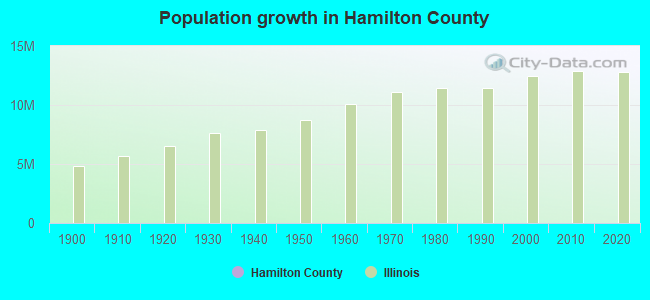
Hamilton County, Illinois (IL)
County owner-occupied free and clear houses and condos in 2010: 1,511
County owner-occupied houses and condos in 2000: 2,822
Renter-occupied apartments: 717 (it was 640 in 2000)
| % of renters here: | 18% |
| State: | 33% |
Land area: 435 sq. mi.
Water area: 0.7 sq. mi.
Population density: 18 people per square mile (low).
Industries providing employment: Educational, health and social services (25.5%), Agriculture,forestry,fishing and hunting, and mining (16.9%), Manufacturing (11.8%), Retail trade (10.5%).
Type of workers:
- Private wage or salary: 76%
- Government: 14%
- Self-employed, not incorporated: 9%
- Unpaid family work: 0%
- OSM Map
- General Map
- Google Map
- MSN Map

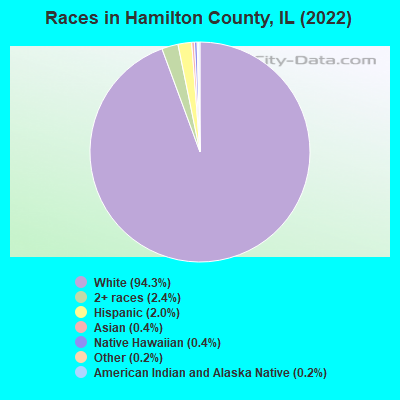
- 7,36994.3%White Non-Hispanic Alone
- 1852.4%Two or more races
- 1592.0%Hispanic or Latino
- 340.4%Asian alone
- 310.4%Native Hawaiian and Other
Pacific Islander alone - 150.2%Some other race alone
- 130.2%American Indian and Alaska Native alone
- 70.09%Black Non-Hispanic Alone
| Median resident age: | 43.4 years |
| Illinois median age: | 39.1 years |
| Males: 3,911 | |
| Females: 3,986 |

 | Thinking of moving to Illinois (77 replies) |
| Chicago Suburbs Real Estate (111 replies) |
| Illinois 2nd Worst Run State in America (36 replies) |
| Chicago 2030….and the pecking order (89 replies) |
| Many people are leaving Illinois (313 replies) |
| Chicago= New Detroit? (59 replies) |
| Hamilton County: | 2.0 people |
| Illinois: | 3 people |
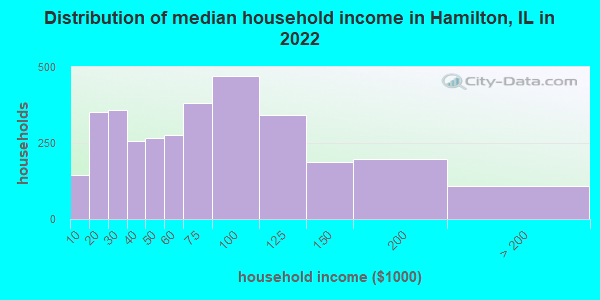
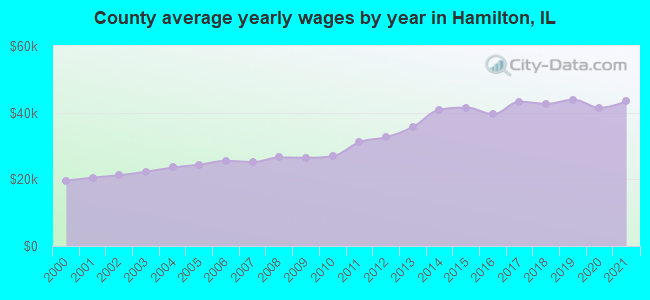
Estimated median household income in 2022: $59,241 ($30,496 in 1999)
| This county: | $59,241 |
| Illinois: | $76,708 |
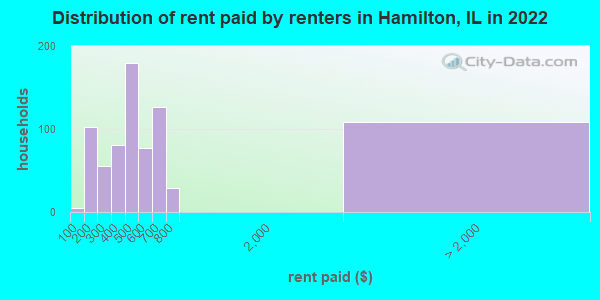
Median contract rent in 2022 for apartments: $460 (lower quartile is $306, upper quartile is $583)
| This county: | $460 |
| State: | $1008 |
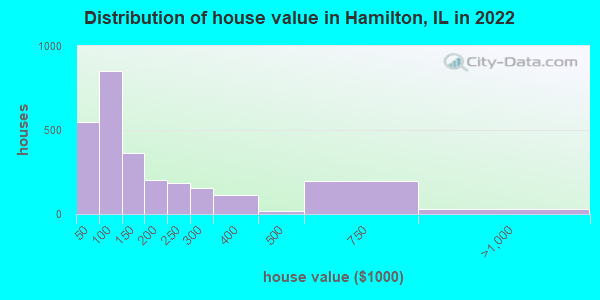
Estimated median house or condo value in 2022: $105,544 (it was $48,100 in 2000)
| Hamilton: | $105,544 |
| Illinois: | $251,600 |
Mean price in 2022:
Median monthly housing costs for homes and condos with a mortgage: $1,026Detached houses: $122,413
Here: $122,413 State: $310,164 Mobile homes: $92,555
Here: $92,555 State: $78,855
Median monthly housing costs for units without a mortgage: $519
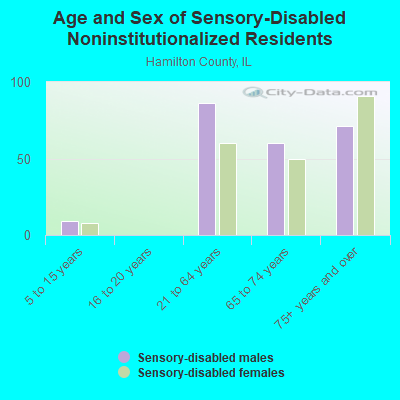
Institutionalized population: 77
Crime in 2020 (reported by the sheriff's office or county police, not the county total):
- Murders: 0
- Rapes: 0
- Robberies: 0
- Assaults: 0
- Burglaries: 4
- Thefts: 4
- Auto thefts: 1
Crime in 2019 (reported by the sheriff's office or county police, not the county total):
- Murders: 0
- Rapes: 3
- Robberies: 0
- Assaults: 4
- Burglaries: 6
- Thefts: 33
- Auto thefts: 3
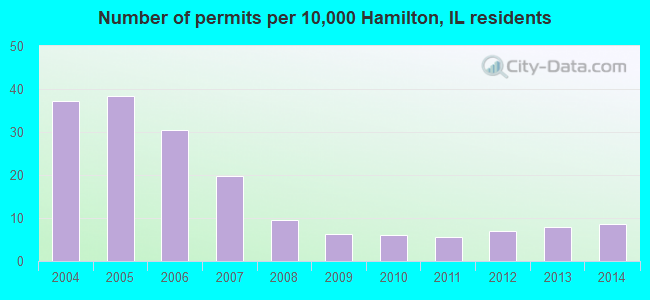
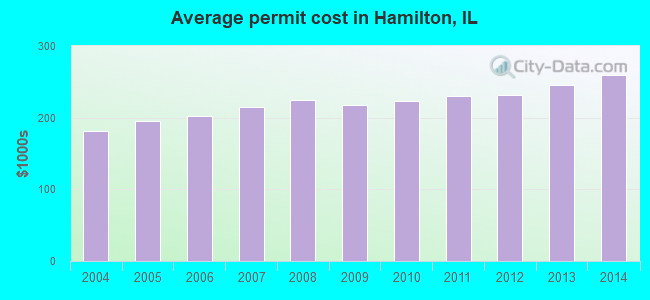
Single-family new house construction building permits:
- 2014: 0 buildings
- 2013: 0 buildings
- 2012: 0 buildings
- 2011: 0 buildings
- 2010: 0 buildings
- 2009: 0 buildings
- 2008: 0 buildings
- 2007: 0 buildings
- 2006: 0 buildings
- 2005: 0 buildings
- 2004: 0 buildings
Median real estate property taxes paid for housing units with mortgages in 2022: $1,335 (1.4%)
Median real estate property taxes paid for housing units with no mortgage in 2022: $1,297 (1.1%)
| Hamilton County: | 13.1% |
| Illinois: | 11.9% |
Median age of residents in 2022: 43.4 years old
(Males: 42.3 years old, Females: 45.3 years old)
(Median age for: White residents: 44.6 years old, Asian residents: 100.9 years old, Hispanic or Latino residents: 29.6 years old, Other race residents: 39.5 years old)
Fair market rent in 2006 for a 1-bedroom apartment in Hamilton County is $408 a month.
Fair market rent for a 2-bedroom apartment is $492 a month.
Fair market rent for a 3-bedroom apartment is $648 a month.
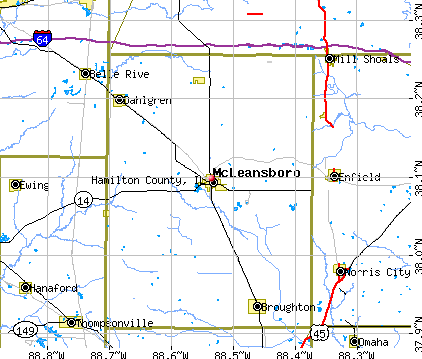
Cities in this county include: McLeansboro, Dahlgren, Broughton, Belle Prairie City.
2023 air pollution in Hamilton County:
Ozone (1-hour): 0.035 ppm (standard limit: 0.12 ppm). Near U.S. average.
Particulate Matter (PM2.5) Annual: 10.0 µg/m3(standard limit: 15.0 µg/m3). Near U.S. average.
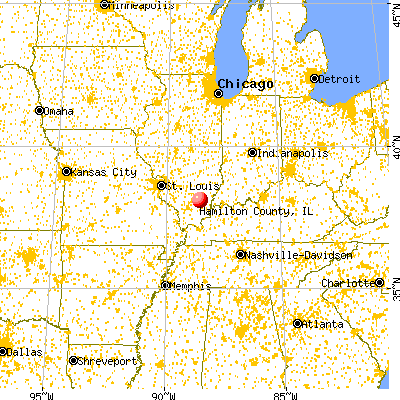
Neighboring counties: Floyd County, Indiana  , Huerfano County, Colorado
  , Mingo County, West Virginia , Henry County, Kentucky , Jefferson County, Kentucky , Meade County, Kentucky , Sedgwick County, Kansas .
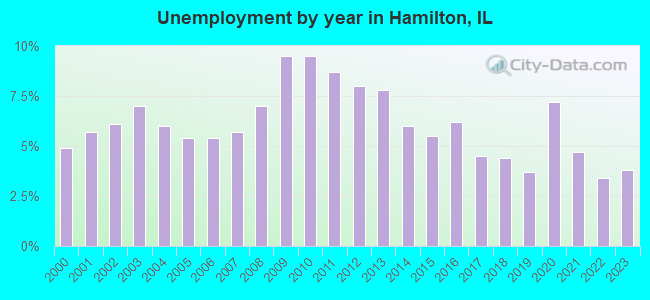
| Here: | 3.8% |
| Illinois: | 4.2% |
Current college students: 324
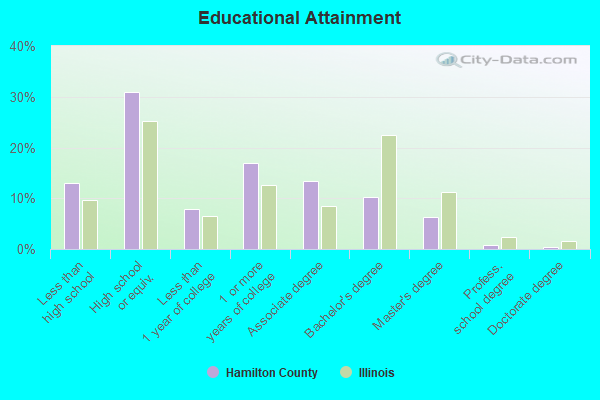
People 25 years of age or older with a high school degree or higher: 86.3%
People 25 years of age or older with a bachelor's degree or higher: 17.2%
Number of foreign born residents: 84 (82.5% naturalized citizens)
| Hamilton County: | 1.1% |
| Whole state: | 14.4% |
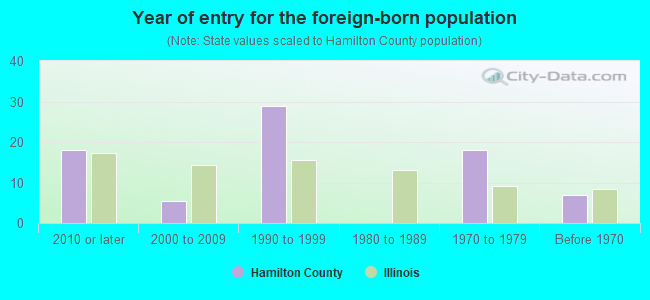
- Year of entry for the foreign-born population
- 182010 or later
- 52000 to 2009
- 291990 to 1999
- 01980 to 1989
- 181970 to 1979
- 7Before 1970
Mean travel time to work (commute): minutes
Percentage of county residents living and working in this county: 93.4%
Housing units in structures:
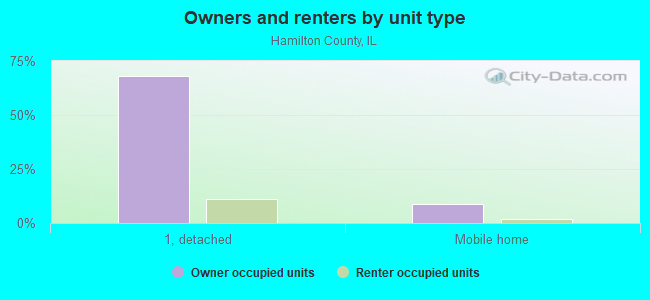
- One, detached: 2,830
- One, attached: 1
- Two: 31
- 3 or 4: 34
- 5 to 9: 80
- 10 to 19: 22
- 20 to 49: 10
- 50 or more: 21
- Mobile homes: 736
- Boats, RVs, vans, etc.: 15
Housing units in Hamilton County with a mortgage: 899 (17 second mortgage, 0 home equity loan, 17 both second mortgage and home equity loan)
Houses without a mortgage: 45
| Here: | 95.2% with mortgage |
| State: | 97.4% with mortgage |
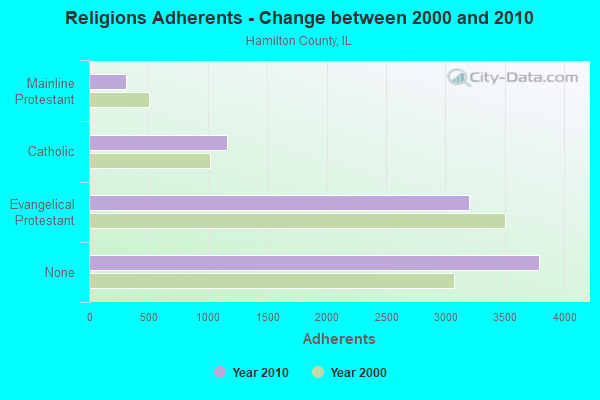
Religion statistics for Hamilton County
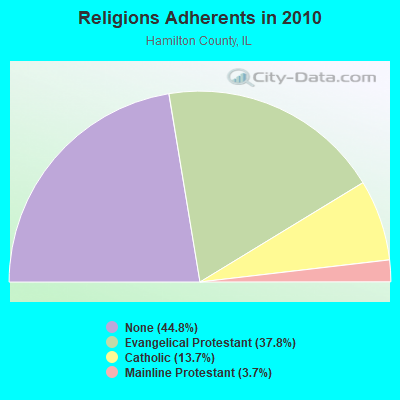
| Religion | Adherents | Congregations |
|---|---|---|
| Evangelical Protestant | 3,194 | 21 |
| Catholic | 1,159 | 3 |
| Mainline Protestant | 313 | 7 |
| Other | - | - |
| None | 3,791 | - |
Source: Clifford Grammich, Kirk Hadaway, Richard Houseal, Dale E.Jones, Alexei Krindatch, Richie Stanley and Richard H.Taylor. 2012. 2010 U.S.Religion Census: Religious Congregations & Membership Study. Association of Statisticians of American Religious Bodies. Jones, Dale E., et al. 2002. Congregations and Membership in the United States 2000. Nashville, TN: Glenmary Research Center.
Food Environment Statistics:
| Hamilton County: | 2.43 / 10,000 pop. |
| State: | 2.24 / 10,000 pop. |
| This county: | 1.22 / 10,000 pop. |
| Illinois: | 0.75 / 10,000 pop. |
| Hamilton County: | 2.43 / 10,000 pop. |
| Illinois: | 2.61 / 10,000 pop. |
| This county: | 2.43 / 10,000 pop. |
| State: | 6.86 / 10,000 pop. |
| Hamilton County: | 9.8% |
| Illinois: | 8.3% |
| Hamilton County: | 27.0% |
| State: | 25.2% |
| Here: | 13.3% |
| State: | 14.5% |
Agriculture in Hamilton County:
Average size of farms: 338 acresAverage value of agricultural products sold per farm: $42,538
Average value of crops sold per acre for harvested cropland: $152.68
The value of livestock, poultry, and their products as a percentage of the total market value of agricultural products sold: 10.89%
Average total farm production expenses per farm: $37,263
Harvested cropland as a percentage of land in farms: 73.53%
Average market value of all machinery and equipment per farm: $64,950
The percentage of farms operated by a family or individual: 92.65%
Average age of principal farm operators: 55 years
Average number of cattle and calves per 100 acres of all land in farms: 1.84
Corn for grain: 62937 harvested acres
All wheat for grain: 9677 harvested acres
Soybeans for beans: 95396 harvested acres
Earthquake activity:
Hamilton County-area historical earthquake activity is significantly above Illinois state average. It is 257% greater than the overall U.S. average.On 4/18/2008 at 09:36:59, a magnitude 5.4 (5.1 MB, 4.8 MS, 5.4 MW, 5.2 MW, Class: Moderate, Intensity: VI - VII) earthquake occurred 43.0 miles away from Hamilton County center
On 4/18/2008 at 09:36:59, a magnitude 5.2 (5.2 MW, Depth: 8.9 mi) earthquake occurred 43.0 miles away from the county center
On 6/10/1987 at 23:48:54, a magnitude 5.1 (4.9 MB, 4.4 MS, 4.6 MS, 5.1 LG) earthquake occurred 61.3 miles away from the county center
On 6/18/2002 at 17:37:15, a magnitude 5.0 (4.3 MB, 4.6 MW, 5.0 LG) earthquake occurred 41.9 miles away from the county center
On 9/26/1990 at 13:18:51, a magnitude 5.0 (4.7 MB, 4.8 LG, 5.0 LG, Depth: 7.7 mi) earthquake occurred 84.4 miles away from Hamilton County center
On 4/18/2008 at 15:14:16, a magnitude 4.8 (4.5 MB, 4.8 MW, 4.6 MW, Class: Light, Intensity: IV - V) earthquake occurred 45.7 miles away from the county center
Magnitude types: regional Lg-wave magnitude (LG), body-wave magnitude (MB), surface-wave magnitude (MS), moment magnitude (MW)
Most recent natural disasters:
- Illinois Covid-19 Pandemic, Incident Period: January 20, 2020, FEMA Id: 4489, Natural disaster type: Other
- Illinois Severe Storms and Flooding, Incident Period: April 19, 2011 to June 14, 2011, Major Disaster (Presidential) Declared DR-1991: June 07, 2011, FEMA Id: 1991, Natural disaster type: Storm, Flood
- Illinois Severe Storms, Flooding, and Tornadoes, Incident Period: May 08, 2009 to May 09, 2009, Major Disaster (Presidential) Declared DR-1850: July 02, 2009, FEMA Id: 1850, Natural disaster type: Storm, Tornado, Flood
- Illinois Hurricane Katrina Evacuation, Incident Period: August 29, 2005 to October 01, 2005, Emergency Declared EM-3230: September 07, 2005, FEMA Id: 3230, Natural disaster type: Hurricane
- Illinois Snow, Incident Period: December 21, 2004 to December 23, 2004, Emergency Declared EM-3199: February 01, 2005, FEMA Id: 3199, Natural disaster type: Snow
- Illinois Severe Storms, Tornadoes, and Flooding, Incident Period: April 21, 2002 to May 23, 2002, Major Disaster (Presidential) Declared DR-1416: May 21, 2002, FEMA Id: 1416, Natural disaster type: Storm, Tornado, Flood
- Illinois Severe Storms/Flooding, Incident Period: April 28, 1996 to May 17, 1996, Major Disaster (Presidential) Declared DR-1112: May 06, 1996, FEMA Id: 1112, Natural disaster type: Storm, Flood
- Illinois Flooding, Severe Storm, Tornado, Incident Period: May 15, 1990 to July 03, 1990, Major Disaster (Presidential) Declared DR-871: June 22, 1990, FEMA Id: 871, Natural disaster type: Storm, Tornado, Flood
- Illinois SEVERE STORMS, TORNADOES, Incident Period: January 07, 1989, Major Disaster (Presidential) Declared DR-819: January 13, 1989, FEMA Id: 819, Natural disaster type: Storm, Tornado
The number of natural disasters in Hamilton County (9) is smaller than the US average (15).
Major Disasters (Presidential) Declared: 6
Emergencies Declared: 2
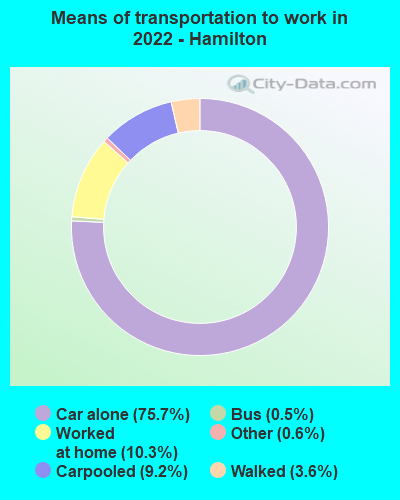
Means of transportation to work:
- Drove a car alone: 1,483 (73.0%)
- Carpooled: 192 (9.4%)
- Bus: 9 (0.4%)
- Taxicab, motorcycle, or other means: 12 (0.6%)
- Walked: 72 (3.5%)
- Worked at home: 274 (13.5%)

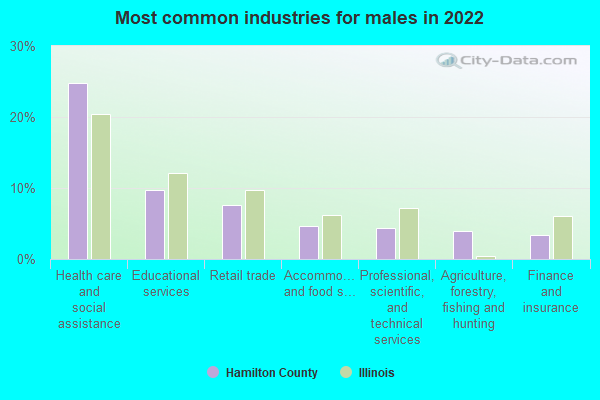
- Health care and social assistance (25%)
- Educational services (10%)
- Retail trade (8%)
- Accommodation and food services (5%)
- Professional, scientific, and technical services (4%)
- Agriculture, forestry, fishing and hunting (4%)
- Finance and insurance (3%)
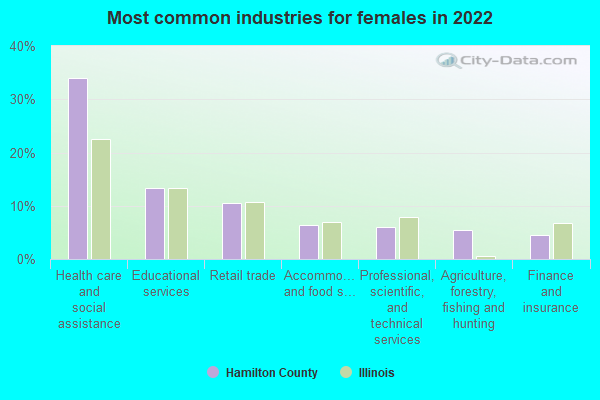
- Health care and social assistance (34%)
- Educational services (13%)
- Retail trade (10%)
- Accommodation and food services (6%)
- Professional, scientific, and technical services (6%)
- Agriculture, forestry, fishing and hunting (5%)
- Finance and insurance (5%)
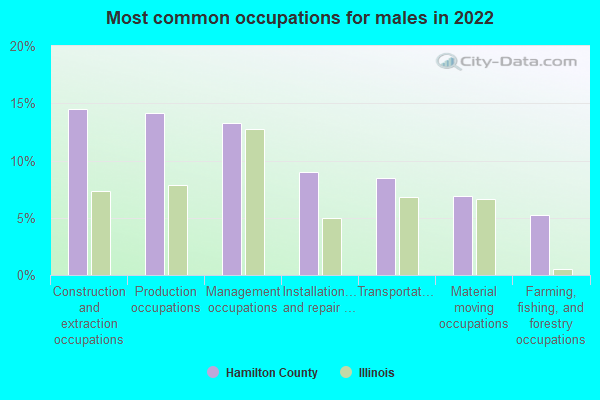
- Construction and extraction occupations (14%)
- Production occupations (14%)
- Management occupations (13%)
- Installation, maintenance, and repair occupations (9%)
- Transportation occupations (8%)
- Material moving occupations (7%)
- Farming, fishing, and forestry occupations (5%)
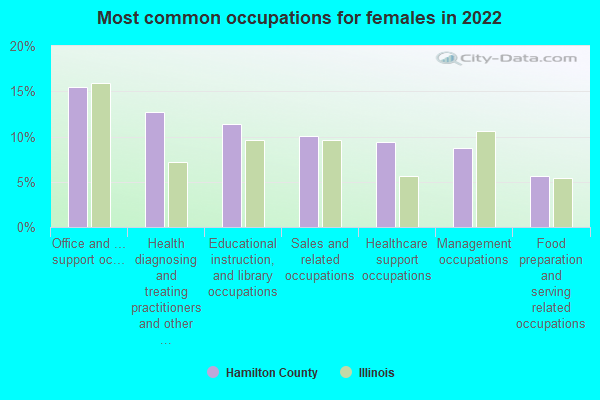
- Office and administrative support occupations (15%)
- Health diagnosing and treating practitioners and other technical occupations (13%)
- Educational instruction, and library occupations (11%)
- Sales and related occupations (10%)
- Healthcare support occupations (9%)
- Management occupations (9%)
- Food preparation and serving related occupations (6%)
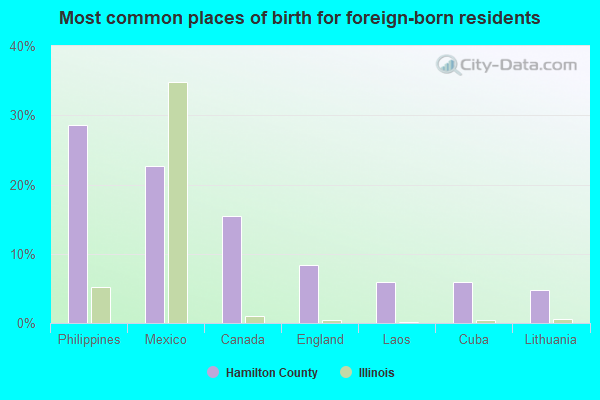
- Philippines (29%)
- Mexico (23%)
- Canada (15%)
- England (8%)
- Laos (6%)
- Cuba (6%)
- Lithuania (5%)
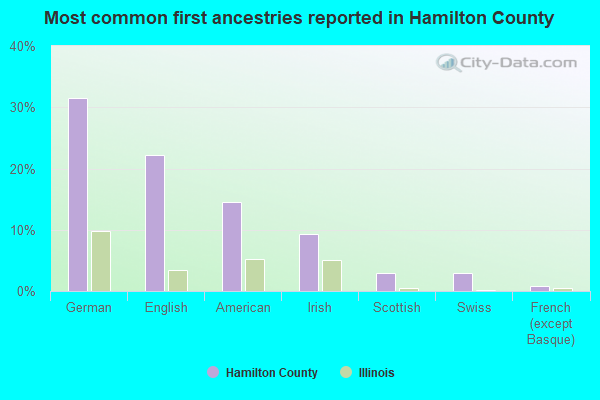
- German (32%)
- English (22%)
- American (15%)
- Irish (9%)
- Scottish (3%)
- Swiss (3%)
- French (except Basque) (1%)

40 people in group homes intended for adults
People in group quarters in Hamilton County, Illinois in 2000:
- 163 people in nursing homes
- 22 people in homes or halfway houses for drug/alcohol abuse
- 19 people in homes for the mentally retarded
4.18% of this county's 2021 resident taxpayers lived in other counties in 2020 ($49,535 average adjusted gross income)
| Here: | 4.18% |
| Illinois average: | 5.09% |
10 or fewer of this county's residents moved from foreign countries.
4.18% relocated from other counties in Illinois ($49,535 average AGI)
10 or fewer of this county's residents relocated from other states.
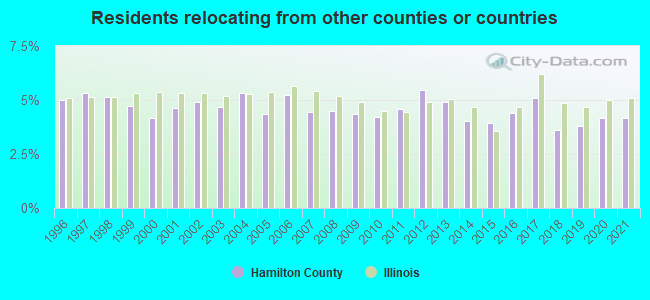
Top counties from which taxpayers relocated into this county between 2020 and 2021:
| from Jefferson County, IL | |
| from White County, IL |
4.62% of this county's 2020 resident taxpayers moved to other counties in 2021 ($34,184 average adjusted gross income)
| Here: | 4.62% |
| Illinois average: | 6.10% |
10 or fewer of this county's residents moved to foreign countries.
4.62% relocated to other counties in Illinois ($34,184 average AGI)
10 or fewer of this county's residents relocated to other states.
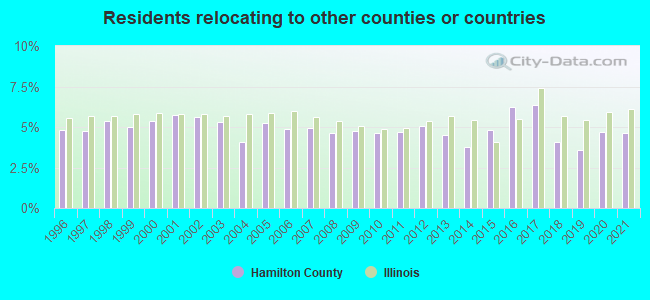
Top counties to which taxpayers relocated from this county between 2020 and 2021:
| to Jefferson County, IL | |
| to Franklin County, IL |
Births per 1000 population from 1990 to 1999: 11.0
Births per 1000 population from 2000 to 2006: 10.3

Deaths per 1000 population from 1990 to 1999: 13.2
Deaths per 1000 population from 2000 to 2009: 12.4
Deaths per 1000 population from 2010 to 2020: 13.4

Infant deaths per 1000 live births from 1990 to 1999: 3.3
Infant deaths per 1000 live births from 2000 to 2006: 11.4

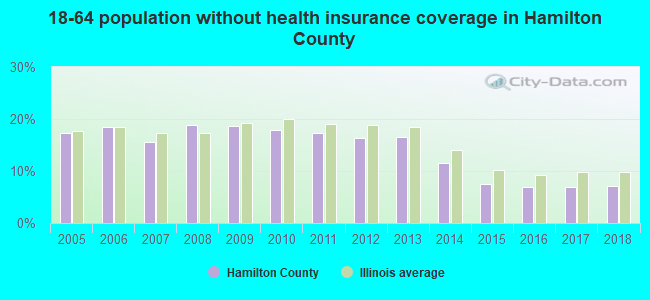
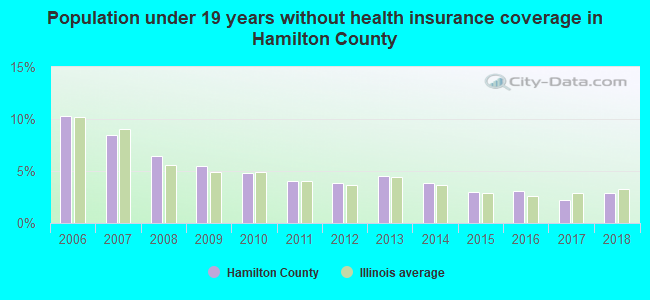
Persons under 19 years old without health insurance coverage in 2018: 2.9%


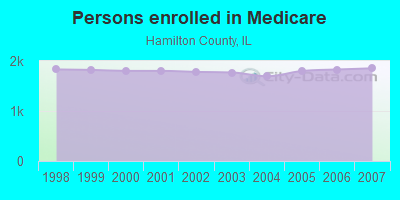
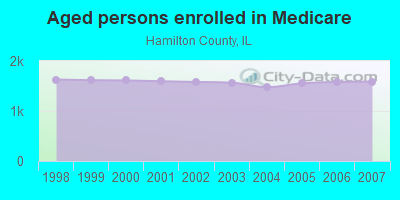
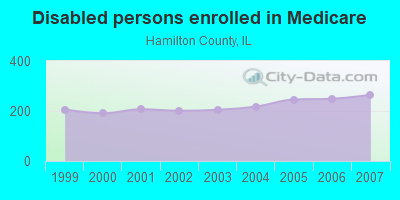
Persons enrolled in hospital insurance and/or supplemental medical insurance (Medicare) in July 1, 2007: 1,854 (1,589 aged, 265 disabled)
Children under 18 without health insurance coverage in 2007: 116 (6%)
Most common underlying causes of death in Hamilton County, Illinois in 1999 - 2019:
- Acute myocardial infarction, unspecified (264)
- Congestive heart failure (224)
- Bronchus or lung, unspecified - Malignant neoplasms (64)
- Chronic obstructive pulmonary disease, unspecified (36)
- Cardiac arrest, unspecified (16)
Population without health insurance coverage in 2000: 12%
Children under 18 without health insurance coverage in 2000: 10%
Short term general hospital admissions per 100,000 population in 2004: 10,536
Short term general hospital beds per 100,000 population in 2004: 1,012
Emergency room visits per 100,000 population in 2004: 30,000
General practice office based MDs per 100,000 population in 2005: 904
Medical specialist MDs per 100,000 population in 2005: 1,409
Dentists per 100,000 population in 1998: 12
Total births per 100,000 population, July 2005 - July 2006 : 12
Total deaths per 100,000 population, July 2005 - July 2006: 36
Household type by relationship:
Households: 7,897- Male householders: 1,496 (326 living alone), Female householders: 1,836 (592 living alone)
1,646 spouses (1,646 opposite-sex spouses), 230 unmarried partners, (230 opposite-sex unmarried partners), 2,240 children (2,133 natural, 49 adopted, 56 stepchildren), 36 grandchildren, 20 brothers or sisters, 65 parents, 0 foster children, 39 other relatives, 199 non-relatives
- In group quarters: 111
Size of family households: 1,082 2-persons, 449 3-persons, 393 4-persons, 143 5-persons, 37 6-persons, 21 7-or-more-persons.
Size of nonfamily households: 916 1-person, 198 2-persons, 85 3-persons.
1,171 married couples with children.
407 single-parent households (195 men, 212 women).
97.6% of residents of Hamilton speak English at home.
0.6% of residents speak Spanish at home (43% speak English very well, 45% speak English well, 13% don't speak English at all).
1.1% of residents speak other Indo-European language at home (100% speak English very well).
0.5% of residents speak Asian or Pacific Island language at home (80% speak English very well, 14% speak English well, 6% speak English not well).
In fiscal year 2004:
Federal Government expenditure: $61,275,000 ($7,295 per capita)
Department of Defense expenditure: $746,000
Federal direct payments to individuals for retirement and disability: $23,394,000
Federal other direct payments to individuals: $13,239,000
Federal direct payments not to individuals: $12,526,000
Federal grants: $9,618,000
Federal procurement contracts: $458,000 ($0,000 Department of Defense)
Federal salaries and wages: $2,040,000 ($0,000 Department of Defense)
Federal Government direct loans: $1,003,000
Federal guaranteed/insured loans: $2,087,000
Federal Government insurance: $24,944,000
Population change from April 1, 2000 to July 1, 2005:
Births: 461| Here: | 56 per 1000 residents |
| State: | 75 per 1000 residents |
Deaths: 510
| Here: | 61 per 1000 residents |
| State: | 43 per 1000 residents |
Net international migration: -4
| Here: | |
| State: |
Net internal migration: -249
| Here: | |
| State: |
Total withdrawal of fresh water for public supply: 0.00 millions of gallons per day (all from surface)
| Here: | 5.8 |
| State: | 6.4 |
| Here: | 4.6 |
| State: | 4.1 |
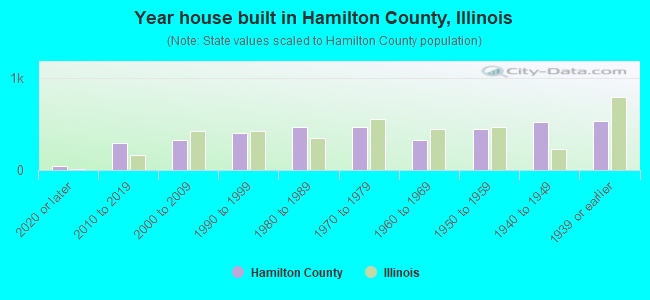
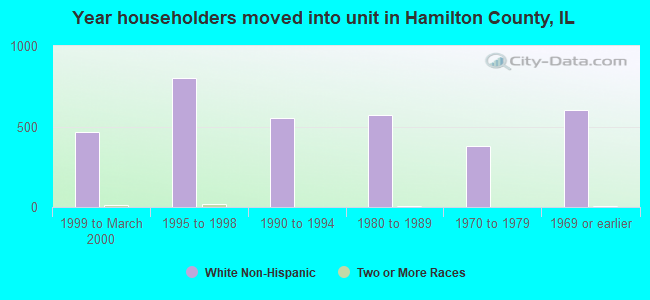
- Year house built in Hamilton County, Illinois
- 452020 or later
- 2962010 to 2019
- 3252000 to 2009
- 4001990 to 1999
- 4701980 to 1989
- 4681970 to 1979
- 3231960 to 1969
- 4411950 to 1959
- 5251940 to 1949
- 5351939 or earlier
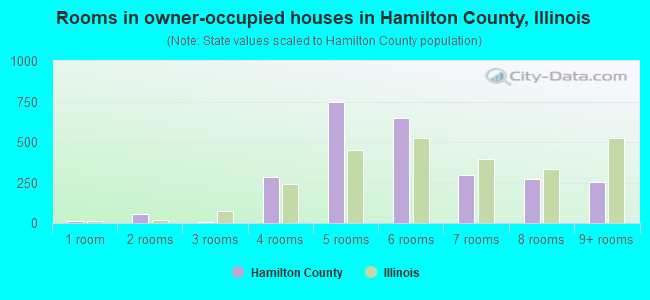
- Rooms in owner-occupied houses in Hamilton County, Illinois
- 151 room
- 532 rooms
- 43 rooms
- 2854 rooms
- 7475 rooms
- 6506 rooms
- 2987 rooms
- 2748 rooms
- 2529+ rooms
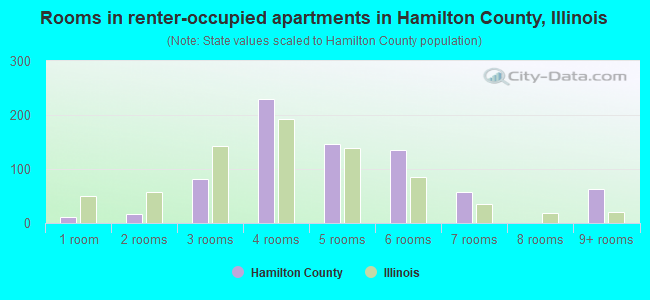
- Rooms in renter-occupied apartments in Hamilton County, Illinois
- 111 room
- 162 rooms
- 823 rooms
- 2304 rooms
- 1475 rooms
- 1356 rooms
- 577 rooms
- 08 rooms
- 639+ rooms
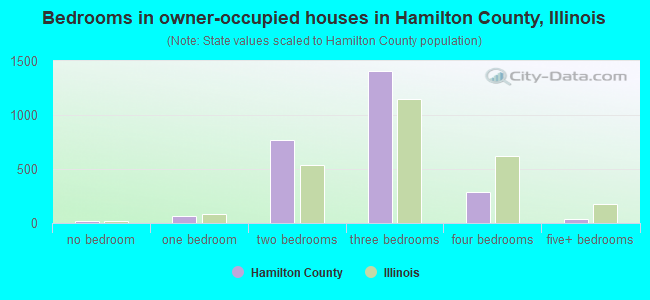
- Bedrooms in owner-occupied houses in Hamilton County, Illinois
- 15no bedroom
- 691 bedroom
- 7652 bedrooms
- 1,4043 bedrooms
- 2864 bedrooms
- 365+ bedrooms
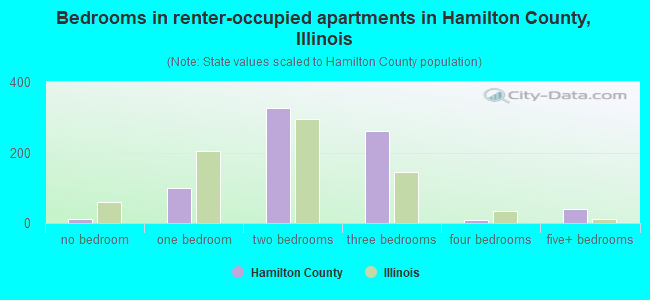
- Bedrooms in renter-occupied apartments in Hamilton County, Illinois
- 11no bedroom
- 1001 bedroom
- 3252 bedrooms
- 2613 bedrooms
- 84 bedrooms
- 395+ bedrooms
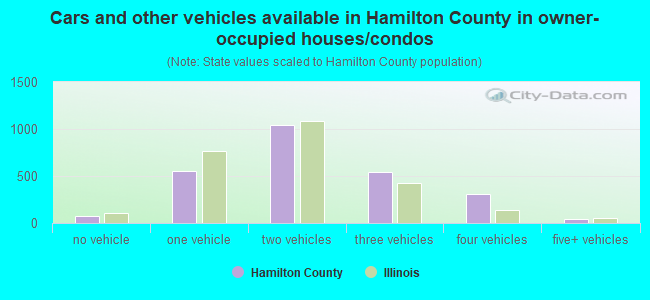
- Cars and other vehicles available in Hamilton County in owner-occupied houses/condos
- 78no vehicle
- 5531 vehicle
- 1,0412 vehicles
- 5423 vehicles
- 3054 vehicles
- 455+ vehicles
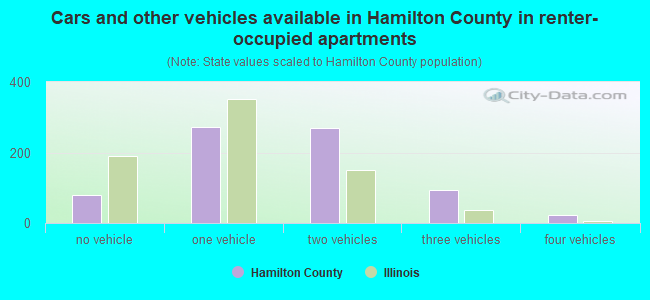
- Cars and other vehicles available in Hamilton County in renter-occupied apartments
- 79no vehicle
- 2711 vehicle
- 2702 vehicles
- 933 vehicles
- 244 vehicles
- 05+ vehicles
91.2% of Hamilton County residents lived in the same house 1 years ago.
Out of people who lived in different houses, 38% lived in this county.
Out of people who lived in different counties, 69% lived in Illinois.
| Hamilton County: | 91.2% |
| State average: | 88.3% |
Place of birth for U.S.-born residents:
- This state: 6,298
- Other state: 1,463
- Northeast: 44
- Midwest: 836
- South: 395
- West: 185
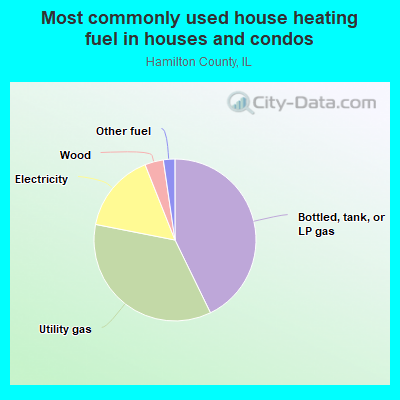
- 42.8%Bottled, tank, or LP gas
- 35.3%Utility gas
- 15.9%Electricity
- 3.7%Wood
- 2.3%Other fuel
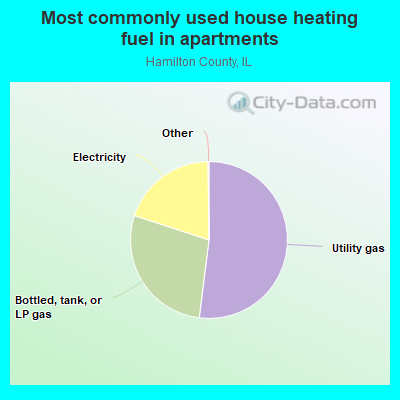
- 52.1%Utility gas
- 28.1%Bottled, tank, or LP gas
- 19.8%Electricity
Private vs. public school enrollment:
| Here: | 4.5% |
| Illinois: | 13.3% |
| Here: | 1.7% |
| Illinois: | 9.9% |
| Here: | 3.4% |
| Illinois: | 27.4% |


Hamilton County government finances - Expenditure in 2017:
- Charges - Other: $659,000
- Current Operations - Regular Highways: $1,853,000
Central Staff Services: $1,104,000
General - Other: $787,000
Police Protection: $536,000
Judicial and Legal Services: $425,000
Health - Other: $307,000
- Federal Intergovernmental - Health and Hospitals: $85,000
Public Welfare: $19,000
- General - Interest on Debt: $2,000
- Long Term Debt - Beginning Outstanding - Unspecified Public Purpose: $60,000
Outstanding Unspecified Public Purpose: $54,000
Retired Unspecified Public Purpose: $47,000
Issue, Unspecified Public Purpose: $41,000
- Miscellaneous - General Revenue - Other: $874,000
Interest Earnings: $20,000
- Other Capital Outlay - Central Staff Services: $113,000
Public Welfare - Other: $106,000
Police Protection: $29,000
Regular Highways: $23,000
- Other Funds - Cash and Securities: $5,004,000
- State Intergovernmental - Highways: $1,347,000
General Local Government Support: $1,008,000
Health and Hospitals: $110,000
Other: $108,000
Public Welfare: $18,000
- Tax - Property: $935,000
Other License: $8,000
- Total Salaries and Wages: $1,566,000
Hamilton County government finances - Revenue in 2017:
- Charges - Other: $659,000
- Current Operations - Regular Highways: $1,853,000
Central Staff Services: $1,104,000
General - Other: $787,000
Police Protection: $536,000
Judicial and Legal Services: $425,000
Health - Other: $307,000
- Federal Intergovernmental - Health and Hospitals: $85,000
Public Welfare: $19,000
- General - Interest on Debt: $2,000
- Long Term Debt - Beginning Outstanding - Unspecified Public Purpose: $60,000
Outstanding Unspecified Public Purpose: $54,000
Retired Unspecified Public Purpose: $47,000
Issue, Unspecified Public Purpose: $41,000
- Miscellaneous - General Revenue - Other: $874,000
Interest Earnings: $20,000
- Other Capital Outlay - Central Staff Services: $113,000
Public Welfare - Other: $106,000
Police Protection: $29,000
Regular Highways: $23,000
- Other Funds - Cash and Securities: $5,004,000
- State Intergovernmental - Highways: $1,347,000
General Local Government Support: $1,008,000
Health and Hospitals: $110,000
Other: $108,000
Public Welfare: $18,000
- Tax - Property: $935,000
Other License: $8,000
- Total Salaries and Wages: $1,566,000
Hamilton County government finances - Debt in 2017:
- Charges - Other: $659,000
- Current Operations - Regular Highways: $1,853,000
Central Staff Services: $1,104,000
General - Other: $787,000
Police Protection: $536,000
Judicial and Legal Services: $425,000
Health - Other: $307,000
- Federal Intergovernmental - Health and Hospitals: $85,000
Public Welfare: $19,000
- General - Interest on Debt: $2,000
- Long Term Debt - Beginning Outstanding - Unspecified Public Purpose: $60,000
Outstanding Unspecified Public Purpose: $54,000
Retired Unspecified Public Purpose: $47,000
Issue, Unspecified Public Purpose: $41,000
- Miscellaneous - General Revenue - Other: $874,000
Interest Earnings: $20,000
- Other Capital Outlay - Central Staff Services: $113,000
Public Welfare - Other: $106,000
Police Protection: $29,000
Regular Highways: $23,000
- Other Funds - Cash and Securities: $5,004,000
- State Intergovernmental - Highways: $1,347,000
General Local Government Support: $1,008,000
Health and Hospitals: $110,000
Other: $108,000
Public Welfare: $18,000
- Tax - Property: $935,000
Other License: $8,000
- Total Salaries and Wages: $1,566,000
Hamilton County government finances - Cash and Securities in 2017:
- Charges - Other: $659,000
- Current Operations - Regular Highways: $1,853,000
Central Staff Services: $1,104,000
General - Other: $787,000
Police Protection: $536,000
Judicial and Legal Services: $425,000
Health - Other: $307,000
- Federal Intergovernmental - Health and Hospitals: $85,000
Public Welfare: $19,000
- General - Interest on Debt: $2,000
- Long Term Debt - Beginning Outstanding - Unspecified Public Purpose: $60,000
Outstanding Unspecified Public Purpose: $54,000
Retired Unspecified Public Purpose: $47,000
Issue, Unspecified Public Purpose: $41,000
- Miscellaneous - General Revenue - Other: $874,000
Interest Earnings: $20,000
- Other Capital Outlay - Central Staff Services: $113,000
Public Welfare - Other: $106,000
Police Protection: $29,000
Regular Highways: $23,000
- Other Funds - Cash and Securities: $5,004,000
- State Intergovernmental - Highways: $1,347,000
General Local Government Support: $1,008,000
Health and Hospitals: $110,000
Other: $108,000
Public Welfare: $18,000
- Tax - Property: $935,000
Other License: $8,000
- Total Salaries and Wages: $1,566,000
Supplemental Security Income (SSI) in 2006:
- Total number of recipients: 222
- Number of aged recipients: 24
- Number of blind and disabled recipients: 198
- Number of recipients under 18: 25
- Number of recipients between 18 and 64: 140
- Number of recipients older than 64: 57
- Number of recipients also receiving OASDI: 98
- Amount of payments (thousands of dollars): 89
| Most common first names in Hamilton County, IL among deceased individuals | ||
| Name | Count | Lived (average) |
|---|---|---|
| John | 99 | 75.8 years |
| William | 93 | 77.5 years |
| Mary | 81 | 81.8 years |
| Charles | 74 | 74.5 years |
| James | 69 | 76.0 years |
| George | 47 | 75.2 years |
| Robert | 42 | 76.3 years |
| Ralph | 35 | 77.2 years |
| Ruth | 30 | 81.1 years |
| Ruby | 29 | 76.9 years |
| Most common last names in Hamilton County, IL among deceased individuals | ||
| Last name | Count | Lived (average) |
|---|---|---|
| Smith | 60 | 79.0 years |
| Johnson | 48 | 82.9 years |
| Aydt | 36 | 84.1 years |
| Clark | 28 | 82.4 years |
| Karcher | 27 | 76.6 years |
| Williams | 26 | 76.8 years |
| Rubenacker | 26 | 77.5 years |
| Miller | 26 | 72.5 years |
| Thompson | 25 | 78.8 years |
| Allen | 25 | 74.3 years |
| Businesses in Hamilton County, IL | ||||
| Name | Count | Name | Count | |
|---|---|---|---|---|
| Chevrolet | 1 | Subway | 1 | |
| Dairy Queen | 1 | True Value | 1 | |
| H&R Block | 1 | U-Haul | 1 | |
| McDonald's | 1 | |||