Hocking County, Ohio (OH)
County owner-occupied free and clear houses and condos in 2010: 3,180
County owner-occupied houses and condos in 2000: 8,194
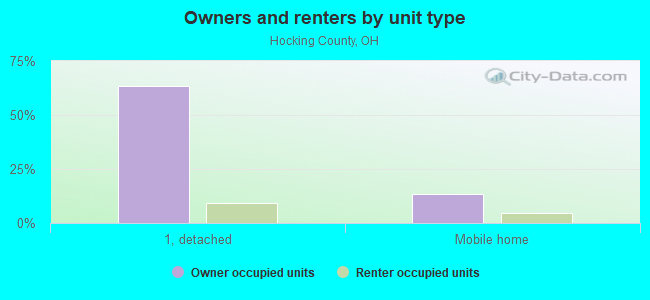
Renter-occupied apartments: 3,024 (it was 2,649 in 2000)
| % of renters here: | 24% |
| State: | 32% |
Land area: 423 sq. mi.
Water area: 0.9 sq. mi.
Population density: 66 people per square mile (average).
Industries providing employment: Educational, health and social services (24.1%), Construction (12.6%), Manufacturing (11.7%), Arts, entertainment, recreation, accommodation and food services (11.3%), Retail trade (10.0%).
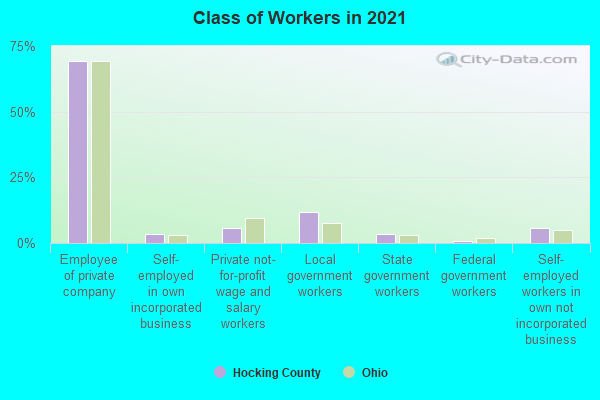
Type of workers:
- Private wage or salary: 79%
- Government: 15%
- Self-employed, not incorporated: 6%
- Unpaid family work: 0%
- OSM Map
- General Map
- Google Map
- MSN Map

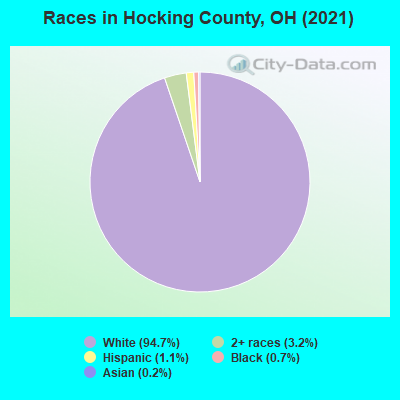
- 26,15693.5%White Non-Hispanic Alone
- 9463.4%Two or more races
- 3251.2%Hispanic or Latino
- 2881.0%Some other race alone
- 1690.6%Black Non-Hispanic Alone
- 750.3%Asian alone
- 30.01%American Indian and Alaska Native alone
| Median resident age: | 42.9 years |
| Ohio median age: | 39.9 years |
| Males: 14,179 | |
| Females: 13,880 |


| Hocking County: | 2.0 people |
| Ohio: | 2 people |
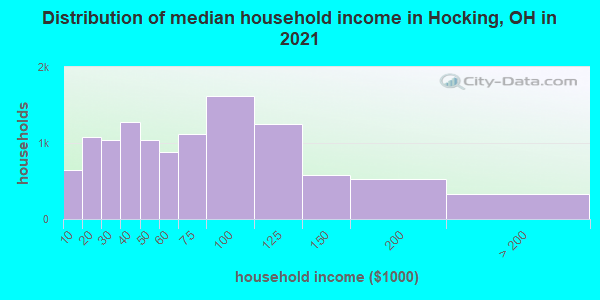
Estimated median household income in 2022: $57,888 ($34,261 in 1999)
| This county: | $57,888 |
| Ohio: | $65,720 |
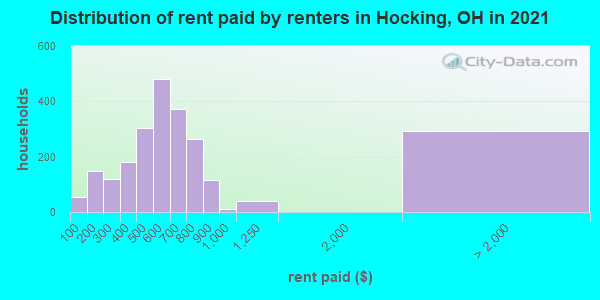
Median contract rent in 2022 for apartments: $578 (lower quartile is $443, upper quartile is $741)
| This county: | $578 |
| State: | $765 |
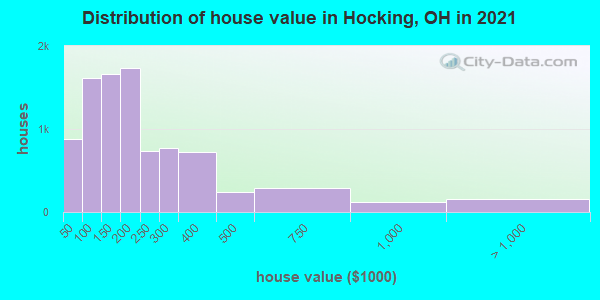
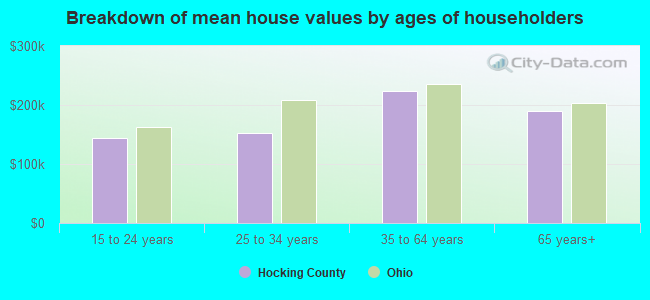
Estimated median house or condo value in 2022: $182,721 (it was $81,400 in 2000)
| Hocking: | $182,721 |
| Ohio: | $204,100 |
Median monthly housing costs for homes and condos with a mortgage: $1,184
Median monthly housing costs for units without a mortgage: $480
Institutionalized population: 692
Crime in 2021 (reported by the sheriff's office or county police, not the county total):
- Murders: 1
- Rapes: 6
- Robberies: 3
- Assaults: 28
- Burglaries: 60
- Thefts: 141
- Auto thefts: 18
Crime in 2020 (reported by the sheriff's office or county police, not the county total):
- Murders: 0
- Rapes: 8
- Robberies: 3
- Assaults: 18
- Burglaries: 88
- Thefts: 205
- Auto thefts: 28
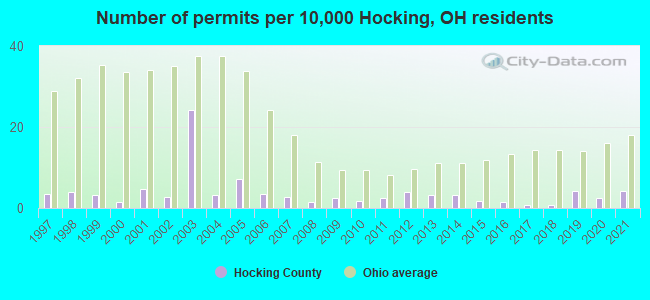
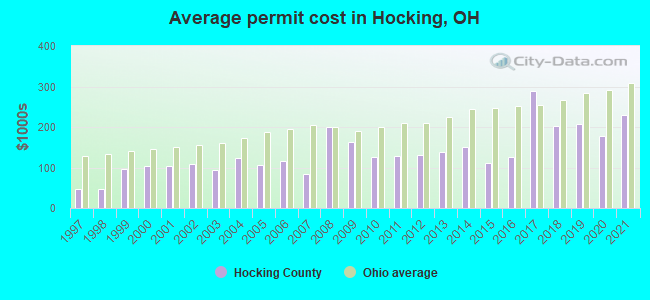
Single-family new house construction building permits:
- 2022: 3 buildings, average cost: $241,700
- 2021: 12 buildings, average cost: $228,900
- 2020: 7 buildings, average cost: $178,800
- 2019: 12 buildings, average cost: $207,100
- 2018: 2 buildings, average cost: $201,500
- 2017: 2 buildings, average cost: $287,500
- 2016: 4 buildings, average cost: $125,700
- 2015: 5 buildings, average cost: $112,000
- 2014: 9 buildings, average cost: $149,900
- 2013: 9 buildings, average cost: $138,300
- 2012: 11 buildings, average cost: $130,800
- 2011: 7 buildings, average cost: $128,300
- 2010: 5 buildings, average cost: $125,600
- 2009: 7 buildings, average cost: $164,000
- 2008: 4 buildings, average cost: $198,500
- 2007: 8 buildings, average cost: $82,600
- 2006: 10 buildings, average cost: $116,900
- 2005: 20 buildings, average cost: $104,800
- 2004: 9 buildings, average cost: $123,100
- 2003: 68 buildings, average cost: $93,000
- 2002: 8 buildings, average cost: $107,800
- 2001: 13 buildings, average cost: $103,100
- 2000: 4 buildings, average cost: $103,800
- 1999: 9 buildings, average cost: $96,400
- 1998: 11 buildings, average cost: $47,700
- 1997: 10 buildings, average cost: $47,700
Median real estate property taxes paid for housing units with mortgages in 2022: $1,857 (0.9%)
Median real estate property taxes paid for housing units with no mortgage in 2022: $1,461 (1.0%)
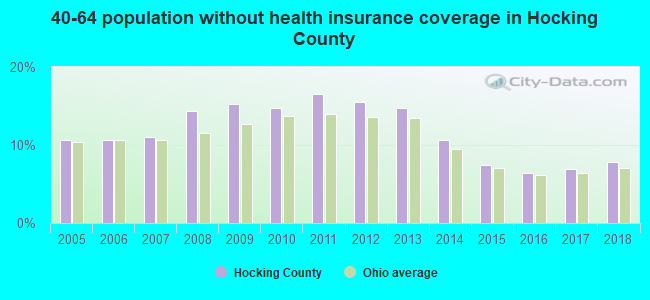
| Hocking County: | 16.8% |
| Ohio: | 13.4% |
Median age of residents in 2022: 42.9 years old
(Males: 41.3 years old, Females: 44.4 years old)
(Median age for: White residents: 43.4 years old, Black residents: 53.9 years old, Asian residents: 56.6 years old, Hispanic or Latino residents: 32.4 years old, Other race residents: 31.5 years old)
Fair market rent in 2006 for a 1-bedroom apartment in Hocking County is $454 a month.
Fair market rent for a 2-bedroom apartment is $503 a month.
Fair market rent for a 3-bedroom apartment is $718 a month.
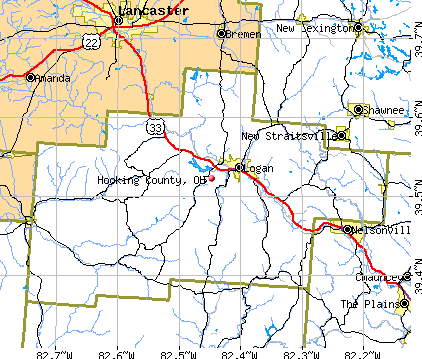
Cities in this county include: Logan, Hide-A-Way Hills, Laurelville, Murray City, Haydenville, Carbon Hill, Rockbridge.
| Zip Code | City | Tests | Max concentration | Min concentration | Arithmetic mean | Geometric mean | Standard deviation | Coefficient of variation | Mean concentration | First quartile | Third quartile |
|---|---|---|---|---|---|---|---|---|---|---|---|
| 43111 | Carbon Hill | 1 | 21.2 | 21.2 | 21.2 | 21.2 | 21.20 | 8.60 | 19.58 | ||
| 43127 | Haydenville | 2 | 15.2 | 1.6 | 8.4 | 4.93 | 9.62 | 114.48 | 8.40 | 3.40 | 8.40 |
| 43135 | Laurelville | 12 | 29.9 | 0.8 | 11.78 | 7.06 | 10.78 | 91.52 | 7.75 | 2.40 | 18.20 |
| 43138 | Logan | 125 | 99.5 | 0.1 | 7.65 | 4.43 | 10.52 | 137.48 | 5.00 | 2.33 | 10.10 |
| 43144 | Murray City | 1 | 23.3 | 23.3 | 23.3 | 23.3 | 23.30 | 6.88 | 18.85 | ||
| 43149 | Rockbridge | 41 | 238 | 0.3 | 33.21 | 8.24 | 65.84 | 198.26 | 6.00 | 2.73 | 17.43 |
| 43152 | South Bloomingville | 9 | 10.2 | 0.1 | 3.43 | 1.87 | 3.2 | 93.17 | 3.30 | 0.60 | 4.10 |
| 43158 | Union Furnace | 1 | 7.5 | 7.5 | 7.5 | 7.5 | 7.50 | 2.85 | 7.40 |
All concentrations are in units of pico-Curies of radiation per liter of air ( pCi/l ).
Neighboring counties: New Castle County, Delaware  , Glenn County, California
  , Delta County, Colorado , Delaware County, Pennsylvania , Nevada County, California , Lake County, Colorado , Ralls County, Missouri , Shawnee County, Kansas .
| Here: | 3.4% |
| Ohio: | 3.1% |
Current college students: 979
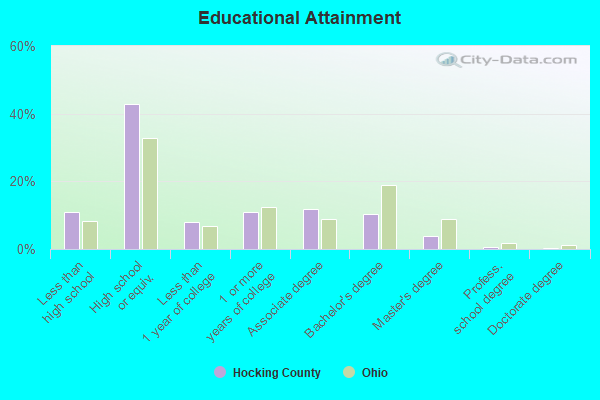
People 25 years of age or older with a high school degree or higher: 87.9%
People 25 years of age or older with a bachelor's degree or higher: 14.7%
Number of foreign born residents: 196 (86.1% naturalized citizens)
| Hocking County: | 0.7% |
| Whole state: | 5.0% |
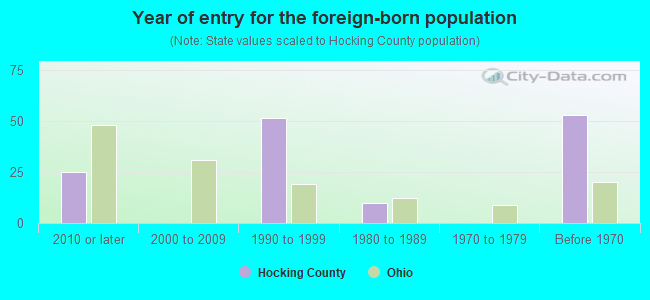
- Year of entry for the foreign-born population
- 262010 or later
- 02000 to 2009
- 581990 to 1999
- 101980 to 1989
- 01970 to 1979
- 53Before 1970
Mean travel time to work (commute): minutes
Percentage of county residents living and working in this county: 100.0%
Housing units in structures:
- One, detached: 9,575
- One, attached: 154
- Two: 158
- 3 or 4: 273
- 5 to 9: 231
- 10 to 19: 88
- 20 to 49: 51
- 50 or more: 97
- Mobile homes: 2,363
- Boats, RVs, vans, etc.: 48
Housing units in Hocking County with a mortgage: 5,081 (632 second mortgage, 68 home equity loan, 451 both second mortgage and home equity loan)
Houses without a mortgage: 339
| Here: | 1.5% with mortgage |
| State: | 95.2% with mortgage |
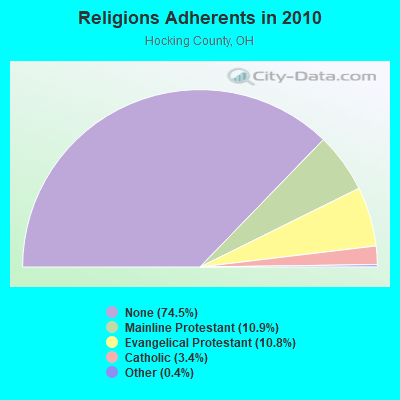
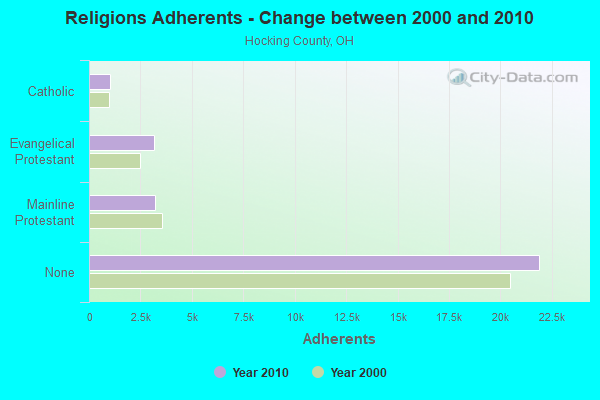
Religion statistics for Hocking County
| Religion | Adherents | Congregations |
|---|---|---|
| Mainline Protestant | 3,190 | 32 |
| Evangelical Protestant | 3,171 | 27 |
| Catholic | 1,000 | 1 |
| Other | 118 | 2 |
| None | 21,901 | - |
Source: Clifford Grammich, Kirk Hadaway, Richard Houseal, Dale E.Jones, Alexei Krindatch, Richie Stanley and Richard H.Taylor. 2012. 2010 U.S.Religion Census: Religious Congregations & Membership Study. Association of Statisticians of American Religious Bodies. Jones, Dale E., et al. 2002. Congregations and Membership in the United States 2000. Nashville, TN: Glenmary Research Center.
Food Environment Statistics:
| Hocking County: | 2.77 / 10,000 pop. |
| State: | 1.89 / 10,000 pop. |
| Here: | 0.35 / 10,000 pop. |
| Ohio: | 0.13 / 10,000 pop. |
| This county: | 1.38 / 10,000 pop. |
| Ohio: | 1.25 / 10,000 pop. |
| Hocking County: | 2.42 / 10,000 pop. |
| Ohio: | 2.93 / 10,000 pop. |
| This county: | 5.88 / 10,000 pop. |
| State: | 6.25 / 10,000 pop. |
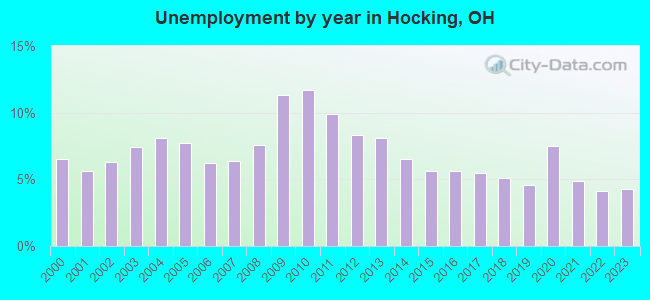
| Hocking County: | 10.5% |
| Ohio: | 10.3% |
| Hocking County: | 30.3% |
| State: | 29.1% |
| Here: | 12.6% |
| State: | 11.9% |
Agriculture in Hocking County:
Average size of farms: 115 acresAverage value of agricultural products sold per farm: $8,189
Average value of crops sold per acre for harvested cropland: $144.84
The value of nursery, greenhouse, floriculture, and sod as a percentage of the total market value of agricultural products sold: 14.54%
The value of livestock, poultry, and their products as a percentage of the total market value of agricultural products sold: 41.49%
Average total farm production expenses per farm: $16,614
Harvested cropland as a percentage of land in farms: 28.79%
Average market value of all machinery and equipment per farm: $34,537
The percentage of farms operated by a family or individual: 90.55%
Average age of principal farm operators: 54 years
Average number of cattle and calves per 100 acres of all land in farms: 6.34
Milk cows as a percentage of all cattle and calves: 0.60%
Corn for grain: 2496 harvested acres
All wheat for grain: 388 harvested acres
Soybeans for beans: 2106 harvested acres
Vegetables: 65 harvested acres
Land in orchards: 79 acres
Earthquake activity:
Hocking County-area historical earthquake activity is significantly above Ohio state average. It is 7% smaller than the overall U.S. average.On 7/27/1980 at 18:52:21, a magnitude 5.2 (5.1 MB, 4.7 MS, 5.0 UK, 5.2 UK, Class: Moderate, Intensity: VI - VII) earthquake occurred 121.6 miles away from Hocking County center
On 8/23/2011 at 17:51:04, a magnitude 5.8 (5.8 MW, Depth: 3.7 mi) earthquake occurred 267.8 miles away from the county center
On 9/25/1998 at 19:52:52, a magnitude 5.2 (4.8 MB, 4.3 MS, 5.2 LG, 4.5 MW, Depth: 3.1 mi) earthquake occurred 173.8 miles away from the county center
On 1/31/1986 at 16:46:43, a magnitude 5.0 (5.0 MB) earthquake occurred 159.0 miles away from the county center
On 9/7/1988 at 02:28:09, a magnitude 4.6 (4.5 MB, 4.6 LG, Class: Light, Intensity: IV - V) earthquake occurred 122.6 miles away from Hocking County center
On 8/9/2020 at 12:07:37, a magnitude 5.1 (5.1 MW, Depth: 4.7 mi) earthquake occurred 223.3 miles away from the county center
Magnitude types: regional Lg-wave magnitude (LG), body-wave magnitude (MB), surface-wave magnitude (MS), moment magnitude (MW)
Most recent natural disasters:
- Ohio Covid-19 Pandemic, Incident Period: January 20, 2020, FEMA Id: 4507, Natural disaster type: Other
- Ohio Severe Storms, Straight-line Winds, Tornadoes, Flooding, Landslides, And Mudslide, Incident Period: May 27, 2019 - May 29, 2019, FEMA Id: 4447, Natural disaster type: Storm, Tornado, Mudslide, Landslide, Flood, Wind
- Ohio Severe Storms, Flooding, And Landslides, Incident Period: February 5, 2019 - February 13, 2019, FEMA Id: 4424, Natural disaster type: Storm, Landslide, Flood
- Ohio Severe Storms and Straight-line Winds, Incident Period: June 29, 2012 to July 02, 2012, Major Disaster (Presidential) Declared DR-4077: August 20, 2012, FEMA Id: 4077, Natural disaster type: Storm, Wind
- Ohio Severe Storms and Flooding, Incident Period: April 04, 2011 to May 15, 2011, Major Disaster (Presidential) Declared DR-4002: July 13, 2011, FEMA Id: 4002, Natural disaster type: Storm, Flood
- Ohio Severe Wind Storm associated with Tropical Depression Ike, Incident Period: September 14, 2008, Major Disaster (Presidential) Declared DR-1805: October 24, 2008, FEMA Id: 1805, Natural disaster type: Storm, Tropical Depression, Wind
- Ohio Hurricane Katrina Evacuation, Incident Period: August 29, 2005 to October 01, 2005, Emergency Declared EM-3250: September 13, 2005, FEMA Id: 3250, Natural disaster type: Hurricane
- Ohio Severe Winter Storms, Flooding and Mudslides, Incident Period: December 22, 2004 to February 01, 2005, Major Disaster (Presidential) Declared DR-1580: February 15, 2005, FEMA Id: 1580, Natural disaster type: Winter Storm, Mudslide, Flood
- Ohio Severe Storms and Flooding, Incident Period: May 18, 2004 to June 21, 2004, Major Disaster (Presidential) Declared DR-1519: June 03, 2004, FEMA Id: 1519, Natural disaster type: Storm, Flood
- Ohio Severe Storms/Flooding, Incident Period: February 28, 1997 to March 17, 1997, Major Disaster (Presidential) Declared DR-1164: March 04, 1997, FEMA Id: 1164, Natural disaster type: Storm, Flood
- 4 other natural disasters have been reported since 1953.
The number of natural disasters in Hocking County (14) is near the US average (15).
Major Disasters (Presidential) Declared: 9
Emergencies Declared: 2
Causes of natural disasters: Floods: 9, Storms: 8, Winds: 3, Landslides: 2, Mudslides: 2, Tornadoes: 2, Blizzard: 1, Heavy Rain: 1, Hurricane: 1, Snowstorm: 1, Tropical Depression: 1, Winter Storm: 1, Other: 1 (Note: some incidents may be assigned to more than one category).
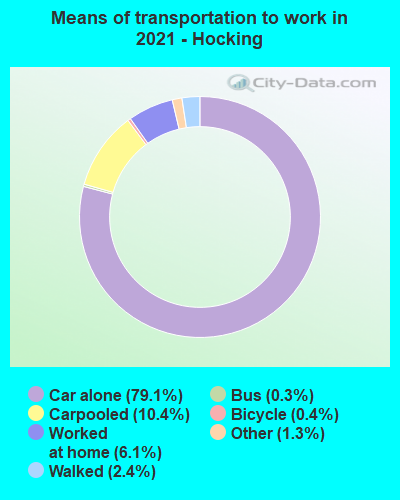
Means of transportation to work:
- Drove a car alone: 6,767 (74.8%)
- Carpooled: 939 (10.4%)
- Bus: 18 (0.2%)
- Taxicab, motorcycle, or other means: 143 (1.6%)
- Bicycle: 35 (0.4%)
- Walked: 147 (1.6%)
- Worked at home: 977 (10.8%)
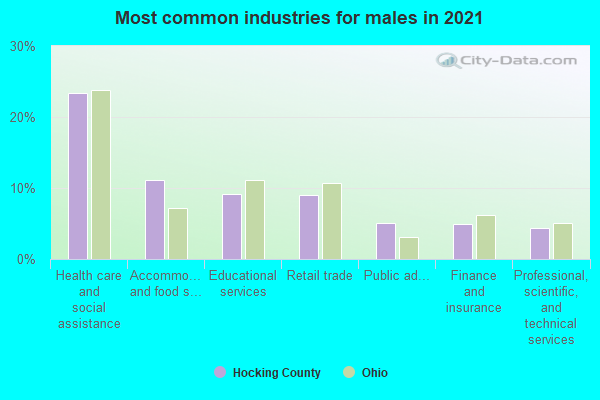
- Health care and social assistance (22%)
- Accommodation and food services (12%)
- Educational services (8%)
- Retail trade (8%)
- Public administration (5%)
- Professional, scientific, and technical services (5%)
- Manufacturing (4%)
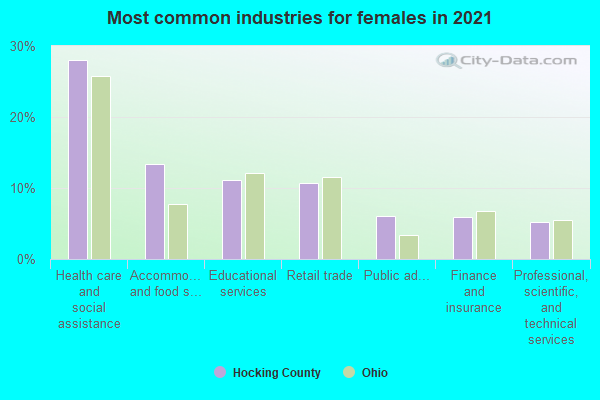
- Health care and social assistance (27%)
- Accommodation and food services (15%)
- Educational services (10%)
- Retail trade (9%)
- Public administration (7%)
- Professional, scientific, and technical services (6%)
- Manufacturing (5%)
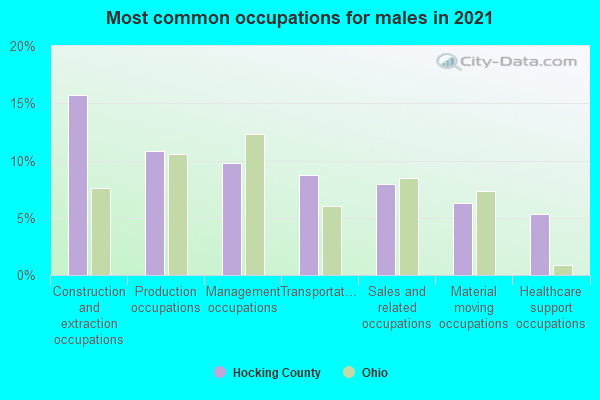
- Construction and extraction occupations (16%)
- Production occupations (11%)
- Management occupations (10%)
- Transportation occupations (8%)
- Material moving occupations (6%)
- Sales and related occupations (6%)
- Food preparation and serving related occupations (6%)
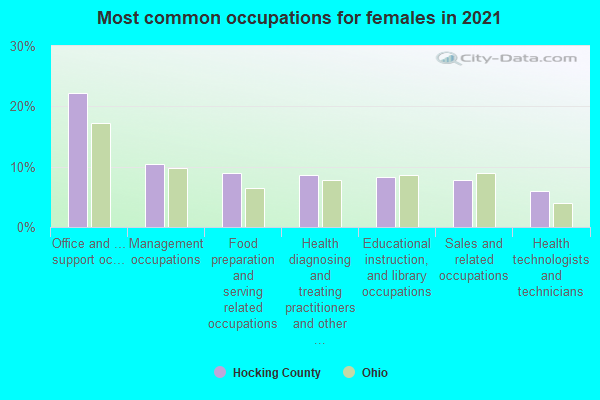
- Office and administrative support occupations (22%)
- Food preparation and serving related occupations (11%)
- Management occupations (11%)
- Health diagnosing and treating practitioners and other technical occupations (8%)
- Sales and related occupations (8%)
- Educational instruction, and library occupations (7%)
- Healthcare support occupations (6%)
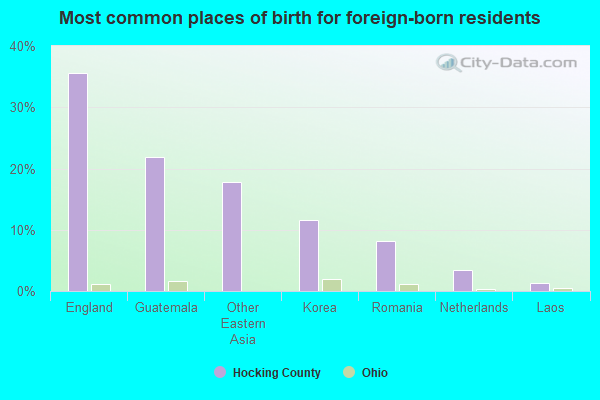
- England (21%)
- Korea (20%)
- Guatemala (12%)
- Other Eastern Asia (11%)
- Romania (9%)
- India (8%)
- Netherlands (4%)
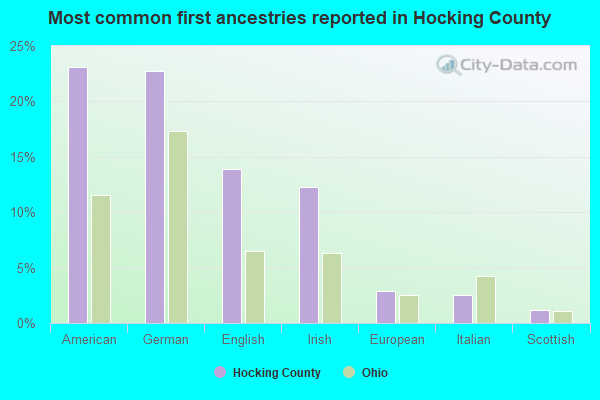
- German (23%)
- American (23%)
- English (15%)
- Irish (11%)
- European (3%)
- Italian (2%)
- Scottish (2%)
People in group quarters in Hocking County, Ohio in 2010:
- 485 people in state prisons
- 207 people in nursing facilities/skilled-nursing facilities
- 18 people in group homes intended for adults
- 5 people in residential treatment centers for adults
- 3 people in emergency and transitional shelters (with sleeping facilities) for people experiencing homelessness
People in group quarters in Hocking County, Ohio in 2000:
- 456 people in state prisons
- 193 people in nursing homes
- 25 people in other noninstitutional group quarters
- 22 people in homes for the mentally retarded
- 15 people in hospitals/wards and hospices for chronically ill
- 15 people in other hospitals or wards for chronically ill
- 8 people in homes or halfway houses for drug/alcohol abuse
- 6 people in mental (psychiatric) hospitals or wards
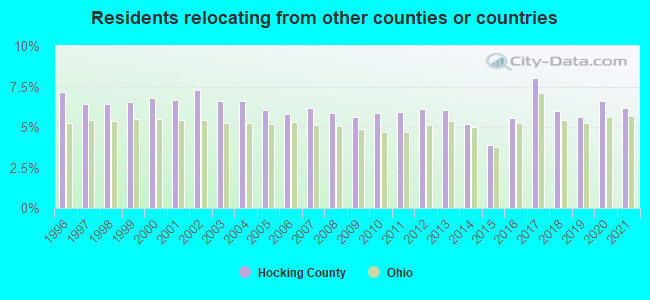
6.18% of this county's 2021 resident taxpayers lived in other counties in 2020 ($51,328 average adjusted gross income)
| Here: | 6.18% |
| Ohio average: | 5.68% |
10 or fewer of this county's residents moved from foreign countries.
5.72% relocated from other counties in Ohio ($47,678 average AGI)
0.47% relocated from other states ($3,650 average AGI)
Hocking County: 0.47% Ohio average: 1.92%
Top counties from which taxpayers relocated into this county between 2020 and 2021:
| from Fairfield County, OH | |
| from Franklin County, OH | |
| from Athens County, OH | |
| from Pickaway County, OH | |
| from Ross County, OH | |
| from Perry County, OH | |
| from Licking County, OH |
5.99% of this county's 2020 resident taxpayers moved to other counties in 2021 ($40,762 average adjusted gross income)
| Here: | 5.99% |
| Ohio average: | 5.79% |
10 or fewer of this county's residents moved to foreign countries.
5.26% relocated to other counties in Ohio ($33,248 average AGI)
0.73% relocated to other states ($7,514 average AGI)
Hocking County: 0.73% Ohio average: 2.05%

Top counties to which taxpayers relocated from this county between 2020 and 2021:
| to Fairfield County, OH | |
| to Athens County, OH | |
| to Franklin County, OH | |
| to Pickaway County, OH | |
| to Perry County, OH | |
| to Ross County, OH |
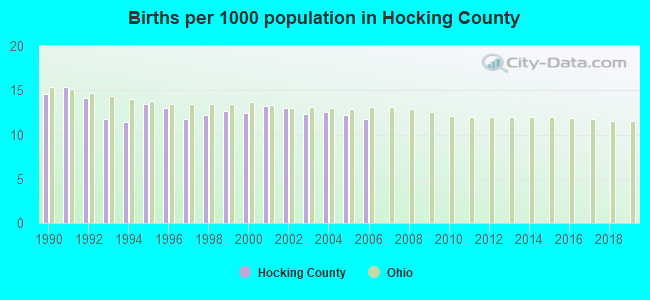
Births per 1000 population from 1990 to 1999: 13.0
Births per 1000 population from 2000 to 2006: 12.5
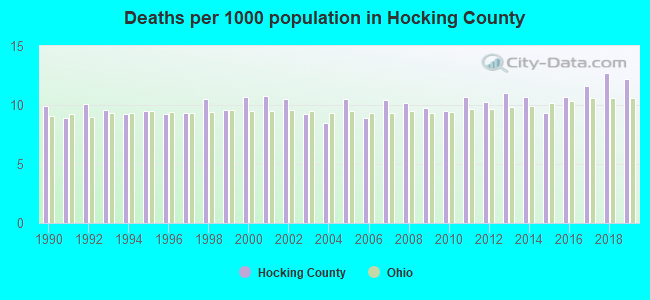
Deaths per 1000 population from 1990 to 1999: 9.6
Deaths per 1000 population from 2000 to 2009: 9.9
Deaths per 1000 population from 2010 to 2020: 11.1
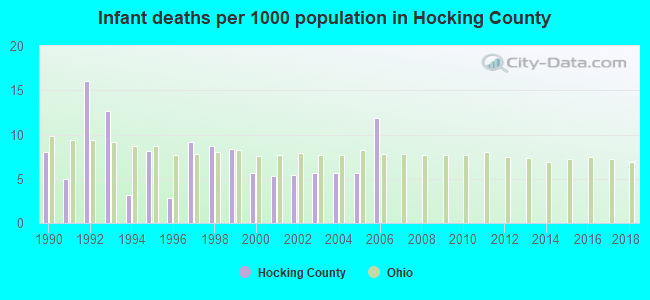
Infant deaths per 1000 live births from 1990 to 1999: 8.2
Infant deaths per 1000 live births from 2000 to 2006: 6.5
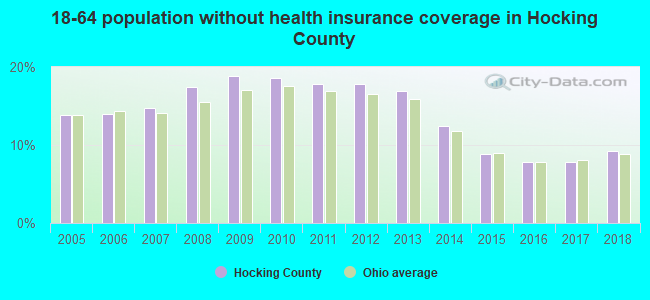
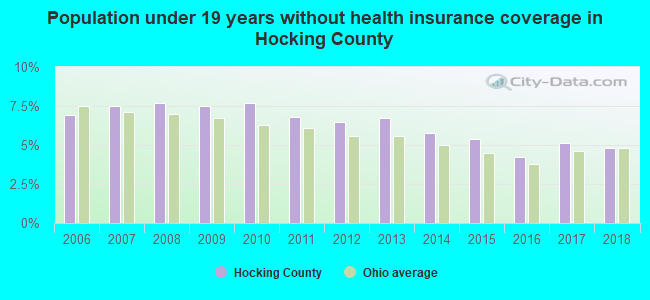
Persons under 19 years old without health insurance coverage in 2018: 4.8%
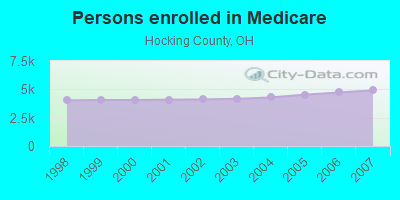
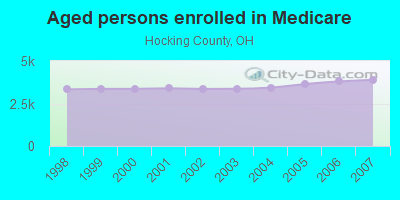
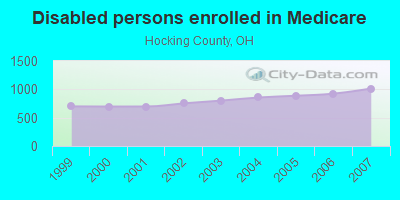
Persons enrolled in hospital insurance and/or supplemental medical insurance (Medicare) in July 1, 2007: 4,909 (3,895 aged, 1,014 disabled)
Children under 18 without health insurance coverage in 2007: 483 (7%)
Most common underlying causes of death in Hocking County, Ohio in 1999 - 2019:
- Acute myocardial infarction, unspecified (477)
- Bronchus or lung, unspecified - Malignant neoplasms (470)
- Atherosclerotic heart disease (405)
- Chronic obstructive pulmonary disease, unspecified (259)
- Unspecified dementia (131)
- Stroke, not specified as haemorrhage or infarction (107)
- Alzheimer disease, unspecified (100)
- Congestive heart failure (46)
- Colon, unspecified - Malignant neoplasms (22)
- Pneumonia, unspecified (13)
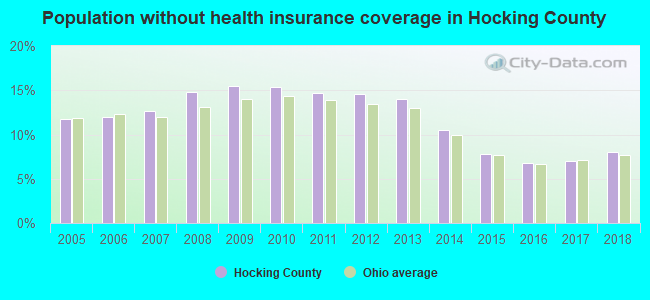
Population without health insurance coverage in 2000: 11%
Children under 18 without health insurance coverage in 2000: 10%
Short term general hospital admissions per 100,000 population in 2004: 6,124
Short term general hospital beds per 100,000 population in 2004: 319
Emergency room visits per 100,000 population in 2004: 73,646
General practice office based MDs per 100,000 population in 2005: 1,231
Medical specialist MDs per 100,000 population in 2005: 700
Dentists per 100,000 population in 1998: 3
Total births per 100,000 population, July 2005 - July 2006 : 17
Total deaths per 100,000 population, July 2005 - July 2006: 45
Limited-service eating places per 100,000 population in 2005 : 3
Suicides per 1,000,000 population from 2000 to 2006: 165.1. This is more than state average.
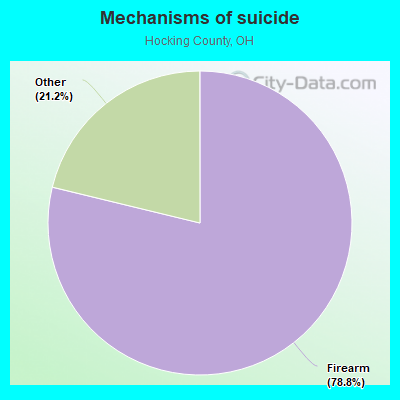
- Firearm - 130.1
- Other - 35.0
Household type by relationship:
Households: 28,059- Male householders: 6,091 (1,291 living alone), Female householders: 5,386 (1,289 living alone)
5,833 spouses (5,818 opposite-sex spouses), 1,097 unmarried partners, (1,097 opposite-sex unmarried partners), 7,106 children (6,278 natural, 146 adopted, 665 stepchildren), 820 grandchildren, 168 brothers or sisters, 194 parents, 0 foster children, 309 other relatives, 755 non-relatives
- In group quarters: 305
Size of family households: 4,178 2-persons, 1,644 3-persons, 1,393 4-persons, 687 5-persons, 205 6-persons, 150 7-or-more-persons.
Size of nonfamily households: 2,578 1-person, 502 2-persons, 94 3-persons, 30 5-persons.
2,857 married couples with children.
2,152 single-parent households (653 men, 1,499 women).
98.1% of residents of Hocking speak English at home.
1.2% of residents speak Spanish at home (20% speak English very well, 12% speak English well, 68% don't speak English at all).
0.5% of residents speak other Indo-European language at home (85% speak English very well, 15% speak English well).
0.1% of residents speak Asian or Pacific Island language at home (51% speak English very well, 26% speak English well, 23% speak English not well).
In fiscal year 2004:
Federal Government expenditure: $127,917,000 ($4,436 per capita)
Department of Defense expenditure: $2,374,000
Federal direct payments to individuals for retirement and disability: $61,836,000
Federal other direct payments to individuals: $30,730,000
Federal direct payments not to individuals: $1,075,000
Federal grants: $30,115,000
Federal procurement contracts: $895,000 ($0,000 Department of Defense)
Federal salaries and wages: $3,266,000 ($0,000 Department of Defense)
Federal Government direct loans: $343,000
Federal guaranteed/insured loans: $8,483,000
Federal Government insurance: $23,183,000
Population change from April 1, 2000 to July 1, 2005:
Births: 1,886| Here: | 65 per 1000 residents |
| State: | 69 per 1000 residents |
Deaths: 1,480
| Here: | 51 per 1000 residents |
| State: | 50 per 1000 residents |
Net international migration: +73
| Here: | +3 per 1000 residents |
| State: | +7 per 1000 residents |
Net internal migration: +332
| Here: | |
| State: |
Total withdrawal of fresh water for public supply: 3.26 millions of gallons per day (all from ground)
| Here: | 6.1 |
| State: | 6.7 |
| Here: | 4.7 |
| State: | 4.4 |
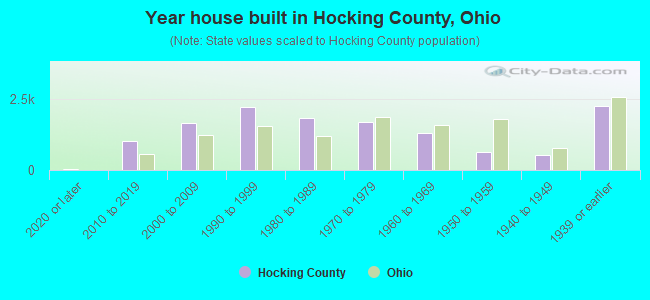
- Year house built in Hocking County, Ohio
- 592020 or later
- 9852010 to 2019
- 1,6602000 to 2009
- 2,2601990 to 1999
- 1,7581980 to 1989
- 1,6811970 to 1979
- 1,3111960 to 1969
- 6661950 to 1959
- 4591940 to 1949
- 2,2071939 or earlier
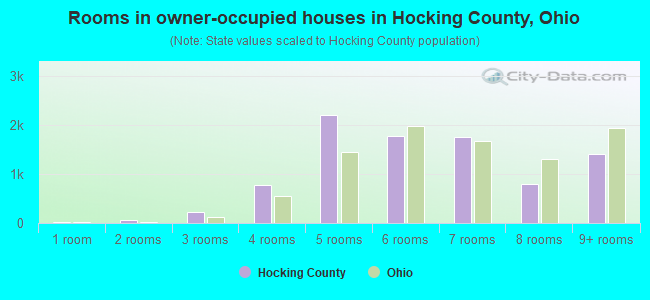
- Rooms in owner-occupied houses in Hocking County, Ohio
- 441 room
- 582 rooms
- 2803 rooms
- 9434 rooms
- 2,2145 rooms
- 1,7036 rooms
- 1,6157 rooms
- 9098 rooms
- 1,4019+ rooms
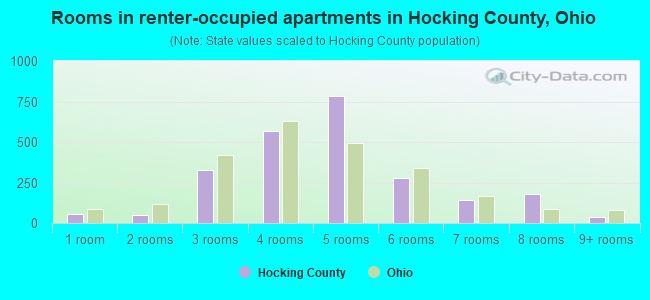
- Rooms in renter-occupied apartments in Hocking County, Ohio
- 321 room
- 262 rooms
- 2693 rooms
- 6864 rooms
- 7425 rooms
- 2546 rooms
- 1617 rooms
- 1578 rooms
- 399+ rooms
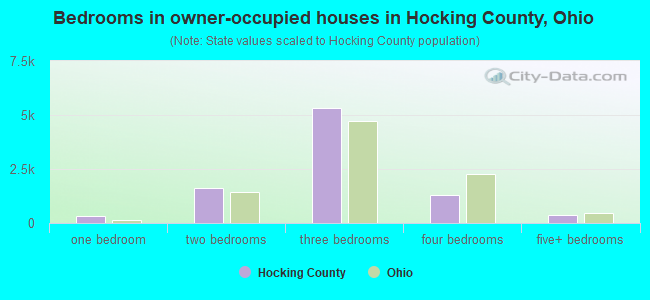
- Bedrooms in owner-occupied houses in Hocking County, Ohio
- 69no bedroom
- 3751 bedroom
- 1,8982 bedrooms
- 5,1253 bedrooms
- 1,3214 bedrooms
- 3485+ bedrooms
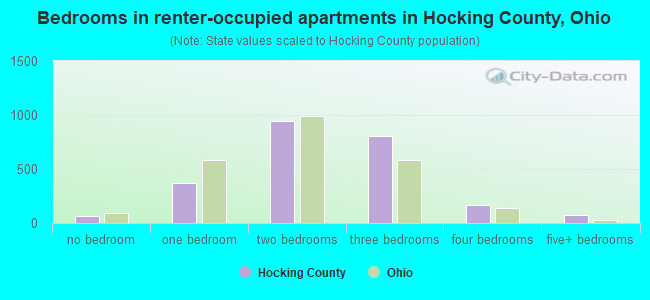
- Bedrooms in renter-occupied apartments in Hocking County, Ohio
- 32no bedroom
- 2771 bedroom
- 1,0272 bedrooms
- 7913 bedrooms
- 1594 bedrooms
- 785+ bedrooms
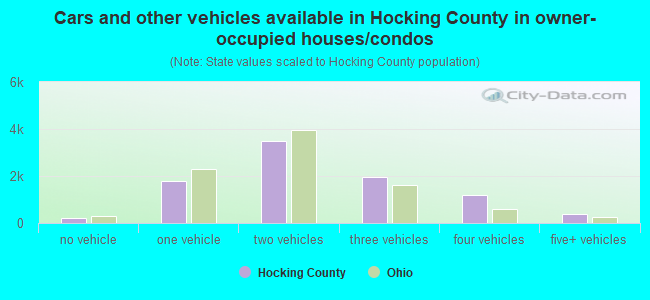
- Cars and other vehicles available in Hocking County in owner-occupied houses/condos
- 187no vehicle
- 1,8751 vehicle
- 3,5122 vehicles
- 2,0853 vehicles
- 1,1154 vehicles
- 3095+ vehicles
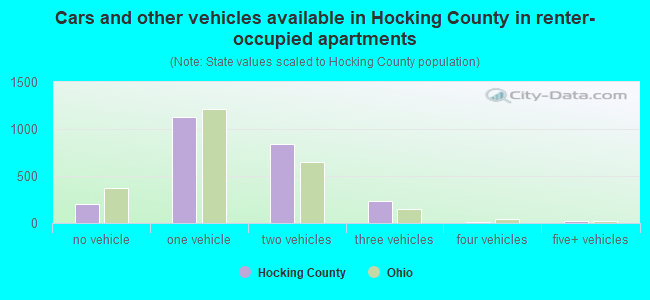
- Cars and other vehicles available in Hocking County in renter-occupied apartments
- 272no vehicle
- 1,1931 vehicle
- 7332 vehicles
- 1733 vehicles
- 84 vehicles
- 105+ vehicles
92.1% of Hocking County residents lived in the same house 1 years ago.
Out of people who lived in different houses, 33% lived in this county.
Out of people who lived in different counties, 81% lived in Ohio.
| Hocking County: | 92.1% |
| State average: | 87.8% |
Place of birth for U.S.-born residents:
- This state: 24,412
- Other state: 3,297
- Northeast: 491
- Midwest: 538
- South: 1,778
- West: 479
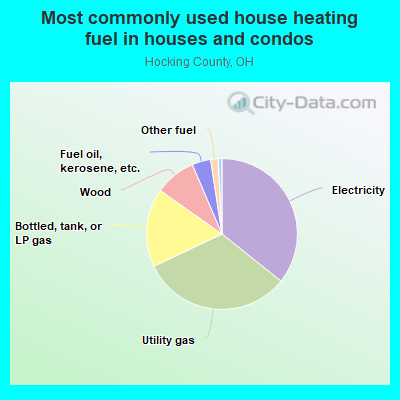
- 35.4%Electricity
- 33.3%Utility gas
- 17.8%Bottled, tank, or LP gas
- 7.2%Wood
- 3.7%Fuel oil, kerosene, etc.
- 1.4%Other fuel
- 1.1%No fuel used
- 0.1%Solar energy
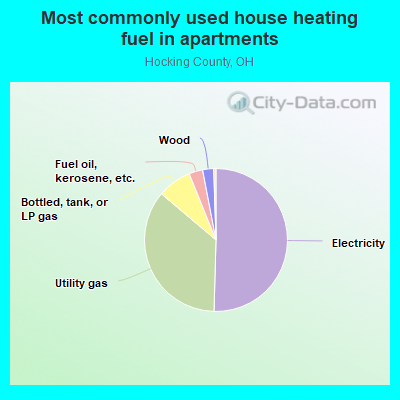
- 49.6%Electricity
- 36.6%Utility gas
- 7.4%Bottled, tank, or LP gas
- 3.5%Fuel oil, kerosene, etc.
- 2.3%Wood
- 0.5%Other fuel
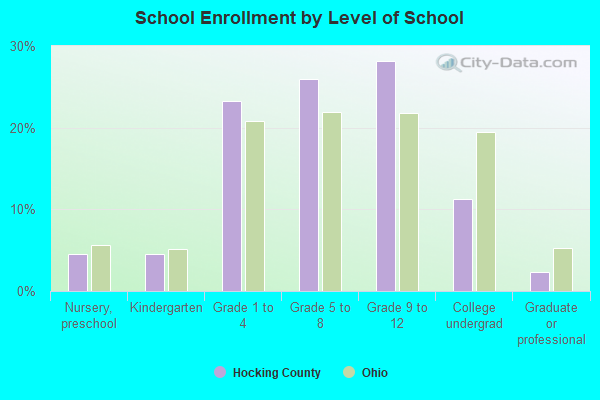
Private vs. public school enrollment:
| Here: | 12.4% |
| Ohio: | 16.0% |
| Here: | 2.2% |
| Ohio: | 13.1% |
| Here: | 8.9% |
| Ohio: | 22.3% |
Hocking County government finances - Expenditure in 2018:
- Charges - Hospital Public: $38,788,000
Hospital Public: $35,236,000
Other: $3,461,000
Other: $3,049,000
Sewerage: $225,000
Sewerage: $222,000
Regular Highways: $119,000
Regular Highways: $75,000
- Construction - Regular Highways: $1,630,000
- Current Operations - Hospitals: $42,121,000
Hospitals: $39,835,000
Health - Other: $7,850,000
Police Protection: $6,590,000
Health - Other: $5,999,000
Police Protection: $4,782,000
Central Staff Services: $3,783,000
Regular Highways: $3,474,000
Judicial and Legal Services: $3,104,000
Central Staff Services: $2,823,000
Regular Highways: $2,753,000
Judicial and Legal Services: $2,373,000
Public Welfare - Other: $1,533,000
Public Welfare - Other: $1,114,000
General - Other: $926,000
General - Other: $336,000
Parks and Recreation: $265,000
Parks and Recreation: $232,000
Sewerage: $212,000
Sewerage: $210,000
- General - Interest on Debt: $256,000
Interest on Debt: $144,000
- Intergovernmental to State - Sewerage: $3,671,000
General - Other: $91,000
General - Other: $84,000
- Long Term Debt - Beginning Outstanding - Unspecified Public Purpose: $6,412,000
Outstanding Unspecified Public Purpose: $5,073,000
Beginning Outstanding - Unspecified Public Purpose: $3,606,000
Outstanding Unspecified Public Purpose: $2,755,000
Retired Unspecified Public Purpose: $1,459,000
Retired Unspecified Public Purpose: $851,000
Issue, Unspecified Public Purpose: $120,000
- Miscellaneous - General Revenue - Other: $786,000
General Revenue - Other: $785,000
Fines and Forfeits: $660,000
Fines and Forfeits: $559,000
Interest Earnings: $473,000
Special Assessments: $300,000
Interest Earnings: $116,000
Sale of Property: $23,000
Special Assessments: $15,000
Sale of Property: $12,000
- Other Capital Outlay - Sewerage: $6,251,000
General - Other: $2,164,000
General - Other: $866,000
Regular Highways: $751,000
Hospitals: $429,000
Health - Other: $45,000
Sewerage: $8,000
- Other Funds - Cash and Securities: $15,951,000
Cash and Securities: $14,650,000
- State Intergovernmental - Sewerage: $10,776,000
Highways: $4,617,000
Highways: $3,303,000
Other: $2,738,000
Other: $2,670,000
Health and Hospitals: $2,226,000
Health and Hospitals: $1,940,000
General Local Government Support: $1,262,000
General Local Government Support: $1,151,000
- Tax - Property: $9,790,000
Property: $8,598,000
General Sales and Gross Receipts: $2,262,000
General Sales and Gross Receipts: $1,652,000
Other License: $90,000
Other License: $90,000
- Total Salaries and Wages: $71,000
: $54,000
Hocking County government finances - Revenue in 2018:
- Charges - Hospital Public: $38,788,000
Hospital Public: $35,236,000
Other: $3,461,000
Other: $3,049,000
Sewerage: $225,000
Sewerage: $222,000
Regular Highways: $119,000
Regular Highways: $75,000
- Construction - Regular Highways: $1,630,000
- Current Operations - Hospitals: $42,121,000
Hospitals: $39,835,000
Health - Other: $7,850,000
Police Protection: $6,590,000
Health - Other: $5,999,000
Police Protection: $4,782,000
Central Staff Services: $3,783,000
Regular Highways: $3,474,000
Judicial and Legal Services: $3,104,000
Central Staff Services: $2,823,000
Regular Highways: $2,753,000
Judicial and Legal Services: $2,373,000
Public Welfare - Other: $1,533,000
Public Welfare - Other: $1,114,000
General - Other: $926,000
General - Other: $336,000
Parks and Recreation: $265,000
Parks and Recreation: $232,000
Sewerage: $212,000
Sewerage: $210,000
- General - Interest on Debt: $256,000
Interest on Debt: $144,000
- Intergovernmental to State - Sewerage: $3,671,000
General - Other: $91,000
General - Other: $84,000
- Long Term Debt - Beginning Outstanding - Unspecified Public Purpose: $6,412,000
Outstanding Unspecified Public Purpose: $5,073,000
Beginning Outstanding - Unspecified Public Purpose: $3,606,000
Outstanding Unspecified Public Purpose: $2,755,000
Retired Unspecified Public Purpose: $1,459,000
Retired Unspecified Public Purpose: $851,000
Issue, Unspecified Public Purpose: $120,000
- Miscellaneous - General Revenue - Other: $786,000
General Revenue - Other: $785,000
Fines and Forfeits: $660,000
Fines and Forfeits: $559,000
Interest Earnings: $473,000
Special Assessments: $300,000
Interest Earnings: $116,000
Sale of Property: $23,000
Special Assessments: $15,000
Sale of Property: $12,000
- Other Capital Outlay - Sewerage: $6,251,000
General - Other: $2,164,000
General - Other: $866,000
Regular Highways: $751,000
Hospitals: $429,000
Health - Other: $45,000
Sewerage: $8,000
- Other Funds - Cash and Securities: $15,951,000
Cash and Securities: $14,650,000
- State Intergovernmental - Sewerage: $10,776,000
Highways: $4,617,000
Highways: $3,303,000
Other: $2,738,000
Other: $2,670,000
Health and Hospitals: $2,226,000
Health and Hospitals: $1,940,000
General Local Government Support: $1,262,000
General Local Government Support: $1,151,000
- Tax - Property: $9,790,000
Property: $8,598,000
General Sales and Gross Receipts: $2,262,000
General Sales and Gross Receipts: $1,652,000
Other License: $90,000
Other License: $90,000
- Total Salaries and Wages: $71,000
: $54,000
Hocking County government finances - Debt in 2018:
- Charges - Hospital Public: $38,788,000
Hospital Public: $35,236,000
Other: $3,461,000
Other: $3,049,000
Sewerage: $225,000
Sewerage: $222,000
Regular Highways: $119,000
Regular Highways: $75,000
- Construction - Regular Highways: $1,630,000
- Current Operations - Hospitals: $42,121,000
Hospitals: $39,835,000
Health - Other: $7,850,000
Police Protection: $6,590,000
Health - Other: $5,999,000
Police Protection: $4,782,000
Central Staff Services: $3,783,000
Regular Highways: $3,474,000
Judicial and Legal Services: $3,104,000
Central Staff Services: $2,823,000
Regular Highways: $2,753,000
Judicial and Legal Services: $2,373,000
Public Welfare - Other: $1,533,000
Public Welfare - Other: $1,114,000
General - Other: $926,000
General - Other: $336,000
Parks and Recreation: $265,000
Parks and Recreation: $232,000
Sewerage: $212,000
Sewerage: $210,000
- General - Interest on Debt: $256,000
Interest on Debt: $144,000
- Intergovernmental to State - Sewerage: $3,671,000
General - Other: $91,000
General - Other: $84,000
- Long Term Debt - Beginning Outstanding - Unspecified Public Purpose: $6,412,000
Outstanding Unspecified Public Purpose: $5,073,000
Beginning Outstanding - Unspecified Public Purpose: $3,606,000
Outstanding Unspecified Public Purpose: $2,755,000
Retired Unspecified Public Purpose: $1,459,000
Retired Unspecified Public Purpose: $851,000
Issue, Unspecified Public Purpose: $120,000
- Miscellaneous - General Revenue - Other: $786,000
General Revenue - Other: $785,000
Fines and Forfeits: $660,000
Fines and Forfeits: $559,000
Interest Earnings: $473,000
Special Assessments: $300,000
Interest Earnings: $116,000
Sale of Property: $23,000
Special Assessments: $15,000
Sale of Property: $12,000
- Other Capital Outlay - Sewerage: $6,251,000
General - Other: $2,164,000
General - Other: $866,000
Regular Highways: $751,000
Hospitals: $429,000
Health - Other: $45,000
Sewerage: $8,000
- Other Funds - Cash and Securities: $15,951,000
Cash and Securities: $14,650,000
- State Intergovernmental - Sewerage: $10,776,000
Highways: $4,617,000
Highways: $3,303,000
Other: $2,738,000
Other: $2,670,000
Health and Hospitals: $2,226,000
Health and Hospitals: $1,940,000
General Local Government Support: $1,262,000
General Local Government Support: $1,151,000
- Tax - Property: $9,790,000
Property: $8,598,000
General Sales and Gross Receipts: $2,262,000
General Sales and Gross Receipts: $1,652,000
Other License: $90,000
Other License: $90,000
- Total Salaries and Wages: $71,000
: $54,000
Hocking County government finances - Cash and Securities in 2018:
- Charges - Hospital Public: $38,788,000
Hospital Public: $35,236,000
Other: $3,461,000
Other: $3,049,000
Sewerage: $225,000
Sewerage: $222,000
Regular Highways: $119,000
Regular Highways: $75,000
- Construction - Regular Highways: $1,630,000
- Current Operations - Hospitals: $42,121,000
Hospitals: $39,835,000
Health - Other: $7,850,000
Police Protection: $6,590,000
Health - Other: $5,999,000
Police Protection: $4,782,000
Central Staff Services: $3,783,000
Regular Highways: $3,474,000
Judicial and Legal Services: $3,104,000
Central Staff Services: $2,823,000
Regular Highways: $2,753,000
Judicial and Legal Services: $2,373,000
Public Welfare - Other: $1,533,000
Public Welfare - Other: $1,114,000
General - Other: $926,000
General - Other: $336,000
Parks and Recreation: $265,000
Parks and Recreation: $232,000
Sewerage: $212,000
Sewerage: $210,000
- General - Interest on Debt: $256,000
Interest on Debt: $144,000
- Intergovernmental to State - Sewerage: $3,671,000
General - Other: $91,000
General - Other: $84,000
- Long Term Debt - Beginning Outstanding - Unspecified Public Purpose: $6,412,000
Outstanding Unspecified Public Purpose: $5,073,000
Beginning Outstanding - Unspecified Public Purpose: $3,606,000
Outstanding Unspecified Public Purpose: $2,755,000
Retired Unspecified Public Purpose: $1,459,000
Retired Unspecified Public Purpose: $851,000
Issue, Unspecified Public Purpose: $120,000
- Miscellaneous - General Revenue - Other: $786,000
General Revenue - Other: $785,000
Fines and Forfeits: $660,000
Fines and Forfeits: $559,000
Interest Earnings: $473,000
Special Assessments: $300,000
Interest Earnings: $116,000
Sale of Property: $23,000
Special Assessments: $15,000
Sale of Property: $12,000
- Other Capital Outlay - Sewerage: $6,251,000
General - Other: $2,164,000
General - Other: $866,000
Regular Highways: $751,000
Hospitals: $429,000
Health - Other: $45,000
Sewerage: $8,000
- Other Funds - Cash and Securities: $15,951,000
Cash and Securities: $14,650,000
- State Intergovernmental - Sewerage: $10,776,000
Highways: $4,617,000
Highways: $3,303,000
Other: $2,738,000
Other: $2,670,000
Health and Hospitals: $2,226,000
Health and Hospitals: $1,940,000
General Local Government Support: $1,262,000
General Local Government Support: $1,151,000
- Tax - Property: $9,790,000
Property: $8,598,000
General Sales and Gross Receipts: $2,262,000
General Sales and Gross Receipts: $1,652,000
Other License: $90,000
Other License: $90,000
- Total Salaries and Wages: $71,000
: $54,000
Supplemental Security Income (SSI) in 2006:
- Total number of recipients: 876
- Number of aged recipients: 43
- Number of blind and disabled recipients: 833
- Number of recipients under 18: 110
- Number of recipients between 18 and 64: 639
- Number of recipients older than 64: 127
- Number of recipients also receiving OASDI: 291
- Amount of payments (thousands of dollars): 417
| Most common first names in Hocking County, OH among deceased individuals | ||
| Name | Count | Lived (average) |
|---|---|---|
| John | 202 | 73.8 years |
| Mary | 183 | 81.3 years |
| Charles | 173 | 75.3 years |
| William | 151 | 74.2 years |
| James | 138 | 72.6 years |
| Robert | 129 | 70.5 years |
| George | 82 | 75.0 years |
| Ruth | 73 | 78.0 years |
| Dorothy | 70 | 75.4 years |
| Harry | 65 | 76.9 years |
| Most common last names in Hocking County, OH among deceased individuals | ||
| Last name | Count | Lived (average) |
|---|---|---|
| Smith | 97 | 77.2 years |
| Brown | 57 | 78.8 years |
| Davis | 56 | 75.9 years |
| Miller | 54 | 76.1 years |
| Thompson | 41 | 75.5 years |
| Wilson | 41 | 78.1 years |
| Wolfe | 39 | 78.2 years |
| Poling | 38 | 75.3 years |
| Johnson | 34 | 73.0 years |
| Anderson | 32 | 71.9 years |
| Businesses in Hocking County, OH | ||||
| Name | Count | Name | Count | |
|---|---|---|---|---|
| Arby's | 1 | Kroger | 1 | |
| AutoZone | 1 | Lane Furniture | 1 | |
| Baymont Inn | 1 | Little Caesars Pizza | 1 | |
| Burger King | 1 | MasterBrand Cabinets | 1 | |
| CVS | 1 | McDonald's | 1 | |
| Chevrolet | 1 | Nike | 1 | |
| Dairy Queen | 1 | RadioShack | 1 | |
| Domino's Pizza | 1 | Sears | 1 | |
| Fashion Bug | 1 | T-Mobile | 1 | |
| FedEx | 2 | Toyota | 1 | |
| Ford | 1 | U-Haul | 1 | |
| GameStop | 1 | UPS | 2 | |
| H&R Block | 1 | Walmart | 1 | |
| Holiday Inn | 1 | Wendy's | 1 | |
| KFC | 1 | |||