Jack County, Texas (TX)
County owner-occupied free and clear houses and condos in 2010: 1,341
County owner-occupied houses and condos in 2000: 2,341
Renter-occupied apartments: 738 (it was 706 in 2000)
| % of renters here: | 23% |
| State: | 36% |
Land area: 917 sq. mi.
Water area: 3.5 sq. mi.
Population density: 10 people per square mile (low).
Industries providing employment: Educational, health and social services (21.2%), Transportation and warehousing,and utilities (10.5%), Retail trade (10.3%), Construction (10.0%).
Type of workers:
- Private wage or salary: 71%
- Government: 17%
- Self-employed, not incorporated: 11%
- Unpaid family work: 0%
- OSM Map
- General Map
- Google Map
- MSN Map


- 6,49174.9%White Non-Hispanic Alone
- 1,59018.4%Hispanic or Latino
- 3353.9%Black Non-Hispanic Alone
- 1812.1%Two or more races
- 640.7%Asian alone

| Median resident age: | 39.6 years |
| Texas median age: | 35.6 years |
| Males: 4,902 | |
| Females: 3,916 |

 | When will Sherman/Denison Be In DFW Metro? (66 replies) |
| Strangest climate I have seen (425 replies) |
| New County Population Estimates from the Census Bureau for Jluy 1, 2016 posted this morning about 9 A. M. (13 replies) |
| Prettiest Town in Texas (57 replies) |
| Who Has the Best Home Cooking in Texas? (107 replies) |
| Please Help If You Can!!! (41 replies) |
| Jack County: | 2.0 people |
| Texas: | 3 people |
Estimated median household income in 2022: $58,255 ($32,500 in 1999)
| This county: | $58,255 |
| Texas: | $72,284 |
Median contract rent in 2022 for apartments: $684 (lower quartile is $359, upper quartile is $782)
| This county: | $684 |
| State: | $1117 |
Estimated median house or condo value in 2022: $156,793 (it was $47,200 in 2000)
| Jack: | $156,793 |
| Texas: | $275,400 |
Median monthly housing costs for homes and condos with a mortgage: $1,566
Median monthly housing costs for units without a mortgage: $480
Institutionalized population: 1,140
Crime in 2021 (reported by the sheriff's office or county police, not the county total):
- Murders: 0
- Rapes: 0
- Robberies: 0
- Assaults: 1
- Burglaries: 14
- Thefts: 4
- Auto thefts: 4
Crime in 2020 (reported by the sheriff's office or county police, not the county total):
- Murders: 0
- Rapes: 2
- Robberies: 0
- Assaults: 8
- Burglaries: 12
- Thefts: 19
- Auto thefts: 5

Single-family new house construction building permits:
- 2022: 8 buildings, average cost: $253,200
- 2021: 1 building, cost: $13,000
- 2020: 0 buildings
- 2019: 0 buildings
- 2018: 3 buildings, average cost: $205,000
- 2017: 0 buildings
- 2016: 2 buildings, average cost: $596,500
- 2015: 0 buildings
- 2014: 5 buildings, average cost: $67,700
- 2013: 3 buildings, average cost: $116,700
- 2012: 10 buildings, average cost: $32,600
- 2011: 6 buildings, average cost: $35,000
- 2010: 4 buildings, average cost: $35,000
- 2009: 10 buildings, average cost: $35,000
- 2008: 1 building, cost: $650,000
- 2007: 1 building, cost: $55,000
- 2006: 4 buildings, average cost: $16,800
- 2005: 1 building, cost: $32,000
- 2004: 3 buildings, average cost: $141,300
- 2003: 2 buildings, average cost: $143,000
- 2002: 0 buildings
- 2001: 3 buildings, average cost: $71,000
- 2000: 0 buildings
- 1999: 1 building, cost: $65,000
- 1998: 0 buildings
- 1997: 0 buildings


Median real estate property taxes paid for housing units with mortgages in 2022: $2,815 (1.4%)
Median real estate property taxes paid for housing units with no mortgage in 2022: $1,513 (1.3%)


| Jack County: | 14.5% |
| Texas: | 14.0% |
Median age of residents in 2022: 39.6 years old
(Males: 37.5 years old, Females: 43.0 years old)
(Median age for: White residents: 43.6 years old, Black residents: 38.1 years old, Asian residents: 54.4 years old, Hispanic or Latino residents: 26.2 years old, Other race residents: 31.8 years old)
Fair market rent in 2006 for a 1-bedroom apartment in Jack County is $389 a month.
Fair market rent for a 2-bedroom apartment is $484 a month.
Fair market rent for a 3-bedroom apartment is $617 a month.
Neighboring counties: Hot Spring County, Arkansas  , Callahan County
  , Lamar County, Alabama
  , McDuffie County, Georgia .
| Here: | 3.0% |
| Texas: | 3.5% |


Current college students: 315
People 25 years of age or older with a high school degree or higher: 79.6%
People 25 years of age or older with a bachelor's degree or higher: 15.5%
Number of foreign born residents: 435 (31.1% naturalized citizens)
| Jack County: | 4.9% |
| Whole state: | 17.2% |

- Year of entry for the foreign-born population
- 1442010 or later
- 1332000 to 2009
- 881990 to 1999
- 731980 to 1989
- 571970 to 1979
- 13Before 1970
Mean travel time to work (commute): minutes
Percentage of county residents living and working in this county: 97.6%


Housing units in structures:
- One, detached: 2,939
- One, attached: 4
- Two: 40
- 3 or 4: 146
- 5 to 9: 58
- 20 to 49: 25
- 50 or more: 1
- Mobile homes: 670
- Boats, RVs, vans, etc.: 57
Housing units in Jack County with a mortgage: 981 (25 second mortgage, 0 home equity loan, 27 both second mortgage and home equity loan)
Houses without a mortgage: 0
| Here: | 100.0% with mortgage |
| State: | 98.4% with mortgage |
Religion statistics for Jack County
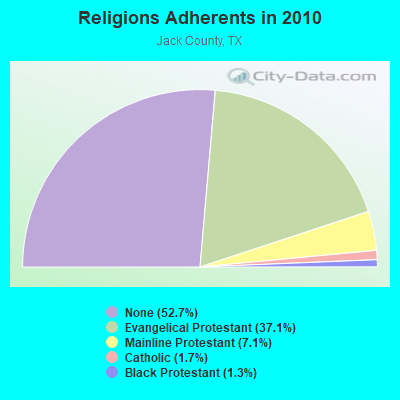
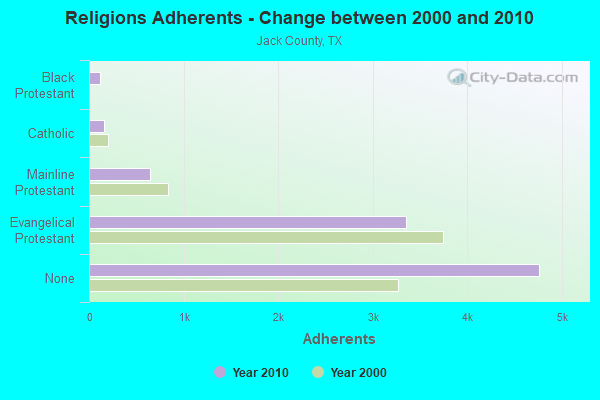
| Religion | Adherents | Congregations |
|---|---|---|
| Evangelical Protestant | 3,355 | 26 |
| Mainline Protestant | 641 | 6 |
| Catholic | 158 | 1 |
| Black Protestant | 120 | 1 |
| Other | 8 | - |
| None | 4,762 | - |
Source: Clifford Grammich, Kirk Hadaway, Richard Houseal, Dale E.Jones, Alexei Krindatch, Richie Stanley and Richard H.Taylor. 2012. 2010 U.S.Religion Census: Religious Congregations & Membership Study. Association of Statisticians of American Religious Bodies. Jones, Dale E., et al. 2002. Congregations and Membership in the United States 2000. Nashville, TN: Glenmary Research Center.
Food Environment Statistics:
| Jack County: | 2.27 / 10,000 pop. |
| State: | 1.47 / 10,000 pop. |
| This county: | 3.40 / 10,000 pop. |
| Texas: | 1.11 / 10,000 pop. |
| Jack County: | 5.67 / 10,000 pop. |
| Texas: | 3.95 / 10,000 pop. |
| This county: | 6.81 / 10,000 pop. |
| State: | 6.13 / 10,000 pop. |
| Jack County: | 10.0% |
| Texas: | 8.9% |
| Jack County: | 27.4% |
| State: | 26.6% |
| Here: | 9.9% |
| State: | 15.7% |
Agriculture in Jack County:
Average size of farms: 674 acresAverage value of agricultural products sold per farm: $17,593
Average value of crops sold per acre for harvested cropland: $43.53
The value of livestock, poultry, and their products as a percentage of the total market value of agricultural products sold: 94.91%
Average total farm production expenses per farm: $21,662
Harvested cropland as a percentage of land in farms: 3.05%
Irrigated harvested cropland as a percentage of land in farms: 1.01%
Average market value of all machinery and equipment per farm: $22,911
The percentage of farms operated by a family or individual: 92.76%
Average age of principal farm operators: 57 years
Average number of cattle and calves per 100 acres of all land in farms: 8.64
All wheat for grain: 1685 harvested acres
Land in orchards: 561 acres
Earthquake activity:
Jack County-area historical earthquake activity is significantly above Texas state average. It is 513% greater than the overall U.S. average.On 11/6/2011 at 03:53:10, a magnitude 5.7 (5.7 MW, Depth: 3.2 mi, Class: Moderate, Intensity: VI - VII) earthquake occurred 179.6 miles away from Jack County center
On 9/3/2016 at 12:02:44, a magnitude 5.8 (5.8 MW, Depth: 3.5 mi) earthquake occurred 233.4 miles away from the county center
On 6/16/1978 at 11:46:54, a magnitude 5.3 (4.4 MB, 4.6 UK, 5.3 ML) earthquake occurred 150.9 miles away from the county center
On 11/7/2016 at 01:44:24, a magnitude 5.0 (5.0 MW, Depth: 2.8 mi) earthquake occurred 207.6 miles away from the county center
On 2/13/2016 at 17:07:06, a magnitude 5.1 (5.1 MW, Depth: 5.2 mi) earthquake occurred 229.0 miles away from Jack County center
On 11/8/2011 at 02:46:57, a magnitude 4.8 (4.8 MW, Depth: 3.1 mi, Class: Light, Intensity: IV - V) earthquake occurred 179.0 miles away from the county center
Magnitude types: body-wave magnitude (MB), local magnitude (ML), moment magnitude (MW)
Most recent natural disasters:
- Texas Covid-19 Pandemic, Incident Period: January 20, 2020, FEMA Id: 4485, Natural disaster type: Other
- Texas Severe Storms, Tornadoes, Straight-line Winds, and Flooding, Incident Period: May 04, 2015 to June 23, 2015, Major Disaster (Presidential) Declared DR-4223: May 29, 2015, FEMA Id: 4223, Natural disaster type: Storm, Tornado, Flood, Wind
- Texas Bryson Fire Complex, Incident Period: April 15, 2011 to April 22, 2011, Fire Management Assistance Declared: April 17, 2011, FEMA Id: 2896, Natural disaster type: Fire
- Texas Enmin Fire, Incident Period: March 11, 2011 to March 17, 2011, Fire Management Assistance Declared: March 11, 2011, FEMA Id: 2867, Natural disaster type: Fire
- Texas Wildfires, Incident Period: March 14, 2008 to September 01, 2008, Emergency Declared EM-3284: March 14, 2008, FEMA Id: 3284, Natural disaster type: Fire
- Texas Hurricane Rita, Incident Period: September 23, 2005 to October 14, 2005, Major Disaster (Presidential) Declared DR-1606: September 24, 2005, FEMA Id: 1606, Natural disaster type: Hurricane
- Texas Hurricane Rita, Incident Period: September 20, 2005 to October 14, 2005, Emergency Declared EM-3261: September 21, 2005, FEMA Id: 3261, Natural disaster type: Hurricane
- Texas Hurricane Katrina, Incident Period: August 29, 2005 to October 01, 2005, Emergency Declared EM-3216: September 02, 2005, FEMA Id: 3216, Natural disaster type: Hurricane
- Texas Extreme Fire Hazards, Incident Period: August 01, 1999 to December 10, 1999, Emergency Declared EM-3142: September 01, 1999, FEMA Id: 3142, Natural disaster type: Fire
- Texas Extreme Fire Hazard, Incident Period: August 30, 1993 to November 15, 1993, Emergency Declared EM-3113: September 10, 1993, FEMA Id: 3113, Natural disaster type: Fire
- 2 other natural disasters have been reported since 1953.
The number of natural disasters in Jack County (12) is smaller than the US average (15).
Major Disasters (Presidential) Declared: 4
Emergencies Declared: 5
Causes of natural disasters: Fires: 5, Floods: 3, Hurricanes: 3, Storms: 3, Tornadoes: 3, Wind: 1, Other: 1 (Note: some incidents may be assigned to more than one category).

Means of transportation to work:
- Drove a car alone: 2,012 (79.4%)
- Carpooled: 149 (5.9%)
- Taxicab, motorcycle, or other means: 25 (1.0%)
- Walked: 42 (1.7%)
- Worked at home: 266 (10.5%)


- Health care and social assistance (17%)
- Educational services (10%)
- Retail trade (9%)
- Finance and insurance (8%)
- Public administration (6%)
- Other services, except public administration (5%)
- Construction (4%)

- Health care and social assistance (23%)
- Educational services (13%)
- Retail trade (12%)
- Finance and insurance (10%)
- Public administration (8%)
- Other services, except public administration (6%)
- Construction (5%)

- Construction and extraction occupations (19%)
- Transportation occupations (17%)
- Sales and related occupations (8%)
- Management occupations (8%)
- Installation, maintenance, and repair occupations (8%)
- Food preparation and serving related occupations (5%)
- Production occupations (5%)

- Office and administrative support occupations (24%)
- Sales and related occupations (13%)
- Health diagnosing and treating practitioners and other technical occupations (12%)
- Healthcare support occupations (8%)
- Educational instruction, and library occupations (8%)
- Food preparation and serving related occupations (6%)
- Management occupations (6%)

- Mexico (68%)
- Cuba (13%)
- China, excluding Hong Kong and Taiwan (9%)
- Canada (5%)
- Netherlands (1%)
- Other Middle Africa (1%)
- United Kingdom, excluding England and Scotland (0%)

- English (18%)
- American (13%)
- Irish (5%)
- German (4%)
- European (2%)
- Scottish (2%)
- Scotch-Irish (1%)


People in group quarters in Jack County, Texas in 2010:
- 1,033 people in state prisons
- 64 people in local jails and other municipal confinement facilities
- 43 people in nursing facilities/skilled-nursing facilities
People in group quarters in Jack County, Texas in 2000:
- 984 people in state prisons
- 81 people in nursing homes
- 16 people in local jails and other confinement facilities (including police lockups)
11.13% of this county's 2021 resident taxpayers lived in other counties in 2020 ($49,550 average adjusted gross income)
| Here: | 11.13% |
| Texas average: | 8.12% |
10 or fewer of this county's residents moved from foreign countries.
10.37% relocated from other counties in Texas ($45,397 average AGI)
0.77% relocated from other states ($4,153 average AGI)
Jack County: 0.77% Texas average: 2.83%

Top counties from which taxpayers relocated into this county between 2020 and 2021:
| from Tarrant County, TX | |
| from Parker County, TX | |
| from Wise County, TX | |
| from Palo Pinto County, TX |
7.66% of this county's 2020 resident taxpayers moved to other counties in 2021 ($50,580 average adjusted gross income)
| Here: | 7.66% |
| Texas average: | 7.40% |
10 or fewer of this county's residents moved to foreign countries.
7.66% relocated to other counties in Texas ($50,580 average AGI)
10 or fewer of this county's residents relocated to other states.

Top counties to which taxpayers relocated from this county between 2020 and 2021:
| to Parker County, TX | |
| to Wise County, TX | |
| to Tarrant County, TX |
Births per 1000 population from 1990 to 1999: 11.4
Births per 1000 population from 2000 to 2006: 10.8

Deaths per 1000 population from 1990 to 1999: 12.4
Deaths per 1000 population from 2000 to 2009: 10.0
Deaths per 1000 population from 2010 to 2020: 10.5

Infant deaths per 1000 live births from 1990 to 1999: 6.7
Infant deaths per 1000 live births from 2000 to 2006: 16.4

Persons under 19 years old without health insurance coverage in 2018: 14.5%


Persons enrolled in hospital insurance and/or supplemental medical insurance (Medicare) in July 1, 2007: 1,461 (1,288 aged, 173 disabled)
Children under 18 without health insurance coverage in 2007: 362 (20%)


Most common underlying causes of death in Jack County, Texas in 1999 - 2019:
- Bronchus or lung, unspecified - Malignant neoplasms (35)
- Acute myocardial infarction, unspecified (22)
- Chronic obstructive pulmonary disease, unspecified (10)
Population without health insurance coverage in 2000: 17%
Children under 18 without health insurance coverage in 2000: 17%
Short term general hospital admissions per 100,000 population in 2004: 4,999
Short term general hospital beds per 100,000 population in 2004: 189
Emergency room visits per 100,000 population in 2004: 29,384
General practice office based MDs per 100,000 population in 2005: 838
Medical specialist MDs per 100,000 population in 2005: 1,136
Total births per 100,000 population, July 2005 - July 2006 : 27
Total deaths per 100,000 population, July 2005 - July 2006: 66
Household type by relationship:
Households: 8,818- Male householders: 1,453 (394 living alone), Female householders: 1,715 (497 living alone)
1,633 spouses (1,633 opposite-sex spouses), 176 unmarried partners, (176 opposite-sex unmarried partners), 2,413 children (2,107 natural, 93 adopted, 213 stepchildren), 123 grandchildren, 38 brothers or sisters, 56 parents, 0 foster children, 151 other relatives, 42 non-relatives
- In group quarters: 1,029
Size of family households: 1,025 2-persons, 476 3-persons, 408 4-persons, 152 5-persons, 70 6-persons, 42 7-or-more-persons.
Size of nonfamily households: 891 1-person, 103 2-persons.
1,209 married couples with children.
529 single-parent households (105 men, 424 women).
87.1% of residents of Jack speak English at home.
11.4% of residents speak Spanish at home (47% speak English very well, 30% speak English well, 11% speak English not well, 12% don't speak English at all).
0.3% of residents speak other Indo-European language at home (52% speak English very well, 48% speak English well).
0.7% of residents speak Asian or Pacific Island language at home (71% speak English very well, 29% speak English well).
0.5% of residents speak other language at home (100% speak English very well).
In fiscal year 2004:
Federal Government expenditure: $40,328,000 ($4,490 per capita)
Department of Defense expenditure: $705,000
Federal direct payments to individuals for retirement and disability: $17,837,000
Federal other direct payments to individuals: $11,225,000
Federal direct payments not to individuals: $166,000
Federal grants: $9,513,000
Federal procurement contracts: $315,000 ($0,000 Department of Defense)
Federal salaries and wages: $1,272,000 ($0,000 Department of Defense)
Federal Government direct loans: $6,000
Federal guaranteed/insured loans: $876,000
Federal Government insurance: $279,000
Population change from April 1, 2000 to July 1, 2005:
Births: 506| Here: | 56 per 1000 residents |
| State: | 85 per 1000 residents |
Deaths: 494
| Here: | 55 per 1000 residents |
| State: | 35 per 1000 residents |
Net international migration: +62
| Here: | +7 per 1000 residents |
| State: | +29 per 1000 residents |
Net internal migration: +239
| Here: | +26 per 1000 residents |
| State: | +10 per 1000 residents |

Total withdrawal of fresh water for public supply: 0.65 millions of gallons per day (all from surface)
| Here: | 5.7 |
| State: | 6.3 |
| Here: | 4.2 |
| State: | 4.0 |

- Year house built in Jack County, Texas
- 212020 or later
- 2742010 to 2019
- 5942000 to 2009
- 2611990 to 1999
- 4721980 to 1989
- 6691970 to 1979
- 4621960 to 1969
- 4601950 to 1959
- 2141940 to 1949
- 3481939 or earlier

- Rooms in owner-occupied houses in Jack County, Texas
- 311 room
- 572 rooms
- 323 rooms
- 3084 rooms
- 6275 rooms
- 4456 rooms
- 3717 rooms
- 2498 rooms
- 1929+ rooms

- Rooms in renter-occupied apartments in Jack County, Texas
- 01 room
- 02 rooms
- 1563 rooms
- 3424 rooms
- 1295 rooms
- 1626 rooms
- 267 rooms
- 148 rooms
- 09+ rooms

- Bedrooms in owner-occupied houses in Jack County, Texas
- 50no bedroom
- 451 bedroom
- 4482 bedrooms
- 1,3533 bedrooms
- 3114 bedrooms
- 1005+ bedrooms

- Bedrooms in renter-occupied apartments in Jack County, Texas
- 0no bedroom
- 1291 bedroom
- 4162 bedrooms
- 2733 bedrooms
- 144 bedrooms
- 95+ bedrooms

- Cars and other vehicles available in Jack County in owner-occupied houses/condos
- 123no vehicle
- 6081 vehicle
- 9362 vehicles
- 4953 vehicles
- 1124 vehicles
- 425+ vehicles

- Cars and other vehicles available in Jack County in renter-occupied apartments
- 231no vehicle
- 3491 vehicle
- 2062 vehicles
- 583 vehicles
- 74 vehicles
- 105+ vehicles
84.6% of Jack County residents lived in the same house 1 years ago.
Out of people who lived in different houses, 16% lived in this county.
Out of people who lived in different counties, 88% lived in Texas.
| Jack County: | 84.6% |
| State average: | 85.7% |
Place of birth for U.S.-born residents:
- This state: 6,511
- Other state: 1,691
- Northeast: 112
- Midwest: 456
- South: 506
- West: 623


- 52.2%Electricity
- 28.7%Utility gas
- 17.9%Bottled, tank, or LP gas
- 0.9%Wood
- 0.3%Other fuel

- 48.8%Electricity
- 41.5%Utility gas
- 9.7%Bottled, tank, or LP gas
Private vs. public school enrollment:
| Here: | 2.2% |
| Texas: | 8.8% |
| Here: | 13.7% |
| Texas: | 8.0% |
| Here: | 1.4% |
| Texas: | 16.2% |


Jack County government finances - Expenditure in 2017:
- Bond Funds - Cash and Securities: $46,000
- Charges - Other: $344,000
Regular Highways: $8,000
- Construction - Regular Highways: $194,000
General - Other: $66,000
Judicial and Legal Services: $3,000
- Current Operations - Correctional Institutions: $667,000
Judicial and Legal Services: $548,000
Corrections - Other: $447,000
Police Protection: $401,000
General - Other: $294,000
Regular Highways: $290,000
Financial Administration: $117,000
General Public Buildings: $61,000
Local Fire Protection: $28,000
Central Staff Services: $27,000
Public Welfare, Vendor Payments for Medical Care: $23,000
Public Welfare - Other: $20,000
Natural Resources - Other: $8,000
Solid Waste Management: $8,000
- Federal Intergovernmental - Other: $22,000
- General - Interest on Debt: $38,000
- Local Intergovernmental - Other: $39,000
- Long Term Debt - Beginning Outstanding - Unspecified Public Purpose: $1,043,000
Outstanding Unspecified Public Purpose: $910,000
Retired Unspecified Public Purpose: $133,000
- Miscellaneous - General Revenue - Other: $119,000
Fines and Forfeits: $52,000
Interest Earnings: $10,000
Rents: $3,000
Sale of Property: $1,000
Donations From Private Sources: $1,000
- Other Capital Outlay - General - Other: $44,000
Corrections - Other: $17,000
Correctional Institutions: $7,000
Judicial and Legal Services: $3,000
Central Staff Services: $1,000
Police Protection: $1,000
- Other Funds - Cash and Securities: $2,022,000
- Sinking Funds - Cash and Securities: $63,000
- State Intergovernmental - Other: $136,000
General Local Government Support: $21,000
Highways: $4,000
- Tax - Property: $2,045,000
General Sales and Gross Receipts: $652,000
Motor Vehicle License: $129,000
Other Selective Sales: $78,000
Amusements Sales: $3,000
Jack County government finances - Revenue in 2017:
- Bond Funds - Cash and Securities: $46,000
- Charges - Other: $344,000
Regular Highways: $8,000
- Construction - Regular Highways: $194,000
General - Other: $66,000
Judicial and Legal Services: $3,000
- Current Operations - Correctional Institutions: $667,000
Judicial and Legal Services: $548,000
Corrections - Other: $447,000
Police Protection: $401,000
General - Other: $294,000
Regular Highways: $290,000
Financial Administration: $117,000
General Public Buildings: $61,000
Local Fire Protection: $28,000
Central Staff Services: $27,000
Public Welfare, Vendor Payments for Medical Care: $23,000
Public Welfare - Other: $20,000
Natural Resources - Other: $8,000
Solid Waste Management: $8,000
- Federal Intergovernmental - Other: $22,000
- General - Interest on Debt: $38,000
- Local Intergovernmental - Other: $39,000
- Long Term Debt - Beginning Outstanding - Unspecified Public Purpose: $1,043,000
Outstanding Unspecified Public Purpose: $910,000
Retired Unspecified Public Purpose: $133,000
- Miscellaneous - General Revenue - Other: $119,000
Fines and Forfeits: $52,000
Interest Earnings: $10,000
Rents: $3,000
Sale of Property: $1,000
Donations From Private Sources: $1,000
- Other Capital Outlay - General - Other: $44,000
Corrections - Other: $17,000
Correctional Institutions: $7,000
Judicial and Legal Services: $3,000
Central Staff Services: $1,000
Police Protection: $1,000
- Other Funds - Cash and Securities: $2,022,000
- Sinking Funds - Cash and Securities: $63,000
- State Intergovernmental - Other: $136,000
General Local Government Support: $21,000
Highways: $4,000
- Tax - Property: $2,045,000
General Sales and Gross Receipts: $652,000
Motor Vehicle License: $129,000
Other Selective Sales: $78,000
Amusements Sales: $3,000
Jack County government finances - Debt in 2017:
- Bond Funds - Cash and Securities: $46,000
- Charges - Other: $344,000
Regular Highways: $8,000
- Construction - Regular Highways: $194,000
General - Other: $66,000
Judicial and Legal Services: $3,000
- Current Operations - Correctional Institutions: $667,000
Judicial and Legal Services: $548,000
Corrections - Other: $447,000
Police Protection: $401,000
General - Other: $294,000
Regular Highways: $290,000
Financial Administration: $117,000
General Public Buildings: $61,000
Local Fire Protection: $28,000
Central Staff Services: $27,000
Public Welfare, Vendor Payments for Medical Care: $23,000
Public Welfare - Other: $20,000
Natural Resources - Other: $8,000
Solid Waste Management: $8,000
- Federal Intergovernmental - Other: $22,000
- General - Interest on Debt: $38,000
- Local Intergovernmental - Other: $39,000
- Long Term Debt - Beginning Outstanding - Unspecified Public Purpose: $1,043,000
Outstanding Unspecified Public Purpose: $910,000
Retired Unspecified Public Purpose: $133,000
- Miscellaneous - General Revenue - Other: $119,000
Fines and Forfeits: $52,000
Interest Earnings: $10,000
Rents: $3,000
Sale of Property: $1,000
Donations From Private Sources: $1,000
- Other Capital Outlay - General - Other: $44,000
Corrections - Other: $17,000
Correctional Institutions: $7,000
Judicial and Legal Services: $3,000
Central Staff Services: $1,000
Police Protection: $1,000
- Other Funds - Cash and Securities: $2,022,000
- Sinking Funds - Cash and Securities: $63,000
- State Intergovernmental - Other: $136,000
General Local Government Support: $21,000
Highways: $4,000
- Tax - Property: $2,045,000
General Sales and Gross Receipts: $652,000
Motor Vehicle License: $129,000
Other Selective Sales: $78,000
Amusements Sales: $3,000
Jack County government finances - Cash and Securities in 2017:
- Bond Funds - Cash and Securities: $46,000
- Charges - Other: $344,000
Regular Highways: $8,000
- Construction - Regular Highways: $194,000
General - Other: $66,000
Judicial and Legal Services: $3,000
- Current Operations - Correctional Institutions: $667,000
Judicial and Legal Services: $548,000
Corrections - Other: $447,000
Police Protection: $401,000
General - Other: $294,000
Regular Highways: $290,000
Financial Administration: $117,000
General Public Buildings: $61,000
Local Fire Protection: $28,000
Central Staff Services: $27,000
Public Welfare, Vendor Payments for Medical Care: $23,000
Public Welfare - Other: $20,000
Natural Resources - Other: $8,000
Solid Waste Management: $8,000
- Federal Intergovernmental - Other: $22,000
- General - Interest on Debt: $38,000
- Local Intergovernmental - Other: $39,000
- Long Term Debt - Beginning Outstanding - Unspecified Public Purpose: $1,043,000
Outstanding Unspecified Public Purpose: $910,000
Retired Unspecified Public Purpose: $133,000
- Miscellaneous - General Revenue - Other: $119,000
Fines and Forfeits: $52,000
Interest Earnings: $10,000
Rents: $3,000
Sale of Property: $1,000
Donations From Private Sources: $1,000
- Other Capital Outlay - General - Other: $44,000
Corrections - Other: $17,000
Correctional Institutions: $7,000
Judicial and Legal Services: $3,000
Central Staff Services: $1,000
Police Protection: $1,000
- Other Funds - Cash and Securities: $2,022,000
- Sinking Funds - Cash and Securities: $63,000
- State Intergovernmental - Other: $136,000
General Local Government Support: $21,000
Highways: $4,000
- Tax - Property: $2,045,000
General Sales and Gross Receipts: $652,000
Motor Vehicle License: $129,000
Other Selective Sales: $78,000
Amusements Sales: $3,000
Supplemental Security Income (SSI) in 2006:
- Total number of recipients: 136
- Number of aged recipients: 25
- Number of blind and disabled recipients: 111
- Number of recipients under 18: 22
- Number of recipients between 18 and 64: 79
- Number of recipients older than 64: 35
- Number of recipients also receiving OASDI: 57
- Amount of payments (thousands of dollars): 60
| Most common first names in Jack County, TX among deceased individuals | ||
| Name | Count | Lived (average) |
|---|---|---|
| Mary | 28 | 84.0 years |
| James | 26 | 74.3 years |
| William | 23 | 76.6 years |
| Ruby | 15 | 83.1 years |
| John | 14 | 74.8 years |
| Robert | 13 | 75.5 years |
| Betty | 12 | 70.1 years |
| George | 11 | 83.2 years |
| Dorothy | 11 | 84.9 years |
| Carl | 10 | 80.0 years |
| Most common last names in Jack County, TX among deceased individuals | ||
| Last name | Count | Lived (average) |
|---|---|---|
| Smith | 24 | 80.3 years |
| Lewis | 15 | 80.4 years |
| Jones | 12 | 76.0 years |
| Martin | 12 | 79.5 years |
| Moore | 11 | 81.7 years |
| Jackson | 10 | 70.0 years |
| Owen | 10 | 75.1 years |
| Roberts | 8 | 87.3 years |
| King | 7 | 77.8 years |
| Mccoy | 6 | 83.5 years |
| Businesses in Jack County, TX | ||||
| Name | Count | Name | Count | |
|---|---|---|---|---|
| Dairy Queen | 1 | RadioShack | 1 | |
| FedEx | 1 | SONIC Drive-In | 1 | |
| Ford | 1 | Subway | 1 | |
| H&R Block | 1 | True Value | 1 | |
Jack County on our top lists:
- #28 on the list of "Top 101 counties with highest percentage of residents voting for Romney (Republican) in the 2012 Presidential Election"