La Paz County, Arizona (AZ)
County owner-occupied free and clear houses and condos in 2010: 4,804
County owner-occupied houses and condos in 2000: 6,528
Renter-occupied apartments: 2,126 (it was 1,834 in 2000)
| % of renters here: | 22% |
| State: | 34% |
Land area: 4500 sq. mi.
Water area: 13.4 sq. mi.
Population density: 4 people per square mile (very low).
Industries providing employment: Arts, entertainment, recreation, accommodation and food services (18.3%), Educational, health and social services (15.3%), Retail trade (12.5%), Public administration (10.6%).
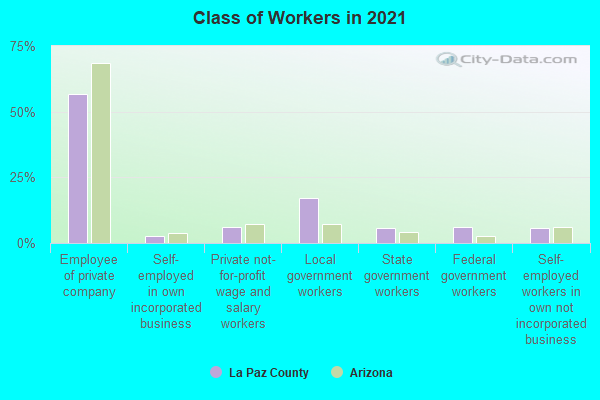
Type of workers:
- Private wage or salary: 66%
- Government: 28%
- Self-employed, not incorporated: 6%
- Unpaid family work: 0%
- OSM Map
- General Map
- Google Map
- MSN Map

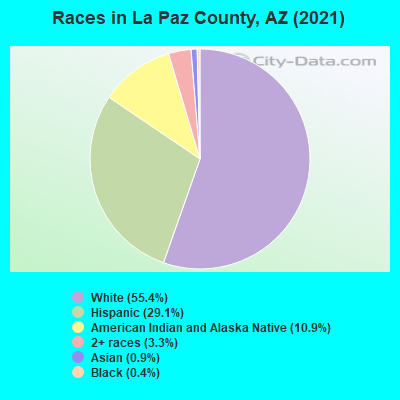
- 9,39155.5%White Non-Hispanic Alone
- 4,88528.9%Hispanic or Latino
- 1,96411.6%American Indian and Alaska Native alone
- 4322.6%Two or more races
- 1681.0%Asian alone
- 720.4%Black Non-Hispanic Alone
- 30.02%Native Hawaiian and Other
Pacific Islander alone
| Median resident age: | 57.9 years |
| Arizona median age: | 38.8 years |
| Males: 8,832 | |
| Females: 8,283 |

 | Building new Holbrook, AZ 3rd largest metropolitan big city after Phoenix and Tucson... (45 replies) |
| Whats wrong with buckeye Arizona? (91 replies) |
| Weekly newspaper La Paz County (2 replies) |
| Should Phoenix become its own city and county? (35 replies) |
| Saudis siphoning Arizona Water (30 replies) |
| Is Casa Grande considered Phoenix or Tucson? (26 replies) |
| La Paz County: | 2.0 people |
| Arizona: | 3 people |
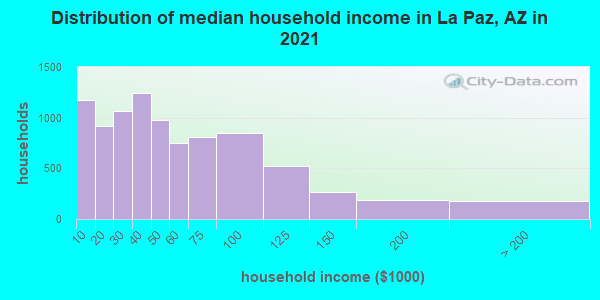
Estimated median household income in 2022: $47,910 ($25,839 in 1999)
| This county: | $47,910 |
| Arizona: | $74,568 |
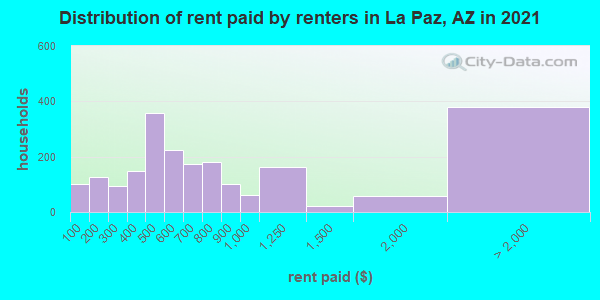
Median contract rent in 2022 for apartments: $619 (lower quartile is $423, upper quartile is $871)
| This county: | $619 |
| State: | $1291 |
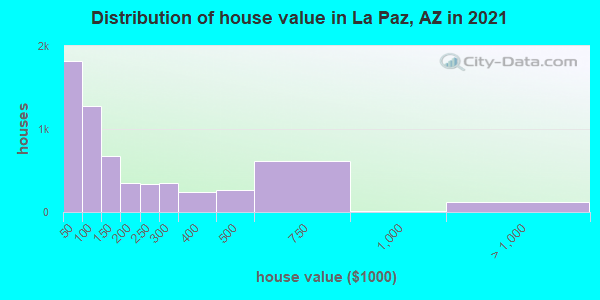
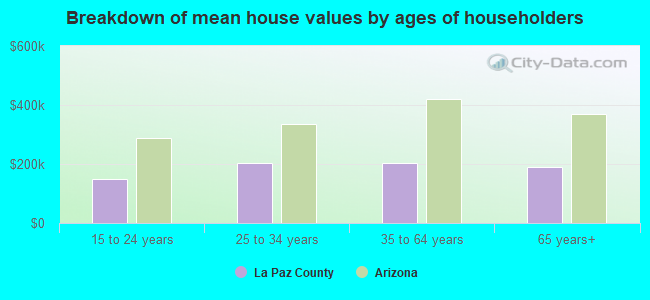
Estimated median house or condo value in 2022: $147,259 (it was $54,000 in 2000)
| La Paz: | $147,259 |
| Arizona: | $402,800 |
Median monthly housing costs for homes and condos with a mortgage: $1,079
Median monthly housing costs for units without a mortgage: $329
Institutionalized population: 238
Crime in 2021 (reported by the sheriff's office or county police, not the county total):
- Murders: 0
- Rapes: 7
- Robberies: 1
- Assaults: 24
- Burglaries: 88
- Thefts: 57
- Auto thefts: 34
Crime in 2020 (reported by the sheriff's office or county police, not the county total):
- Murders: 0
- Rapes: 3
- Robberies: 5
- Assaults: 53
- Burglaries: 112
- Thefts: 142
- Auto thefts: 61
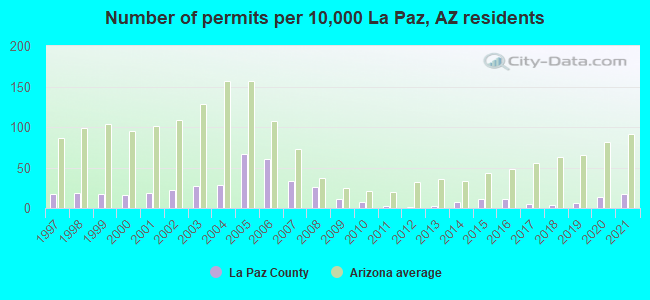
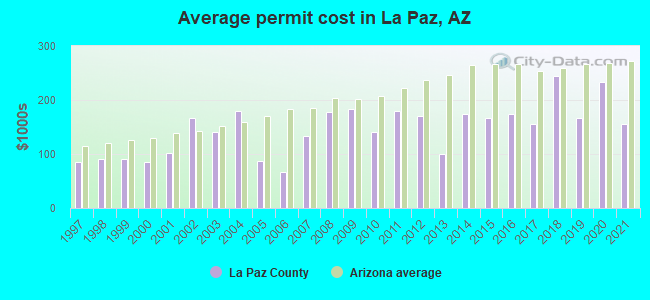
Single-family new house construction building permits:
- 2022: 34 buildings, average cost: $270,600
- 2021: 33 buildings, average cost: $155,100
- 2020: 25 buildings, average cost: $233,200
- 2019: 11 buildings, average cost: $167,100
- 2018: 8 buildings, average cost: $244,600
- 2017: 10 buildings, average cost: $155,900
- 2016: 22 buildings, average cost: $173,600
- 2015: 21 buildings, average cost: $166,900
- 2014: 16 buildings, average cost: $173,600
- 2013: 3 buildings, average cost: $100,300
- 2012: 2 buildings, average cost: $169,700
- 2011: 5 buildings, average cost: $180,000
- 2010: 16 buildings, average cost: $139,600
- 2009: 22 buildings, average cost: $183,700
- 2008: 51 buildings, average cost: $178,300
- 2007: 65 buildings, average cost: $134,400
- 2006: 118 buildings, average cost: $66,300
- 2005: 133 buildings, average cost: $87,100
- 2004: 56 buildings, average cost: $180,300
- 2003: 54 buildings, average cost: $139,600
- 2002: 44 buildings, average cost: $165,500
- 2001: 38 buildings, average cost: $100,900
- 2000: 32 buildings, average cost: $84,700
- 1999: 34 buildings, average cost: $90,300
- 1998: 35 buildings, average cost: $91,000
- 1997: 33 buildings, average cost: $84,700
Median real estate property taxes paid for housing units with mortgages in 2022: $965 (0.5%)
Median real estate property taxes paid for housing units with no mortgage in 2022: $626 (0.5%)
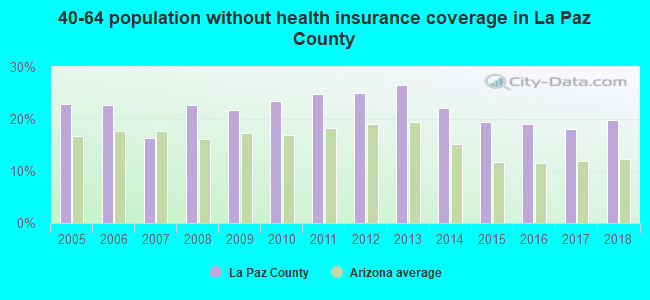
| La Paz County: | 20.0% |
| Arizona: | 12.5% |
Median age of residents in 2022: 57.9 years old
(Males: 57.7 years old, Females: 58.6 years old)
(Median age for: White residents: 70.4 years old, Black residents: 42.4 years old, American Indian residents: 33.4 years old, Asian residents: 44.4 years old, Hispanic or Latino residents: 35.8 years old, Other race residents: 38.4 years old)
Fair market rent in 2006 for a 1-bedroom apartment in La Paz County is $477 a month.
Fair market rent for a 2-bedroom apartment is $572 a month.
Fair market rent for a 3-bedroom apartment is $809 a month.
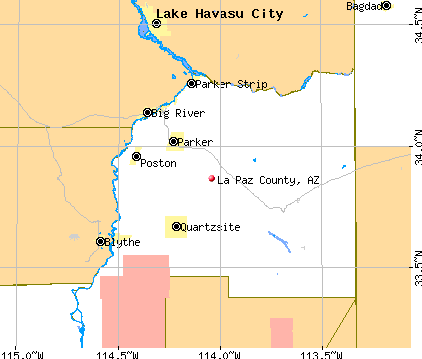
Cities in this county include: Quartzsite, Parker Strip, Parker, Cienega Springs, Salome, Ehrenberg, Bluewater, La Paz Valley, Brenda, Bouse.
2023 air pollution in La Paz County:
Ozone (1-hour): 0.042 ppm (standard limit: 0.12 ppm). Above U.S. average.
Particulate Matter (PM10) Annual: 14.9 µg/m3. Near U.S. average.
Particulate Matter (PM2.5) Annual: 2.5 µg/m3(standard limit: 15.0 µg/m3). Significantly below U.S. average.
Neighboring counties: Archer County, Texas  , Bailey County, Texas , Baylor County, Texas , Briscoe County, Texas , Prentiss County, Mississippi , Knox County, Texas , Motley County, Texas .
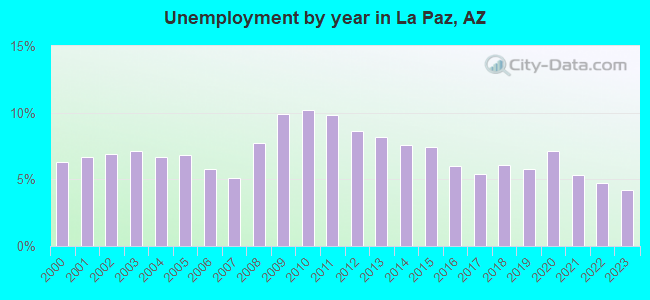
| Here: | 4.3% |
| Arizona: | 3.8% |
Current college students: 437
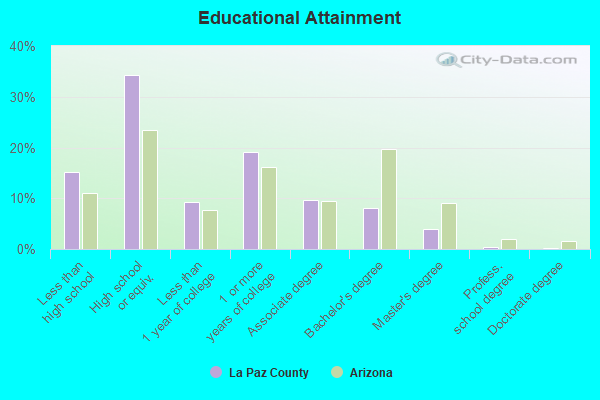
People 25 years of age or older with a high school degree or higher: 82.6%
People 25 years of age or older with a bachelor's degree or higher: 12.4%
Number of foreign born residents: 2,064 (35.1% naturalized citizens)
| La Paz County: | 12.1% |
| Whole state: | 13.1% |
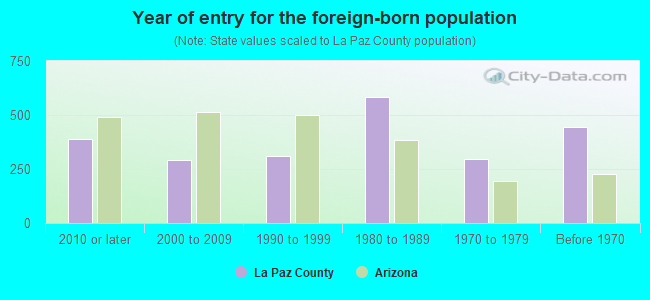
- Year of entry for the foreign-born population
- 7172010 or later
- 2752000 to 2009
- 3021990 to 1999
- 5831980 to 1989
- 2961970 to 1979
- 444Before 1970
Mean travel time to work (commute): minutes
Percentage of county residents living and working in this county: 91.5%
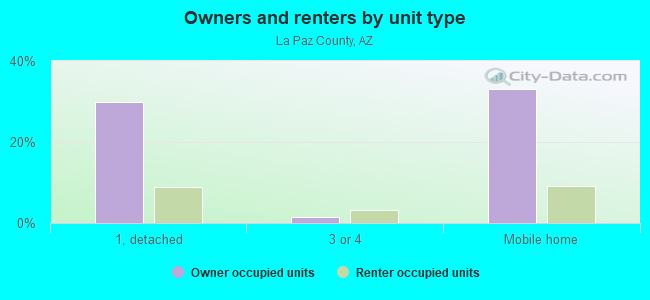
Housing units in structures:
- One, detached: 4,875
- One, attached: 118
- Two: 202
- 3 or 4: 307
- 5 to 9: 76
- 10 to 19: 46
- 20 or more: 24
- Mobile homes: 7,186
- Boats, RVs, vans, etc.: 719
Housing units in La Paz County with a mortgage: 1,965 (59 second mortgage, 0 home equity loan, 59 both second mortgage and home equity loan)
Houses without a mortgage: 0
| Here: | 100.0% with mortgage |
| State: | 98.6% with mortgage |
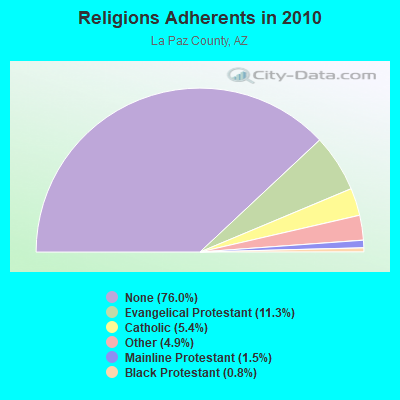
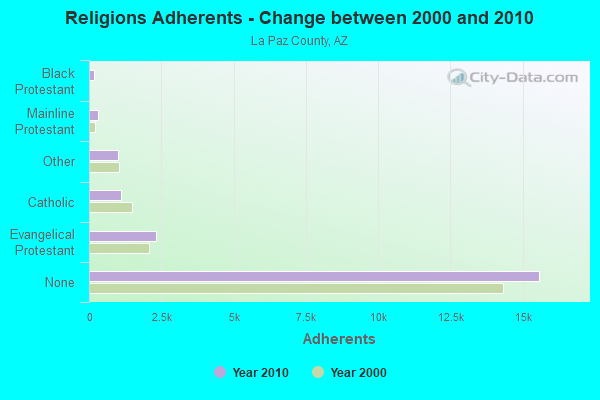
Religion statistics for La Paz County
| Religion | Adherents | Congregations |
|---|---|---|
| Evangelical Protestant | 2,314 | 27 |
| Catholic | 1,109 | 4 |
| Other | 1,010 | 4 |
| Mainline Protestant | 302 | 3 |
| Black Protestant | 174 | 1 |
| None | 15,580 | - |
Source: Clifford Grammich, Kirk Hadaway, Richard Houseal, Dale E.Jones, Alexei Krindatch, Richie Stanley and Richard H.Taylor. 2012. 2010 U.S.Religion Census: Religious Congregations & Membership Study. Association of Statisticians of American Religious Bodies. Jones, Dale E., et al. 2002. Congregations and Membership in the United States 2000. Nashville, TN: Glenmary Research Center.
Food Environment Statistics:
| La Paz County: | 3.98 / 10,000 pop. |
| State: | 1.36 / 10,000 pop. |
| This county: | 0.50 / 10,000 pop. |
| Arizona: | 0.55 / 10,000 pop. |
| La Paz County: | 8.96 / 10,000 pop. |
| Arizona: | 2.47 / 10,000 pop. |
| This county: | 11.95 / 10,000 pop. |
| State: | 6.21 / 10,000 pop. |
| La Paz County: | 11.2% |
| Arizona: | 8.0% |
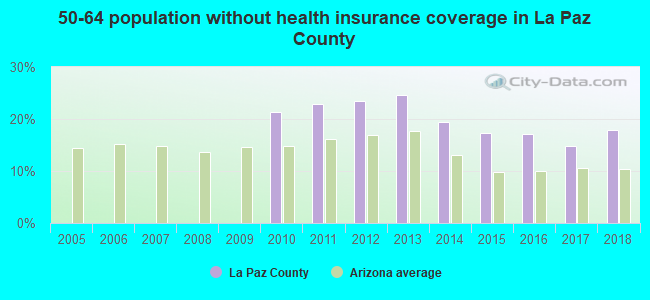
| La Paz County: | 28.0% |
| State: | 22.8% |
Agriculture in La Paz County:
Average value of agricultural products sold per farm: $857,656Average value of crops sold per acre for harvested cropland: $947.53
The value of livestock, poultry, and their products as a percentage of the total market value of agricultural products sold: 0.73%
Average total farm production expenses per farm: $666,679
Irrigated harvested cropland as a percentage of land in farms: 100.00%
Average market value of all machinery and equipment per farm: $337,206
The percentage of farms operated by a family or individual: 57.43%
Average age of principal farm operators: 54 years
All wheat for grain: 5309 harvested acres
Upland cotton: 14613 harvested acres
Vegetables: 5,539 harvested acres
Earthquake activity:
La Paz County-area historical earthquake activity is significantly above Arizona state average. It is 4346% greater than the overall U.S. average.On 6/28/1992 at 11:57:34, a magnitude 7.6 (6.2 MB, 7.6 MS, 7.3 MW, Depth: 0.7 mi, Class: Major, Intensity: VIII - XII) earthquake occurred 144.3 miles away from La Paz County center, causing 3 deaths (1 shaking deaths, 2 other deaths) and 400 injuries, causing $100,000,000 total damage and $40,000,000 insured losses
On 10/16/1999 at 09:46:44, a magnitude 7.4 (6.3 MB, 7.4 MS, 7.2 MW, 7.3 ML) earthquake occurred 144.0 miles away from the county center
On 5/19/1940 at 04:36:40, a magnitude 7.2 (7.2 UK) earthquake occurred 105.1 miles away from the county center, causing $33,000,000 total damage
On 12/31/1934 at 18:45:56, a magnitude 7.1 (7.1 UK) earthquake occurred 128.4 miles away from the county center
On 10/15/1979 at 23:16:54, a magnitude 7.0 (5.7 MB, 6.9 MS, 7.0 ML, 6.4 MW) earthquake occurred 117.2 miles away from La Paz County center
On 7/21/1952 at 11:52:14, a magnitude 7.7 (7.7 UK) earthquake occurred 293.4 miles away from the county center, causing $50,000,000 total damage
Magnitude types: body-wave magnitude (MB), local magnitude (ML), surface-wave magnitude (MS), moment magnitude (MW)
Most recent natural disasters:
- Arizona Covid-19 Pandemic, Incident Period: January 20, 2020, FEMA Id: 4524, Natural disaster type: Other
- Arizona Severe Storms and Flooding, Incident Period: September 07, 2014 to September 09, 2014, Major Disaster (Presidential) Declared DR-4203: November 05, 2014, FEMA Id: 4203, Natural disaster type: Storm, Flood
- Arizona Severe Winter Storms and Flooding, Incident Period: January 18, 2010 to January 22, 2010, Major Disaster (Presidential) Declared DR-1888: March 18, 2010, FEMA Id: 1888, Natural disaster type: Winter Storm, Flood
- Arizona Hurricane Katrina Evacuation, Incident Period: August 29, 2005 to October 01, 2005, Emergency Declared EM-3241: September 12, 2005, FEMA Id: 3241, Natural disaster type: Hurricane
- Arizona Severe Storms And Flooding, Incident Period: October 21, 2000 to November 08, 2000, Major Disaster (Presidential) Declared DR-1347: October 27, 2000, FEMA Id: 1347, Natural disaster type: Storm, Flood
- Arizona FLOODING, Incident Period: June 16, 1983 to June 20, 1983, Major Disaster (Presidential) Declared DR-686: July 01, 1983, FEMA Id: 686, Natural disaster type: Flood
The number of natural disasters in La Paz County (6) is a lot smaller than the US average (15).
Major Disasters (Presidential) Declared: 4
Emergencies Declared: 1
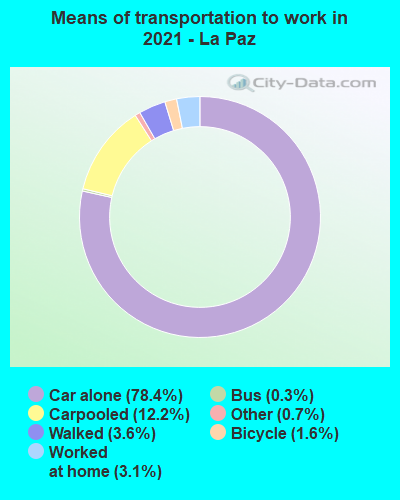
Means of transportation to work:
- Drove a car alone: 4,788 (70.0%)
- Carpooled: 944 (13.8%)
- Taxicab, motorcycle, or other means: 50 (0.7%)
- Bicycle: 48 (0.7%)
- Walked: 281 (4.1%)
- Worked at home: 525 (7.7%)

- Accommodation and food services (14%)
- Health care and social assistance (10%)
- Retail trade (10%)
- Public administration (9%)
- Educational services (7%)
- Arts, entertainment, and recreation (6%)
- Transportation and warehousing (6%)
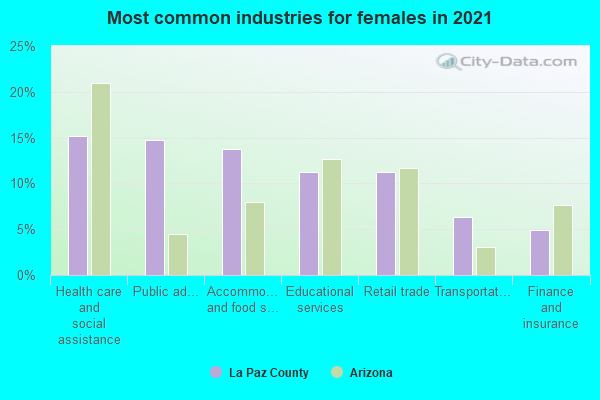
- Accommodation and food services (18%)
- Health care and social assistance (13%)
- Retail trade (12%)
- Public administration (11%)
- Educational services (9%)
- Arts, entertainment, and recreation (8%)
- Transportation and warehousing (7%)
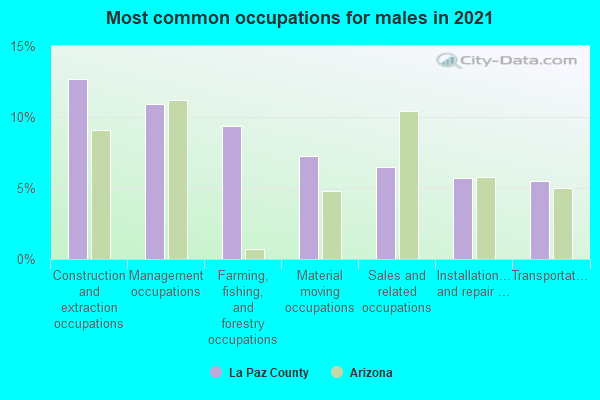
- Management occupations (14%)
- Construction and extraction occupations (13%)
- Farming, fishing, and forestry occupations (9%)
- Building and grounds cleaning and maintenance occupations (8%)
- Material moving occupations (7%)
- Transportation occupations (6%)
- Sales and related occupations (6%)
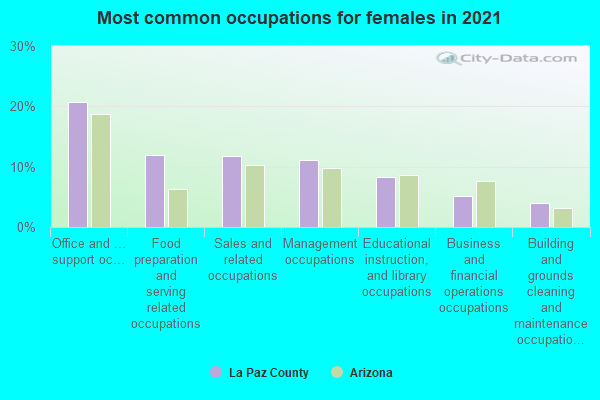
- Management occupations (20%)
- Office and administrative support occupations (17%)
- Food preparation and serving related occupations (12%)
- Sales and related occupations (12%)
- Educational instruction, and library occupations (6%)
- Business and financial operations occupations (4%)
- Material moving occupations (4%)
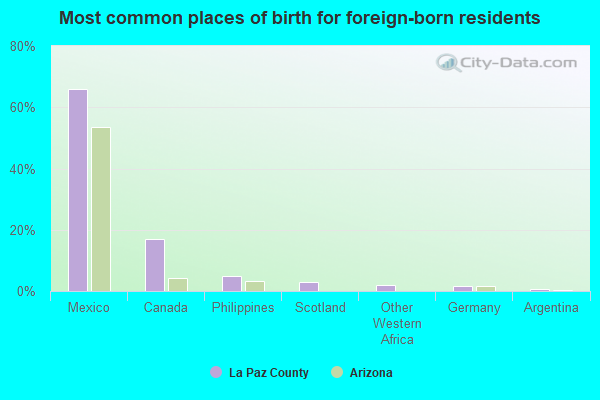
- Mexico (65%)
- Canada (13%)
- Philippines (5%)
- India (3%)
- Scotland (2%)
- Italy (2%)
- Germany (2%)
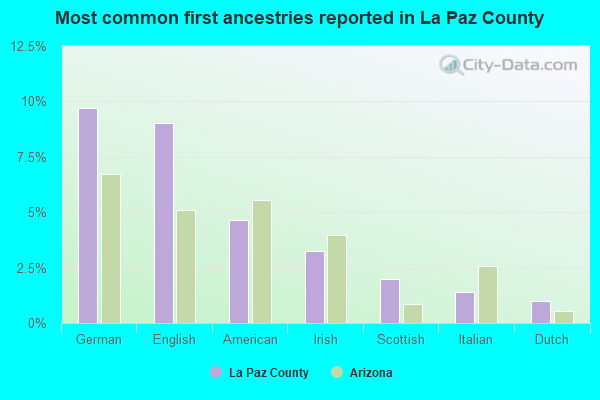
- German (7%)
- English (7%)
- American (7%)
- Irish (3%)
- Italian (2%)
- Scottish (2%)
- Polish (1%)
People in group quarters in La Paz County, Arizona in 2010:
- 232 people in local jails and other municipal confinement facilities
- 115 people in other noninstitutional facilities
- 30 people in workers' group living quarters and job corps centers
- 6 people in nursing facilities/skilled-nursing facilities
- 3 people in emergency and transitional shelters (with sleeping facilities) for people experiencing homelessness
- 2 people in group homes intended for adults
25 people in homes for the physically handicapped
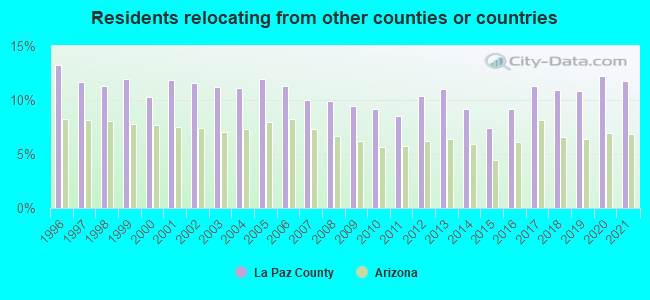
11.73% of this county's 2021 resident taxpayers lived in other counties in 2020 ($53,367 average adjusted gross income)
| Here: | 11.73% |
| Arizona average: | 6.85% |
10 or fewer of this county's residents moved from foreign countries.
3.26% relocated from other counties in Arizona ($13,160 average AGI)
8.46% relocated from other states ($40,208 average AGI)
La Paz County: 8.46% Arizona average: 4.90%
Top counties from which taxpayers relocated into this county between 2020 and 2021:
| from Maricopa County, AZ | |
| from Riverside County, CA | |
| from San Bernardino County, CA | |
| from Mohave County, AZ | |
| from Los Angeles County, CA | |
| from Yuma County, AZ |
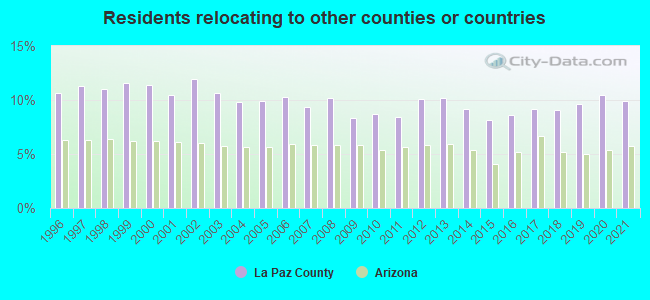
9.95% of this county's 2020 resident taxpayers moved to other counties in 2021 ($48,556 average adjusted gross income)
| Here: | 9.95% |
| Arizona average: | 5.72% |
10 or fewer of this county's residents moved to foreign countries.
4.10% relocated to other counties in Arizona ($23,489 average AGI)
5.85% relocated to other states ($25,067 average AGI)
La Paz County: 5.85% Arizona average: 3.76%
Top counties to which taxpayers relocated from this county between 2020 and 2021:
| to Maricopa County, AZ | |
| to Mohave County, AZ | |
| to Riverside County, CA | |
| to Yuma County, AZ | |
| to San Bernardino County, CA | |
| to Yavapai County, AZ |
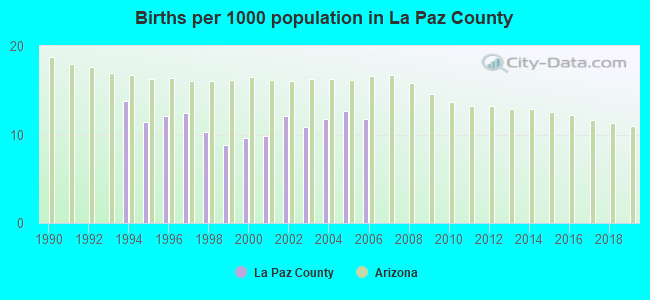
Births per 1000 population from 1990 to 1999: 6.9
Births per 1000 population from 2000 to 2006: 11.2
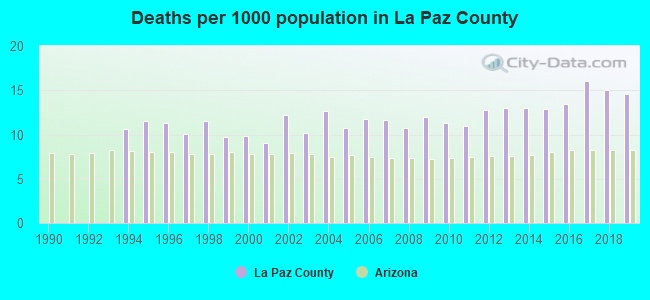
Deaths per 1000 population from 1990 to 1999: 6.5
Deaths per 1000 population from 2000 to 2009: 11.1
Deaths per 1000 population from 2010 to 2020: 13.6
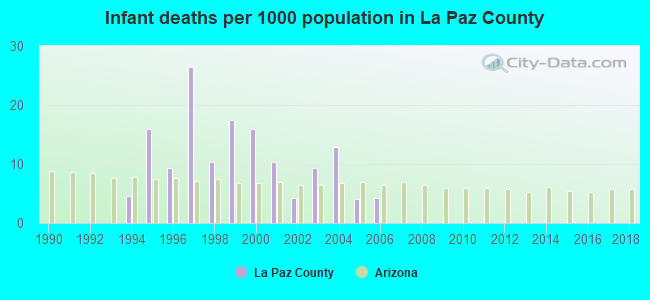
Infant deaths per 1000 live births from 1990 to 1999: 8.4
Infant deaths per 1000 live births from 2000 to 2006: 8.7
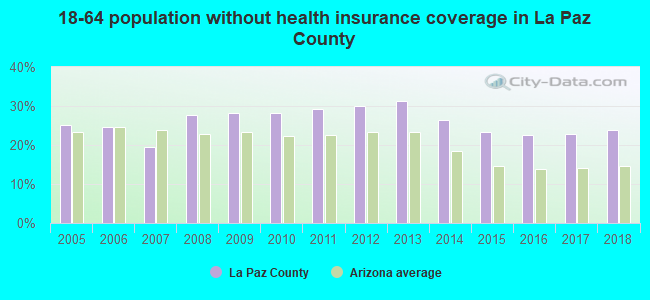
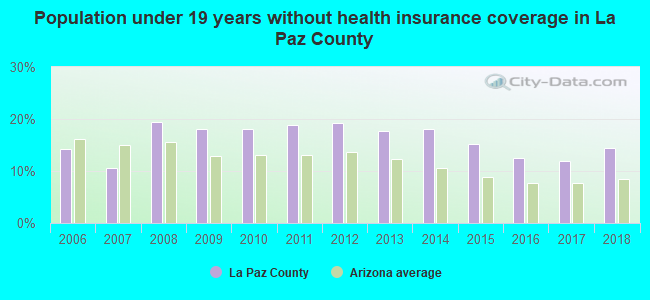
Persons under 19 years old without health insurance coverage in 2018: 14.4%
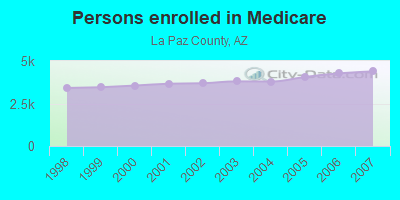
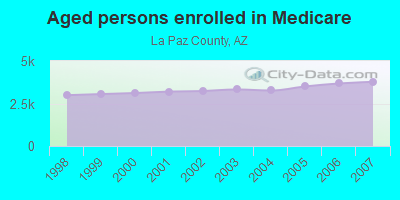
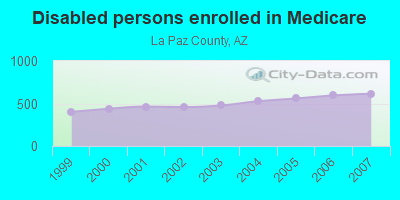
Persons enrolled in hospital insurance and/or supplemental medical insurance (Medicare) in July 1, 2007: 4,390 (3,775 aged, 615 disabled)
Children under 18 without health insurance coverage in 2007: 752 (20%)
Most common underlying causes of death in La Paz County, Arizona in 1999 - 2019:
- Atherosclerotic heart disease (703)
- Bronchus or lung, unspecified - Malignant neoplasms (344)
- Chronic obstructive pulmonary disease, unspecified (232)
- Acute myocardial infarction, unspecified (97)
- Cardiac arrest, unspecified (59)
- Atherosclerotic cardiovascular disease, so described (49)
- Other forms of acute ischaemic heart disease (32)
- Alzheimer disease, unspecified (11)
- Person injured in unspecified motor-vehicle accident, traffic (10)
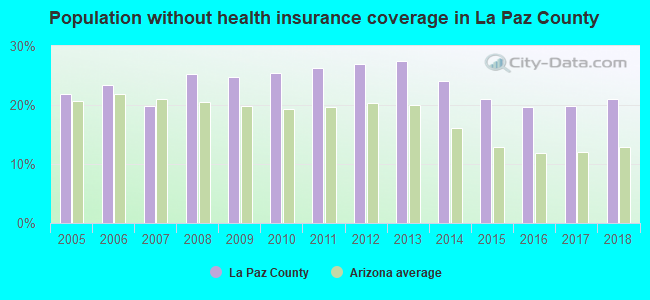
Population without health insurance coverage in 2000: 25%
Children under 18 without health insurance coverage in 2000: 23%
Suicides per 1,000,000 population from 2000 to 2006: 224.7. This is less than state average.
Household type by relationship:
Households: 17,115- Male householders: 4,941 (1,844 living alone), Female householders: 4,326 (1,332 living alone)
3,918 spouses (3,918 opposite-sex spouses), 698 unmarried partners, (698 opposite-sex unmarried partners), 2,195 children (2,006 natural, 70 adopted, 118 stepchildren), 390 grandchildren, 51 brothers or sisters, 47 parents, 44 foster children, 117 other relatives, 283 non-relatives
- In group quarters: 184
Size of family households: 3,366 2-persons, 762 3-persons, 589 4-persons, 286 5-persons, 292 6-persons, 225 7-or-more-persons.
Size of nonfamily households: 3,183 1-person, 544 2-persons, 27 3-persons.
1,023 married couples with children.
950 single-parent households (384 men, 566 women).
79.1% of residents of La Paz speak English at home.
17.4% of residents speak Spanish at home (57% speak English very well, 16% speak English well, 10% speak English not well, 17% don't speak English at all).
2.0% of residents speak other Indo-European language at home (68% speak English very well, 2% speak English well, 30% speak English not well).
0.8% of residents speak Asian or Pacific Island language at home (51% speak English very well, 39% speak English well, 10% speak English not well).
1.7% of residents speak other language at home (100% speak English very well).
In fiscal year 2004:
Federal Government expenditure: $185,796,000 ($9,337 per capita)
Department of Defense expenditure: $76,641,000
Federal direct payments to individuals for retirement and disability: $58,508,000
Federal other direct payments to individuals: $4,256,000
Federal direct payments not to individuals: $6,666,000
Federal grants: $30,150,000
Federal procurement contracts: $75,701,000 ($73,820,000 Department of Defense)
Federal salaries and wages: $10,516,000 ($0,000 Department of Defense)
Federal Government direct loans: $1,233,000
Federal guaranteed/insured loans: $2,301,000
Federal Government insurance: $40,410,000
Population change from April 1, 2000 to July 1, 2005:
Births: 1,103| Here: | 55 per 1000 residents |
| State: | 78 per 1000 residents |
Deaths: 1,103
| Here: | 55 per 1000 residents |
| State: | 37 per 1000 residents |
Net international migration: +309
| Here: | +15 per 1000 residents |
| State: | +28 per 1000 residents |
Net internal migration: +249
| Here: | +12 per 1000 residents |
| State: | +69 per 1000 residents |
Total withdrawal of fresh water for public supply: 3.28 millions of gallons per day (all from ground)
| Here: | 4.5 |
| State: | 6.0 |
| Here: | 3.9 |
| State: | 4.1 |
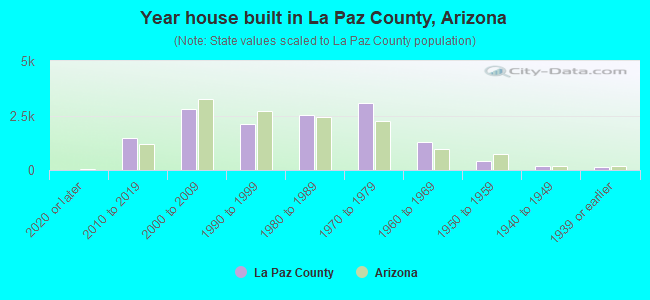
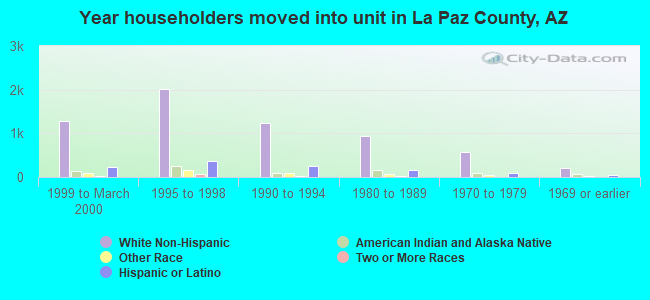
- Year house built in La Paz County, Arizona
- 182020 or later
- 1,7482010 to 2019
- 2,2362000 to 2009
- 2,0821990 to 1999
- 2,6271980 to 1989
- 2,9971970 to 1979
- 1,2991960 to 1969
- 4871950 to 1959
- 1781940 to 1949
- 821939 or earlier
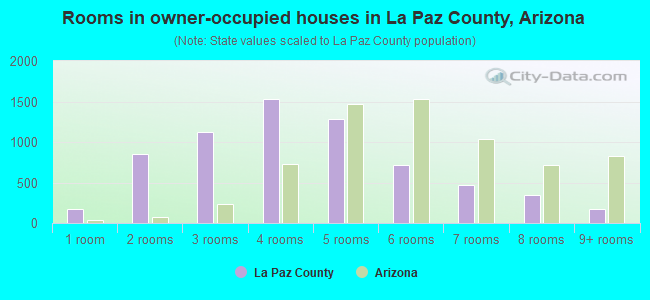
- Rooms in owner-occupied houses in La Paz County, Arizona
- 2021 room
- 7892 rooms
- 1,0083 rooms
- 1,3584 rooms
- 1,4545 rooms
- 7466 rooms
- 4527 rooms
- 3838 rooms
- 1129+ rooms
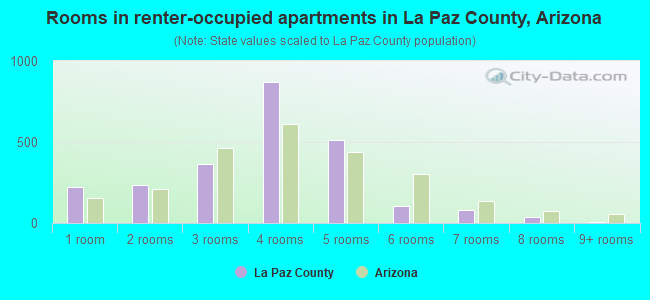
- Rooms in renter-occupied apartments in La Paz County, Arizona
- 2281 room
- 2932 rooms
- 3943 rooms
- 1,0114 rooms
- 6465 rooms
- 1026 rooms
- 1157 rooms
- 478 rooms
- 59+ rooms
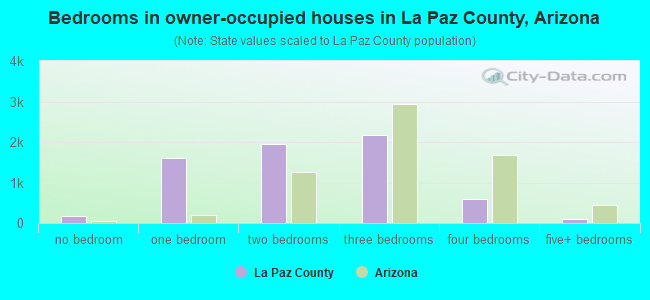
- Bedrooms in owner-occupied houses in La Paz County, Arizona
- 212no bedroom
- 1,8181 bedroom
- 1,6522 bedrooms
- 2,2603 bedrooms
- 4464 bedrooms
- 885+ bedrooms
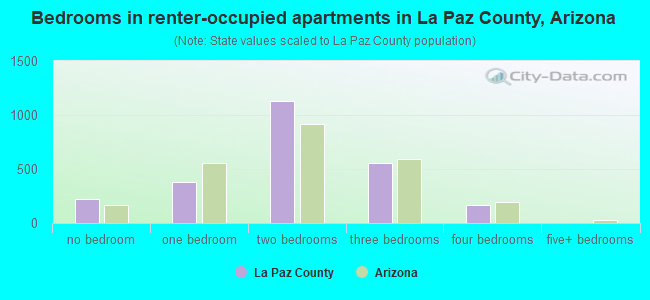
- Bedrooms in renter-occupied apartments in La Paz County, Arizona
- 227no bedroom
- 3981 bedroom
- 1,1982 bedrooms
- 6523 bedrooms
- 3564 bedrooms
- 05+ bedrooms
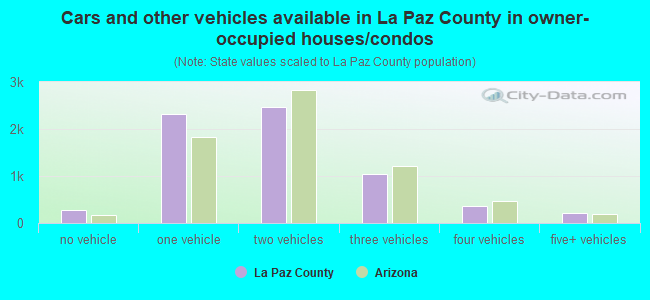
- Cars and other vehicles available in La Paz County in owner-occupied houses/condos
- 314no vehicle
- 2,2541 vehicle
- 2,2482 vehicles
- 1,0303 vehicles
- 3524 vehicles
- 2645+ vehicles
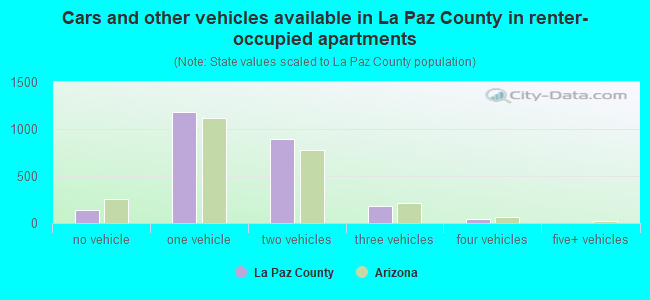
- Cars and other vehicles available in La Paz County in renter-occupied apartments
- 120no vehicle
- 1,3331 vehicle
- 1,1522 vehicles
- 1933 vehicles
- 404 vehicles
- 05+ vehicles
90.2% of La Paz County residents lived in the same house 1 years ago.
Out of people who lived in different houses, 28% lived in this county.
Out of people who lived in different counties, 26% lived in Arizona.
| La Paz County: | 90.2% |
| State average: | 86.0% |
Place of birth for U.S.-born residents:
- This state: 5,111
- Other state: 9,763
- Northeast: 739
- Midwest: 1,948
- South: 852
- West: 6,373
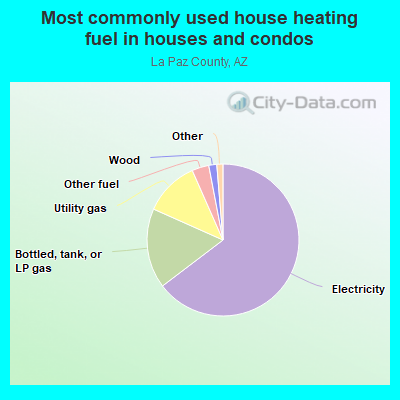
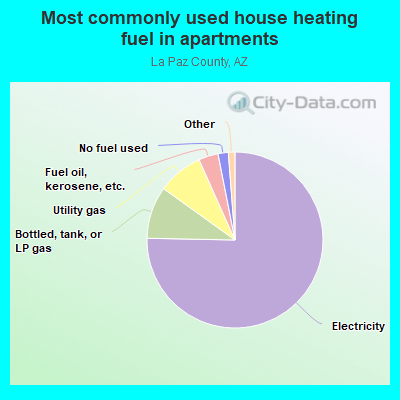
- 69.5%Electricity
- 13.0%Bottled, tank, or LP gas
- 10.3%Utility gas
- 4.0%Other fuel
- 1.7%Wood
- 1.0%Fuel oil, kerosene, etc.
- 0.2%No fuel used
- 0.2%Solar energy
- 74.2%Electricity
- 11.7%Bottled, tank, or LP gas
- 8.5%Utility gas
- 2.4%Fuel oil, kerosene, etc.
- 2.1%No fuel used
- 1.1%Other fuel
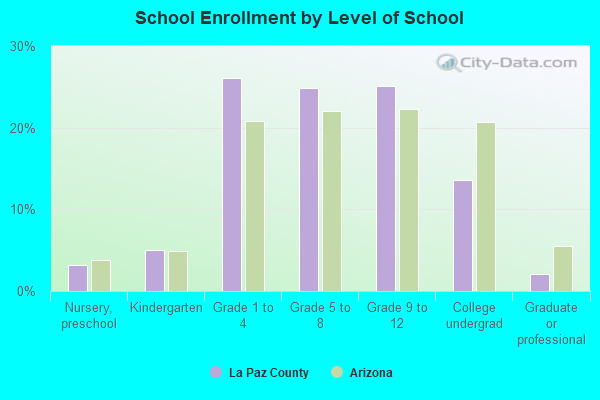
Private vs. public school enrollment:
| Here: | 11.4% |
| Arizona: | 10.4% |
| Here: | 5.9% |
| Arizona: | 8.8% |
| Here: | 9.4% |
| Arizona: | 13.1% |
La Paz County government finances - Expenditure in 2018:
- Charges - Other: $3,362,000
Parks and Recreation: $2,594,000
Parks and Recreation: $2,583,000
Other: $2,259,000
Solid Waste Management: $446,000
Solid Waste Management: $400,000
- Construction - General - Other: $55,000
- Current Operations - Police Protection: $6,271,000
Police Protection: $6,160,000
Judicial and Legal Services: $4,090,000
General - Other: $3,459,000
Regular Highways: $3,446,000
Correctional Institutions: $3,281,000
Regular Highways: $3,280,000
Correctional Institutions: $2,989,000
General - Other: $2,961,000
Judicial and Legal Services: $2,662,000
Parks and Recreation: $2,397,000
Parks and Recreation: $2,117,000
Health - Other: $1,987,000
Health - Other: $1,886,000
Central Staff Services: $1,755,000
Central Staff Services: $1,516,000
Financial Administration: $1,248,000
Financial Administration: $1,226,000
Public Welfare - Other: $808,000
Public Welfare - Other: $707,000
Solid Waste Management: $403,000
General Public Buildings: $371,000
General Public Buildings: $338,000
Elementary and Secondary Education: $249,000
Corrections - Other: $219,000
Corrections - Other: $219,000
Solid Waste Management: $185,000
Libraries: $83,000
- General - Interest on Debt: $677,000
Interest on Debt: $265,000
- Long Term Debt - Beginning Outstanding - Unspecified Public Purpose: $15,364,000
Retired Unspecified Public Purpose: $15,364,000
Outstanding Unspecified Public Purpose: $10,596,000
Retired Unspecified Public Purpose: $1,939,000
Beginning Outstanding - Unspecified Public Purpose: $0
- Miscellaneous - Fines and Forfeits: $1,530,000
General Revenue - Other: $566,000
General Revenue - Other: $418,000
Sale of Property: $224,000
Interest Earnings: $111,000
Interest Earnings: $18,000
- Other Capital Outlay - General - Other: $501,000
Regular Highways: $386,000
Correctional Institutions: $107,000
Correctional Institutions: $19,000
Parks and Recreation: $11,000
- Other Funds - Cash and Securities: $6,703,000
Cash and Securities: $1,805,000
- Sinking Funds - Cash and Securities: $3,845,000
Cash and Securities: $2,782,000
- State Intergovernmental - General Local Government Support: $9,803,000
General Local Government Support: $5,655,000
Highways: $4,826,000
Highways: $4,756,000
Other: $3,519,000
Other: $3,446,000
- Tax - Property: $6,004,000
General Sales and Gross Receipts: $5,778,000
Property: $5,676,000
General Sales and Gross Receipts: $5,538,000
Other License: $332,000
Other License: $319,000
La Paz County government finances - Revenue in 2018:
- Charges - Other: $3,362,000
Parks and Recreation: $2,594,000
Parks and Recreation: $2,583,000
Other: $2,259,000
Solid Waste Management: $446,000
Solid Waste Management: $400,000
- Construction - General - Other: $55,000
- Current Operations - Police Protection: $6,271,000
Police Protection: $6,160,000
Judicial and Legal Services: $4,090,000
General - Other: $3,459,000
Regular Highways: $3,446,000
Correctional Institutions: $3,281,000
Regular Highways: $3,280,000
Correctional Institutions: $2,989,000
General - Other: $2,961,000
Judicial and Legal Services: $2,662,000
Parks and Recreation: $2,397,000
Parks and Recreation: $2,117,000
Health - Other: $1,987,000
Health - Other: $1,886,000
Central Staff Services: $1,755,000
Central Staff Services: $1,516,000
Financial Administration: $1,248,000
Financial Administration: $1,226,000
Public Welfare - Other: $808,000
Public Welfare - Other: $707,000
Solid Waste Management: $403,000
General Public Buildings: $371,000
General Public Buildings: $338,000
Elementary and Secondary Education: $249,000
Corrections - Other: $219,000
Corrections - Other: $219,000
Solid Waste Management: $185,000
Libraries: $83,000
- General - Interest on Debt: $677,000
Interest on Debt: $265,000
- Long Term Debt - Beginning Outstanding - Unspecified Public Purpose: $15,364,000
Retired Unspecified Public Purpose: $15,364,000
Outstanding Unspecified Public Purpose: $10,596,000
Retired Unspecified Public Purpose: $1,939,000
Beginning Outstanding - Unspecified Public Purpose: $0
- Miscellaneous - Fines and Forfeits: $1,530,000
General Revenue - Other: $566,000
General Revenue - Other: $418,000
Sale of Property: $224,000
Interest Earnings: $111,000
Interest Earnings: $18,000
- Other Capital Outlay - General - Other: $501,000
Regular Highways: $386,000
Correctional Institutions: $107,000
Correctional Institutions: $19,000
Parks and Recreation: $11,000
- Other Funds - Cash and Securities: $6,703,000
Cash and Securities: $1,805,000
- Sinking Funds - Cash and Securities: $3,845,000
Cash and Securities: $2,782,000
- State Intergovernmental - General Local Government Support: $9,803,000
General Local Government Support: $5,655,000
Highways: $4,826,000
Highways: $4,756,000
Other: $3,519,000
Other: $3,446,000
- Tax - Property: $6,004,000
General Sales and Gross Receipts: $5,778,000
Property: $5,676,000
General Sales and Gross Receipts: $5,538,000
Other License: $332,000
Other License: $319,000
La Paz County government finances - Debt in 2018:
- Charges - Other: $3,362,000
Parks and Recreation: $2,594,000
Parks and Recreation: $2,583,000
Other: $2,259,000
Solid Waste Management: $446,000
Solid Waste Management: $400,000
- Construction - General - Other: $55,000
- Current Operations - Police Protection: $6,271,000
Police Protection: $6,160,000
Judicial and Legal Services: $4,090,000
General - Other: $3,459,000
Regular Highways: $3,446,000
Correctional Institutions: $3,281,000
Regular Highways: $3,280,000
Correctional Institutions: $2,989,000
General - Other: $2,961,000
Judicial and Legal Services: $2,662,000
Parks and Recreation: $2,397,000
Parks and Recreation: $2,117,000
Health - Other: $1,987,000
Health - Other: $1,886,000
Central Staff Services: $1,755,000
Central Staff Services: $1,516,000
Financial Administration: $1,248,000
Financial Administration: $1,226,000
Public Welfare - Other: $808,000
Public Welfare - Other: $707,000
Solid Waste Management: $403,000
General Public Buildings: $371,000
General Public Buildings: $338,000
Elementary and Secondary Education: $249,000
Corrections - Other: $219,000
Corrections - Other: $219,000
Solid Waste Management: $185,000
Libraries: $83,000
- General - Interest on Debt: $677,000
Interest on Debt: $265,000
- Long Term Debt - Beginning Outstanding - Unspecified Public Purpose: $15,364,000
Retired Unspecified Public Purpose: $15,364,000
Outstanding Unspecified Public Purpose: $10,596,000
Retired Unspecified Public Purpose: $1,939,000
Beginning Outstanding - Unspecified Public Purpose: $0
- Miscellaneous - Fines and Forfeits: $1,530,000
General Revenue - Other: $566,000
General Revenue - Other: $418,000
Sale of Property: $224,000
Interest Earnings: $111,000
Interest Earnings: $18,000
- Other Capital Outlay - General - Other: $501,000
Regular Highways: $386,000
Correctional Institutions: $107,000
Correctional Institutions: $19,000
Parks and Recreation: $11,000
- Other Funds - Cash and Securities: $6,703,000
Cash and Securities: $1,805,000
- Sinking Funds - Cash and Securities: $3,845,000
Cash and Securities: $2,782,000
- State Intergovernmental - General Local Government Support: $9,803,000
General Local Government Support: $5,655,000
Highways: $4,826,000
Highways: $4,756,000
Other: $3,519,000
Other: $3,446,000
- Tax - Property: $6,004,000
General Sales and Gross Receipts: $5,778,000
Property: $5,676,000
General Sales and Gross Receipts: $5,538,000
Other License: $332,000
Other License: $319,000
La Paz County government finances - Cash and Securities in 2018:
- Charges - Other: $3,362,000
Parks and Recreation: $2,594,000
Parks and Recreation: $2,583,000
Other: $2,259,000
Solid Waste Management: $446,000
Solid Waste Management: $400,000
- Construction - General - Other: $55,000
- Current Operations - Police Protection: $6,271,000
Police Protection: $6,160,000
Judicial and Legal Services: $4,090,000
General - Other: $3,459,000
Regular Highways: $3,446,000
Correctional Institutions: $3,281,000
Regular Highways: $3,280,000
Correctional Institutions: $2,989,000
General - Other: $2,961,000
Judicial and Legal Services: $2,662,000
Parks and Recreation: $2,397,000
Parks and Recreation: $2,117,000
Health - Other: $1,987,000
Health - Other: $1,886,000
Central Staff Services: $1,755,000
Central Staff Services: $1,516,000
Financial Administration: $1,248,000
Financial Administration: $1,226,000
Public Welfare - Other: $808,000
Public Welfare - Other: $707,000
Solid Waste Management: $403,000
General Public Buildings: $371,000
General Public Buildings: $338,000
Elementary and Secondary Education: $249,000
Corrections - Other: $219,000
Corrections - Other: $219,000
Solid Waste Management: $185,000
Libraries: $83,000
- General - Interest on Debt: $677,000
Interest on Debt: $265,000
- Long Term Debt - Beginning Outstanding - Unspecified Public Purpose: $15,364,000
Retired Unspecified Public Purpose: $15,364,000
Outstanding Unspecified Public Purpose: $10,596,000
Retired Unspecified Public Purpose: $1,939,000
Beginning Outstanding - Unspecified Public Purpose: $0
- Miscellaneous - Fines and Forfeits: $1,530,000
General Revenue - Other: $566,000
General Revenue - Other: $418,000
Sale of Property: $224,000
Interest Earnings: $111,000
Interest Earnings: $18,000
- Other Capital Outlay - General - Other: $501,000
Regular Highways: $386,000
Correctional Institutions: $107,000
Correctional Institutions: $19,000
Parks and Recreation: $11,000
- Other Funds - Cash and Securities: $6,703,000
Cash and Securities: $1,805,000
- Sinking Funds - Cash and Securities: $3,845,000
Cash and Securities: $2,782,000
- State Intergovernmental - General Local Government Support: $9,803,000
General Local Government Support: $5,655,000
Highways: $4,826,000
Highways: $4,756,000
Other: $3,519,000
Other: $3,446,000
- Tax - Property: $6,004,000
General Sales and Gross Receipts: $5,778,000
Property: $5,676,000
General Sales and Gross Receipts: $5,538,000
Other License: $332,000
Other License: $319,000
Supplemental Security Income (SSI) in 2006:
- Total number of recipients: 463
- Number of aged recipients: 55
- Number of blind and disabled recipients: 408
- Number of recipients under 18: 47
- Number of recipients between 18 and 64: 309
- Number of recipients older than 64: 107
- Number of recipients also receiving OASDI: 179
- Amount of payments (thousands of dollars): 200
| Most common first names in La Paz County, AZ among deceased individuals | ||
| Name | Count | Lived (average) |
|---|---|---|
| John | 146 | 73.9 years |
| William | 140 | 74.0 years |
| Robert | 120 | 71.1 years |
| James | 105 | 72.0 years |
| Charles | 76 | 77.7 years |
| George | 69 | 73.6 years |
| Mary | 55 | 76.7 years |
| Thomas | 54 | 73.4 years |
| Richard | 54 | 70.9 years |
| Donald | 49 | 71.2 years |
| Most common last names in La Paz County, AZ among deceased individuals | ||
| Last name | Count | Lived (average) |
|---|---|---|
| Smith | 47 | 73.2 years |
| Brown | 44 | 75.4 years |
| Johnson | 39 | 75.2 years |
| Williams | 31 | 73.1 years |
| Miller | 29 | 74.6 years |
| Jones | 28 | 73.6 years |
| Davis | 24 | 75.5 years |
| Scott | 22 | 73.1 years |
| White | 22 | 72.3 years |
| Taylor | 21 | 70.3 years |
| Businesses in La Paz County, AZ | ||||
| Name | Count | Name | Count | |
|---|---|---|---|---|
| Ace Hardware | 1 | McDonald's | 2 | |
| AutoZone | 1 | Motel 6 | 1 | |
| Best Western | 1 | Pizza Hut | 1 | |
| Burger King | 2 | RadioShack | 1 | |
| CVS | 1 | Safeway | 1 | |
| Carl\s Jr. | 1 | Sears | 1 | |
| Chevrolet | 1 | Starbucks | 1 | |
| Domino's Pizza | 1 | Taco Bell | 1 | |
| FedEx | 5 | True Value | 1 | |
| Ford | 1 | U-Haul | 2 | |
| H&R Block | 1 | UPS | 4 | |
| KFC | 1 | Vons | 1 | |
| MasterBrand Cabinets | 1 | Walmart | 1 | |
La Paz County on our top lists:
- #24 on the list of "Top 101 counties with the highest Ozone (1-hour) air pollution readings in 2012 (ppm)"