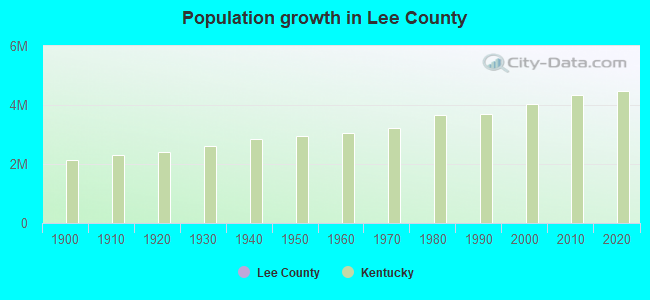
Lee County, Kentucky (KY)
County owner-occupied free and clear houses and condos in 2010: 1,210
County owner-occupied houses and condos in 2000: 2,292
Renter-occupied apartments: 743 (it was 693 in 2000)
| % of renters here: | 23% |
| State: | 31% |
Land area: 210 sq. mi.
Water area: 1.4 sq. mi.
Population density: 35 people per square mile (low).
Industries providing employment: Educational, health and social services (21.0%), Retail trade (15.7%), Construction (12.5%), Transportation and warehousing,and utilities (12.2%), Public administration (10.1%).
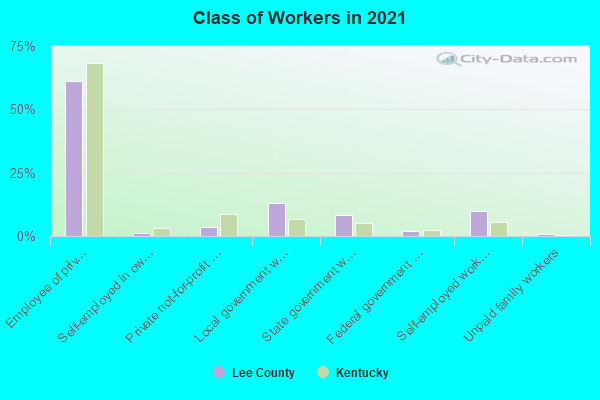
Type of workers:
- Private wage or salary: 69%
- Government: 22%
- Self-employed, not incorporated: 8%
- Unpaid family work: 1%
- OSM Map
- General Map
- Google Map
- MSN Map

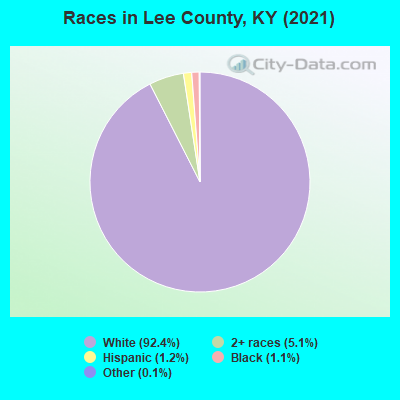
- 6,68790.7%White Non-Hispanic Alone
- 3444.7%Two or more races
- 1772.4%Hispanic or Latino
- 1431.9%Black Non-Hispanic Alone
- 120.2%Some other race alone
- 90.1%Asian alone
| Median resident age: | 42.1 years |
| Kentucky median age: | 39.4 years |
| Males: 4,181 | |
| Females: 3,172 |

 | How “southern” is Kentucky compared to VA or NC? (34 replies) |
| Lee county, hay for horses? (0 replies) |
| Allen Family in Breathitt County Jackson KY (2 replies) |
| Lee County, searching for family (0 replies) |
| Were the US to break up into four countries (S, W, Midwest and NE), which would Kentucky join? (25 replies) |
| Crittenden County Schools / Marion Kentucky (7 replies) |
| Lee County: | 2.0 people |
| Kentucky: | 2 people |
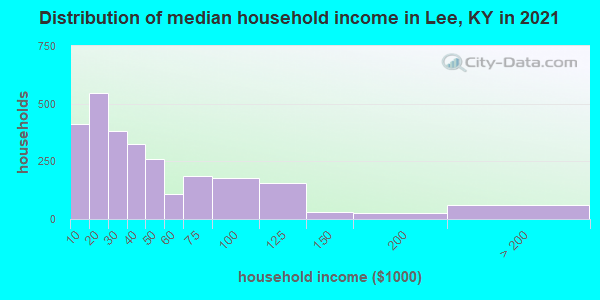
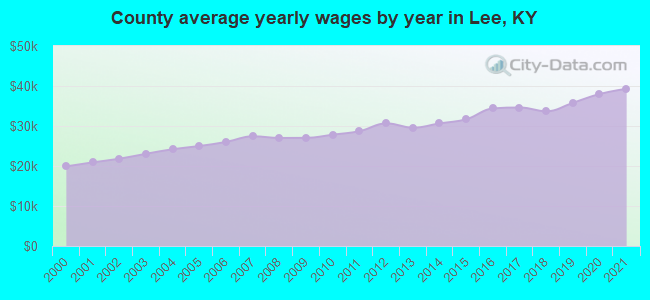
Estimated median household income in 2022: $31,238 ($18,544 in 1999)
| This county: | $31,238 |
| Kentucky: | $59,341 |
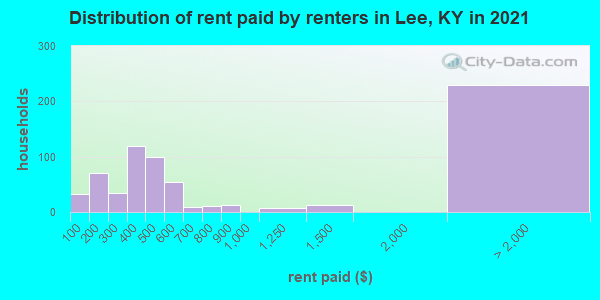
Median contract rent in 2022 for apartments: $373 (lower quartile is $250, upper quartile is $473)
| This county: | $373 |
| State: | $702 |
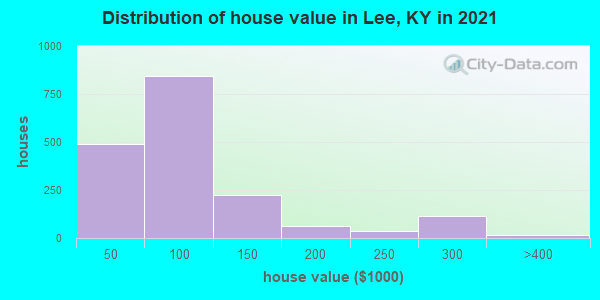
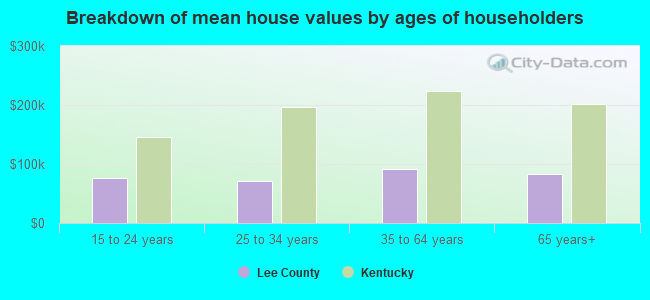
Estimated median house or condo value in 2022: $85,840 (it was $39,100 in 2000)
| Lee: | $85,840 |
| Kentucky: | $196,300 |
Mean price in 2022:
Median monthly housing costs for homes and condos with a mortgage: $925Detached houses: $112,173
Here: $112,173 State: $256,452 Townhouses or other attached units: $102,980
Here: $102,980 State: $264,090 Mobile homes: $129,419
Here: $129,419 State: $84,635
Median monthly housing costs for units without a mortgage: $373
Institutionalized population: 1,016
Crime in 2021 (reported by the sheriff's office or county police, not the county total):
- Murders: 0
- Rapes: 0
- Robberies: 0
- Assaults: 0
- Burglaries: 2
- Thefts: 9
- Auto thefts: 11
Crime in 2020 (reported by the sheriff's office or county police, not the county total):
- Murders: 0
- Rapes: 0
- Robberies: 0
- Assaults: 0
- Burglaries: 4
- Thefts: 6
- Auto thefts: 4
Median real estate property taxes paid for housing units with mortgages in 2022: $992 (1.0%)
Median real estate property taxes paid for housing units with no mortgage in 2022: $572 (0.7%)
| Lee County: | 32.0% |
| Kentucky: | 16.5% |
Median age of residents in 2022: 42.1 years old
(Males: 40.9 years old, Females: 45.6 years old)
(Median age for: White residents: 44.3 years old, Black residents: 33.7 years old, Hispanic or Latino residents: 11.0 years old)
Fair market rent in 2006 for a 1-bedroom apartment in Lee County is $374 a month.
Fair market rent for a 2-bedroom apartment is $429 a month.
Fair market rent for a 3-bedroom apartment is $537 a month.
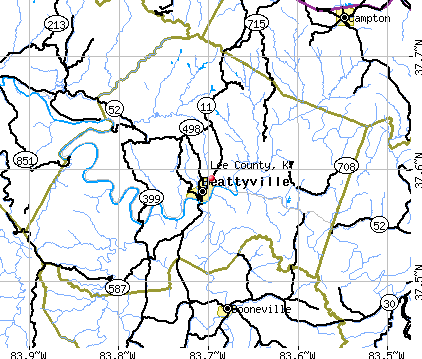
Cities in this county include: St. Helens, South River, Beattyville.
Notable locations in this county outside city limits:
Notable locations in Lee County: Knob Lick (A), Perryville Fairground (B), Persimmon Grove (C), Salem (D), Boyle County Fire Department Engine Company 5 (E), Boyle County Forkland Fire District (F), Forkland Community Center (G), Danville Youth Development Center (H), Boyle County Fire Department Station 4 (I), Boyle County Fire Department Engine Company 2 (J), Boyle County Fire Department Station 3 (K), Boyle County Fire Protection District (L). Display/hide their locations on the map
Churches in Lee County include: Faith Chapel (A), Grace Church (B), Immanuel Church (C), McDonald Church (D), North Rolling Fork Church (E), Willow Grove Chapel (F), Pleasant Valley Church (G), Stony Point Church (H), Salt River Baptist Church (I). Display/hide their locations on the map
Cemeteries: Purdom Cemetery (1), Wilson Cemetery (2), Chambers Cemetery (3), Clarkson Cemetery (4), Mitchell Cemetery (5), Aliceton Cemetery (6), Crain Cemetery (7). Display/hide their locations on the map
Reservoirs: Herrington Lake (A), Tank Pond (B). Display/hide their locations on the map
Streams, rivers, and creeks: Sergeant Hart Creek (A), Balls Branch (B), Begley Branch (C), Doctors Fork (D), Day Branch (E), Wards Branch (F), Curtis Branch (G), Tub Run (H), Clarks Run (I). Display/hide their locations on the map
Park in Lee County: Perryville Battlefield State Park (1). Display/hide its location on the map
Neighboring counties: Appomattox County, Virginia  , Monroe County, West Virginia , San Francisco County, California
  , King and Queen County, Virginia , Madison County, Missouri , Madison County .
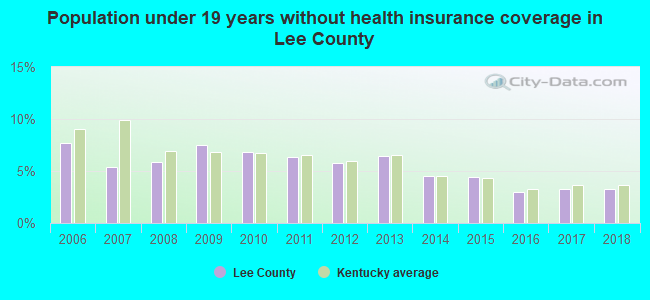
| Here: | 5.5% |
| Kentucky: | 3.8% |
Current college students: 163
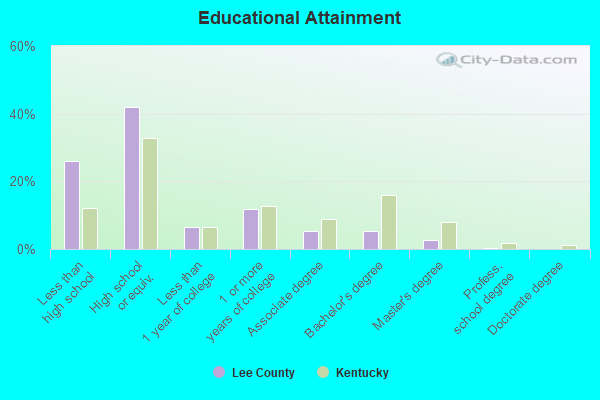
People 25 years of age or older with a high school degree or higher: 73.5%
People 25 years of age or older with a bachelor's degree or higher: 7.3%
Number of foreign born residents: 38 (59.3% naturalized citizens)
| Lee County: | 0.5% |
| Whole state: | 4.0% |
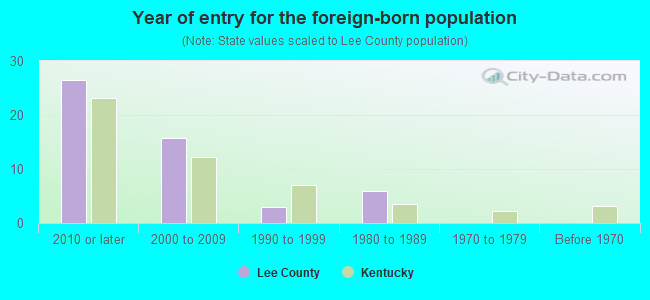
- Year of entry for the foreign-born population
- 02010 or later
- 292000 to 2009
- 41990 to 1999
- 61980 to 1989
- 01970 to 1979
- 0Before 1970
Mean travel time to work (commute): ) minutes
Percentage of county residents living and working in this county: 100.0%
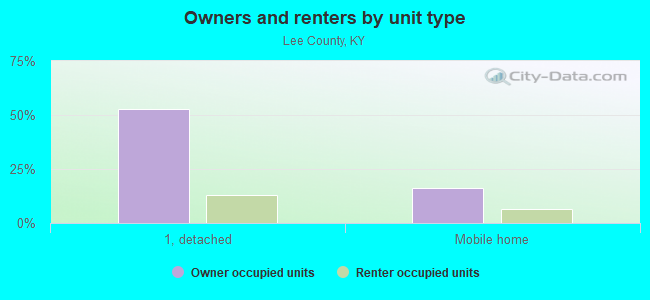
Housing units in structures:
- One, detached: 2,220
- Two: 16
- 3 or 4: 38
- 5 to 9: 121
- 10 to 19: 13
- 20 to 49: 31
- 50 or more: 11
- Mobile homes: 783
- Boats, RVs, vans, etc.: 20
Housing units in Lee County with a mortgage: 716 (61 second mortgage, 0 home equity loan, 16 both second mortgage and home equity loan)
Houses without a mortgage: 8
| Here: | 98.9% with mortgage |
| State: | 96.8% with mortgage |
Religion statistics for Lee County
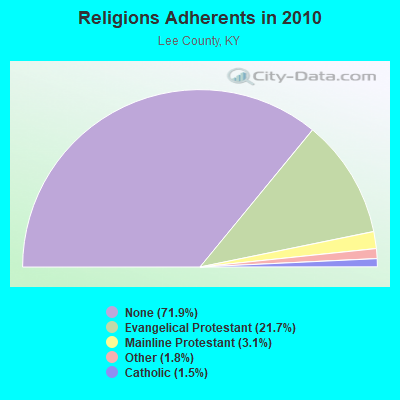
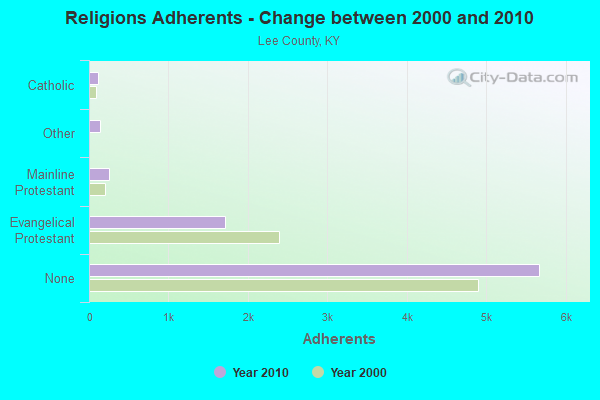
| Religion | Adherents | Congregations |
|---|---|---|
| Evangelical Protestant | 1,714 | 21 |
| Mainline Protestant | 248 | 4 |
| Other | 142 | 2 |
| Catholic | 116 | 1 |
| None | 5,667 | - |
Source: Clifford Grammich, Kirk Hadaway, Richard Houseal, Dale E.Jones, Alexei Krindatch, Richie Stanley and Richard H.Taylor. 2012. 2010 U.S.Religion Census: Religious Congregations & Membership Study. Association of Statisticians of American Religious Bodies. Jones, Dale E., et al. 2002. Congregations and Membership in the United States 2000. Nashville, TN: Glenmary Research Center.
Food Environment Statistics:
| Lee County: | 1.34 / 10,000 pop. |
| State: | 2.19 / 10,000 pop. |
| This county: | 1.34 / 10,000 pop. |
| Kentucky: | 0.74 / 10,000 pop. |
| Lee County: | 6.72 / 10,000 pop. |
| Kentucky: | 4.36 / 10,000 pop. |
| This county: | 2.69 / 10,000 pop. |
| State: | 5.74 / 10,000 pop. |
| Lee County: | 12.5% |
| Kentucky: | 11.0% |
| Lee County: | 32.9% |
| State: | 30.0% |
| Here: | 10.1% |
| State: | 15.9% |
Agriculture in Lee County:
Average size of farms: 136 acresAverage value of agricultural products sold per farm: $6,650
Average value of crops sold per acre for harvested cropland: $139.06
The value of nursery, greenhouse, floriculture, and sod as a percentage of the total market value of agricultural products sold: 19.44%
The value of livestock, poultry, and their products as a percentage of the total market value of agricultural products sold: 45.91%
Average total farm production expenses per farm: $7,122
Harvested cropland as a percentage of land in farms: 19.08%
Average market value of all machinery and equipment per farm: $20,503
The percentage of farms operated by a family or individual: 93.64%
Average age of principal farm operators: 54 years
Average number of cattle and calves per 100 acres of all land in farms: 7.94
Milk cows as a percentage of all cattle and calves: 0.64%
Corn for grain: 69 harvested acres
Vegetables: 19 harvested acres
Land in orchards: 15 acres
Tornado activity:
Lee County historical area-adjusted tornado activity is significantly below Kentucky state average. It is 5229559.4 times below overall U.S. average.Tornadoes in this county have caused 10 injuries recorded between 1950 and 2004.
On 4/3/1974, a category 2 (max. wind speeds 113-157 mph) tornado injured 10 people and caused between $50,000 and $500,000 in damages.
Earthquake activity:
Lee County-area historical earthquake activity is significantly above Kentucky state average. It is 53% greater than the overall U.S. average.On 7/27/1980 at 18:52:21, a magnitude 5.2 (5.1 MB, 4.7 MS, 5.0 UK, 5.2 UK, Class: Moderate, Intensity: VI - VII) earthquake occurred 44.5 miles away from Lee County center
On 9/7/1988 at 02:28:09, a magnitude 4.6 (4.5 MB, 4.6 LG, Class: Light, Intensity: IV - V) earthquake occurred 39.4 miles away from the county center
On 8/9/2020 at 12:07:37, a magnitude 5.1 (5.1 MW, Depth: 4.7 mi) earthquake occurred 163.1 miles away from the county center
On 4/18/2008 at 09:36:59, a magnitude 5.4 (5.1 MB, 4.8 MS, 5.4 MW, 5.2 MW) earthquake occurred 235.9 miles away from the county center
On 8/23/2011 at 17:51:04, a magnitude 5.8 (5.8 MW, Depth: 3.7 mi) earthquake occurred 315.8 miles away from Lee County center
On 11/30/1973 at 07:48:41, a magnitude 4.7 (4.7 MB, 4.6 ML) earthquake occurred 124.8 miles away from the county center
Magnitude types: regional Lg-wave magnitude (LG), body-wave magnitude (MB), local magnitude (ML), surface-wave magnitude (MS), moment magnitude (MW)
Most recent natural disasters:
- Kentucky Covid-19 Pandemic, Incident Period: January 20, 2020, FEMA Id: 4497, Natural disaster type: Other
- Kentucky Severe Storms, Straight-line Winds, Flooding, Landslides, And Mudslides, Incident Period: February 6, 2019 - March 10, 2019, FEMA Id: 4428, Natural disaster type: Storm, Mudslide, Landslide, Flood, Wind
- Kentucky Severe Storms, Flooding, Landslides, And Mudslides, Incident Period: February 9, 2018 - February 14, 2018, FEMA Id: 4358, Natural disaster type: Storm, Mudslide, Landslide, Flood
- Kentucky Severe Storms, Tornadoes, Straight-line Winds, Flooding, Landslides, and Mudslides, Incident Period: July 11, 2015 to July 20, 2015, Major Disaster (Presidential) Declared DR-4239: August 12, 2015, FEMA Id: 4239, Natural disaster type: Storm, Tornado, Mudslide, Landslide, Flood, Wind
- Kentucky Severe Storms, Tornadoes, Flooding, Landslides, and Mudslides, Incident Period: April 02, 2015 to April 17, 2015, Major Disaster (Presidential) Declared DR-4217: May 01, 2015, FEMA Id: 4217, Natural disaster type: Storm, Tornado, Mudslide, Landslide, Flood
- Kentucky Severe Winter Storm, Snowstorm, Flooding, Landslides, and Mudslides, Incident Period: March 03, 2015 to March 09, 2015, Major Disaster (Presidential) Declared DR-4218: May 12, 2015, FEMA Id: 4218, Natural disaster type: Snowstorm, Winter Storm, Mudslide, Landslide, Flood
- Kentucky Severe Winter Storms, Snowstorms, Flooding, Landslides, and Mudslides, Incident Period: February 15, 2015 to February 23, 2015, Major Disaster (Presidential) Declared DR-4216: April 30, 2015, FEMA Id: 4216, Natural disaster type: Snowstorm, Winter Storm, Mudslide, Landslide, Flood
- Kentucky Severe Storms, Tornadoes, and Flooding, Incident Period: June 19, 2011 to June 23, 2011, Major Disaster (Presidential) Declared DR-4008: July 25, 2011, FEMA Id: 4008, Natural disaster type: Storm, Tornado, Flood
- Kentucky Severe Storms, Tornadoes, and Flooding, Incident Period: April 12, 2011 to May 20, 2011, Major Disaster (Presidential) Declared DR-1976: May 04, 2011, FEMA Id: 1976, Natural disaster type: Storm, Tornado, Flood
- Kentucky Severe Storms, Flooding, Mudslides, and Tornadoes, Incident Period: May 01, 2010 to June 01, 2010, Major Disaster (Presidential) Declared DR-1912: May 11, 2010, FEMA Id: 1912, Natural disaster type: Storm, Tornado, Mudslide, Flood
- 17 other natural disasters have been reported since 1953.
The number of natural disasters in Lee County (27) is a lot greater than the US average (15).
Major Disasters (Presidential) Declared: 21
Emergencies Declared: 3
Causes of natural disasters: Floods: 19, Storms: 16, Mudslides: 9, Tornadoes: 9, Winter Storms: 7, Landslides: 6, Winds: 3, Snowstorms: 2, Blizzard: 1, Freeze: 1, Hurricane: 1, Snow: 1, Snowfall: 1, Other: 1 (Note: some incidents may be assigned to more than one category).
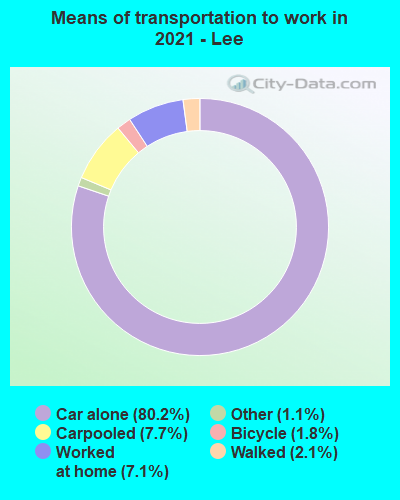
Means of transportation to work:
- Drove a car alone: 1,393 (73.3%)
- Carpooled: 185 (9.7%)
- Bus: 1 (0.1%)
- Taxicab, motorcycle, or other means: 95 (5.0%)
- Walked: 14 (0.7%)
- Worked at home: 239 (12.6%)
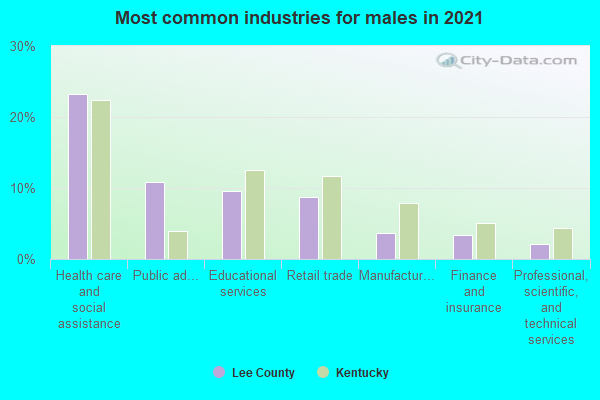
- Health care and social assistance (17%)
- Public administration (9%)
- Retail trade (9%)
- Educational services (8%)
- Finance and insurance (3%)
- Professional, scientific, and technical services (3%)
- Manufacturing (3%)
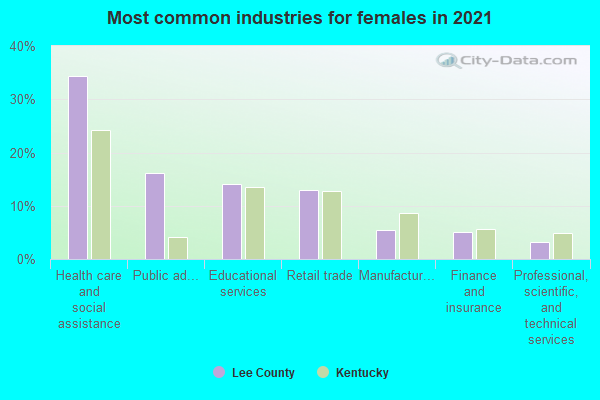
- Health care and social assistance (29%)
- Public administration (16%)
- Retail trade (15%)
- Educational services (13%)
- Finance and insurance (5%)
- Professional, scientific, and technical services (5%)
- Manufacturing (4%)
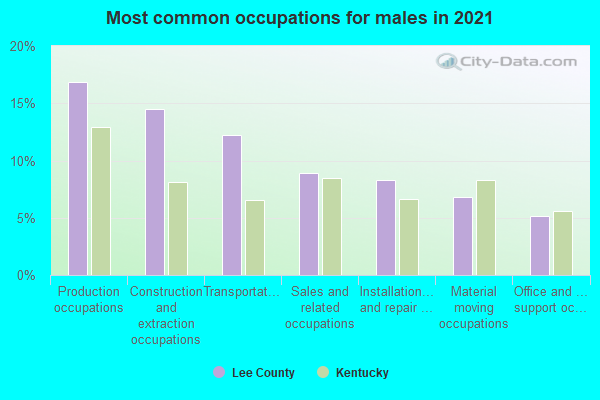
- Construction and extraction occupations (16%)
- Transportation occupations (15%)
- Production occupations (13%)
- Sales and related occupations (9%)
- Building and grounds cleaning and maintenance occupations (6%)
- Material moving occupations (6%)
- Office and administrative support occupations (5%)
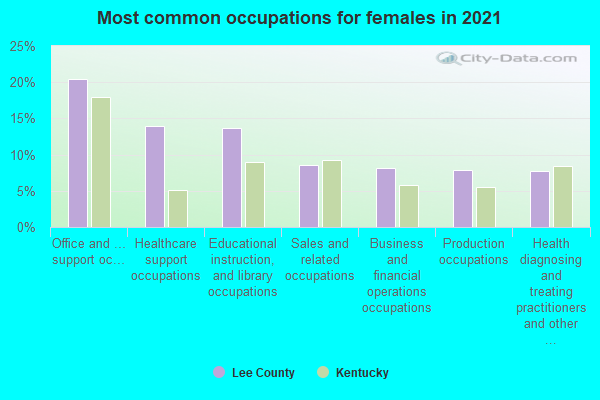
- Office and administrative support occupations (15%)
- Healthcare support occupations (13%)
- Educational instruction, and library occupations (13%)
- Health diagnosing and treating practitioners and other technical occupations (10%)
- Sales and related occupations (8%)
- Business and financial operations occupations (8%)
- Production occupations (8%)
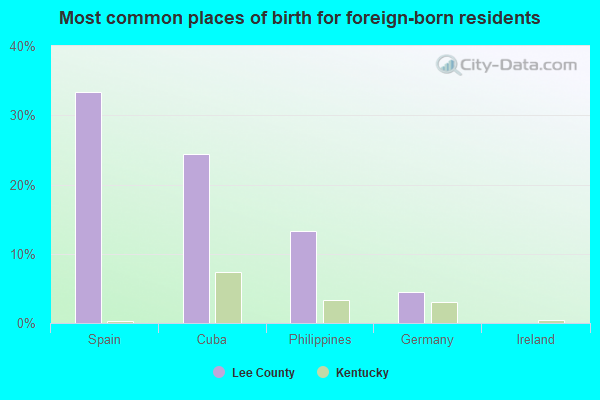
- United Kingdom, excluding England and Scotland (44%)
- Cuba (26%)
- Philippines (23%)
- Ireland (0%)
- Norway (0%)
- Sweden (0%)
- England (0%)
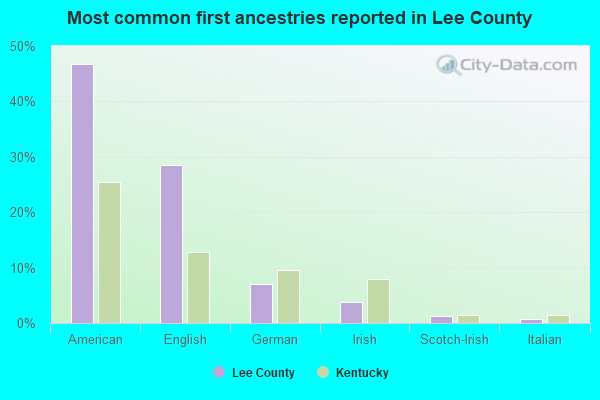
- American (41%)
- English (30%)
- German (7%)
- Irish (5%)
- Scotch-Irish (1%)
- Scottish (1%)
- European (1%)
People in group quarters in Lee County, Kentucky in 2010:
- 819 people in state prisons
- 185 people in local jails and other municipal confinement facilities
- 12 people in residential treatment centers for juveniles (non-correctional)
117 people in nursing homes
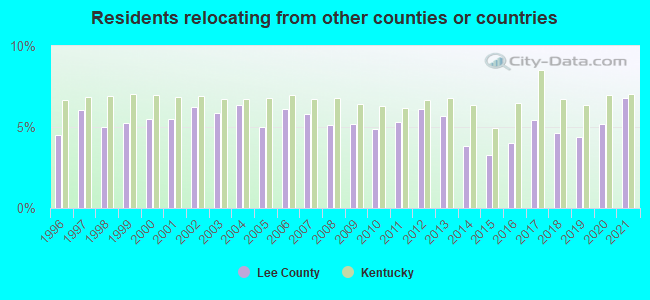
6.78% of this county's 2021 resident taxpayers lived in other counties in 2020 ($24,611 average adjusted gross income)
| Here: | 6.78% |
| Kentucky average: | 7.04% |
10 or fewer of this county's residents moved from foreign countries.
5.70% relocated from other counties in Kentucky ($20,333 average AGI)
1.08% relocated from other states ($4,270 average AGI)
Lee County: 1.08% Kentucky average: 2.87%
5.15% of this county's 2020 resident taxpayers moved to other counties in 2021 ($41,926 average adjusted gross income)
| Here: | 5.15% |
| Kentucky average: | 6.89% |
10 or fewer of this county's residents moved to foreign countries.
5.15% relocated to other counties in Kentucky ($41,926 average AGI)
10 or fewer of this county's residents relocated to other states.

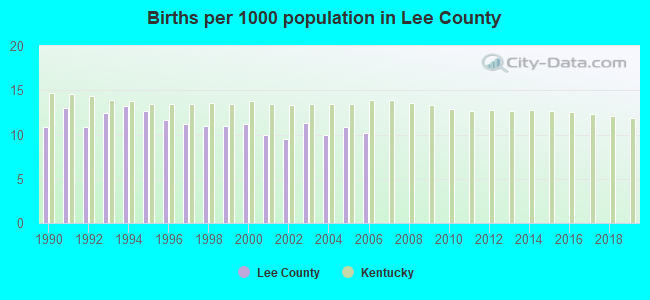
Births per 1000 population from 1990 to 1999: 11.8
Births per 1000 population from 2000 to 2006: 10.4
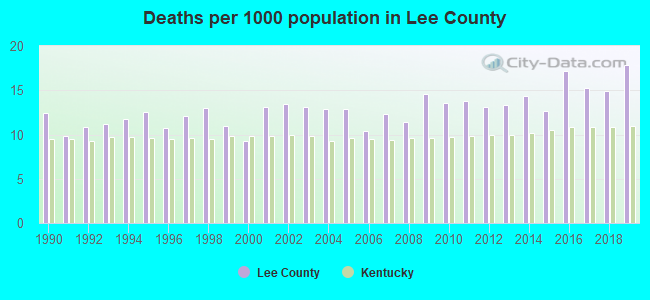
Deaths per 1000 population from 1990 to 1999: 11.5
Deaths per 1000 population from 2000 to 2009: 12.3
Deaths per 1000 population from 2010 to 2020: 15.1
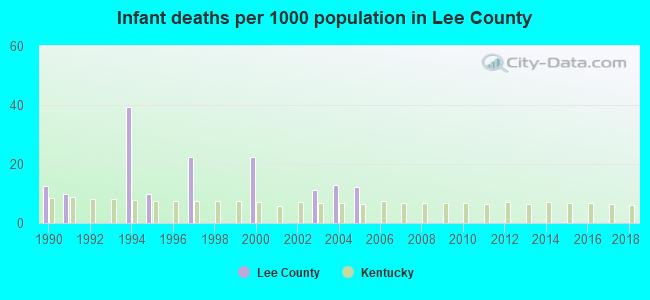
Infant deaths per 1000 live births from 1990 to 1999: 9.4
Infant deaths per 1000 live births from 2000 to 2006: 8.4
Persons under 19 years old without health insurance coverage in 2018: 3.3%
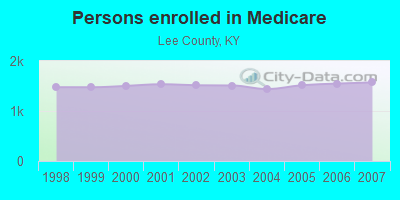
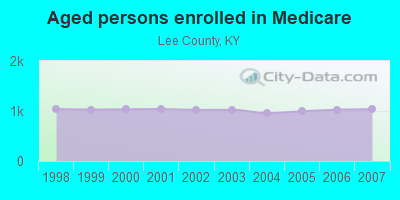
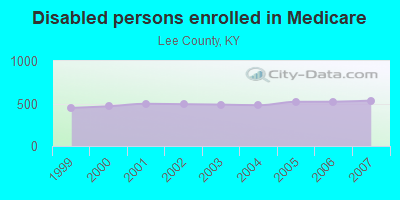
Persons enrolled in hospital insurance and/or supplemental medical insurance (Medicare) in July 1, 2007: 1,572 (1,037 aged, 535 disabled)
Children under 18 without health insurance coverage in 2007: 192 (14%)
Most common underlying causes of death in Lee County, Kentucky in 1999 - 2019:
- Acute myocardial infarction, unspecified (135)
- Bronchus or lung, unspecified - Malignant neoplasms (65)
- Chronic obstructive pulmonary disease, unspecified (35)
- Atherosclerotic heart disease (31)
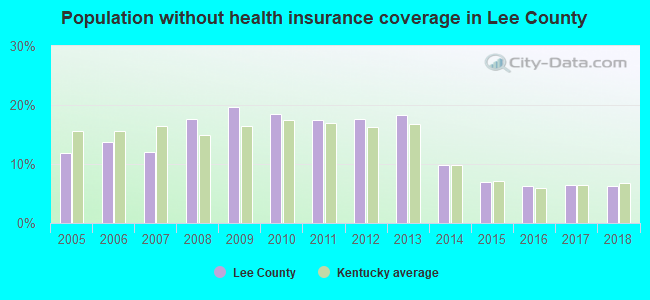
Population without health insurance coverage in 2000: 21%
Children under 18 without health insurance coverage in 2000: 15%
Medical specialist MDs per 100,000 population in 2005: 1,388
Total births per 100,000 population, July 2005 - July 2006 : 25
Total deaths per 100,000 population, July 2005 - July 2006: 26
EPA green book nonattainment status in 2004-2006: 1
Crimes per 100,000 population in 1996: 1
Household type by relationship:
Households: 7,353- Male householders: 1,416 (523 living alone), Female householders: 1,301 (421 living alone)
1,082 spouses (1,077 opposite-sex spouses), 260 unmarried partners, (260 opposite-sex unmarried partners), 1,888 children (1,726 natural, 81 adopted, 80 stepchildren), 237 grandchildren, 77 brothers or sisters, 116 parents, 11 foster children, 150 other relatives, 100 non-relatives
- In group quarters: 669
Size of family households: 829 2-persons, 412 3-persons, 159 4-persons, 127 5-persons, 68 6-persons, 42 7-or-more-persons.
Size of nonfamily households: 944 1-person, 149 2-persons.
776 married couples with children.
422 single-parent households (90 men, 332 women).
99.2% of residents of Lee speak English at home.
0.3% of residents speak Spanish at home (71% speak English very well, 29% speak English not well).
0.4% of residents speak other Indo-European language at home (100% speak English very well).
In fiscal year 2004:
Federal Government expenditure: $58,261,000 ($7,483 per capita)
Department of Defense expenditure: $500,000
Federal direct payments to individuals for retirement and disability: $23,535,000
Federal other direct payments to individuals: $12,810,000
Federal direct payments not to individuals: $150,000
Federal grants: $20,126,000
Federal procurement contracts: $399,000 ($50,000 Department of Defense)
Federal salaries and wages: $1,241,000 ($0,000 Department of Defense)
Federal Government direct loans: $389,000
Federal guaranteed/insured loans: $58,000
Federal Government insurance: $3,982,000
Population change from April 1, 2000 to July 1, 2005:
Births: 445| Here: | 58 per 1000 residents |
| State: | 69 per 1000 residents |
Deaths: 530
| Here: | 69 per 1000 residents |
| State: | 50 per 1000 residents |
Net international migration: +3
| Here: | +0 per 1000 residents |
| State: | +7 per 1000 residents |
Net internal migration: -110
| Here: | |
| State: |
Total withdrawal of fresh water for public supply: 0.52 millions of gallons per day (all from surface)
| Here: | 5.7 |
| State: | 6.4 |
| Here: | 4.4 |
| State: | 4.4 |
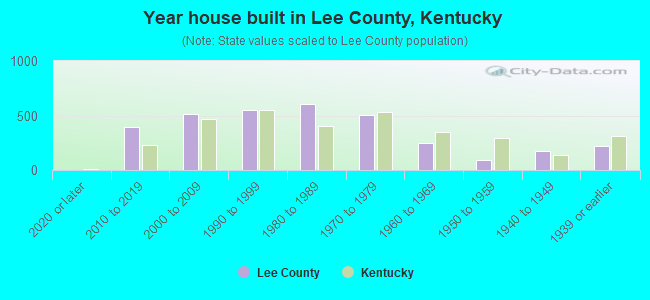
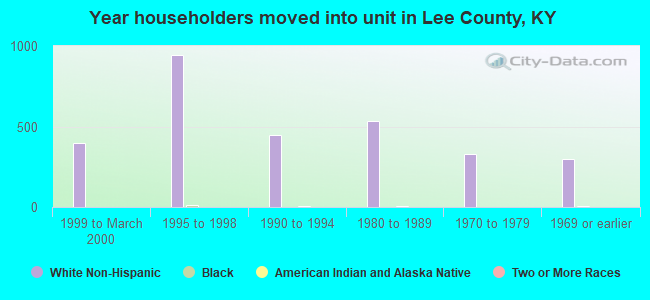
- Year house built in Lee County, Kentucky
- 32020 or later
- 4092010 to 2019
- 5082000 to 2009
- 5091990 to 1999
- 6481980 to 1989
- 5311970 to 1979
- 1811960 to 1969
- 881950 to 1959
- 1531940 to 1949
- 2371939 or earlier
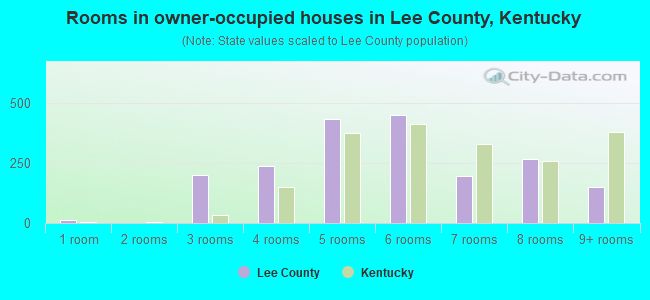
- Rooms in owner-occupied houses in Lee County, Kentucky
- 201 room
- 02 rooms
- 1993 rooms
- 2014 rooms
- 4375 rooms
- 5436 rooms
- 1967 rooms
- 2098 rooms
- 1149+ rooms
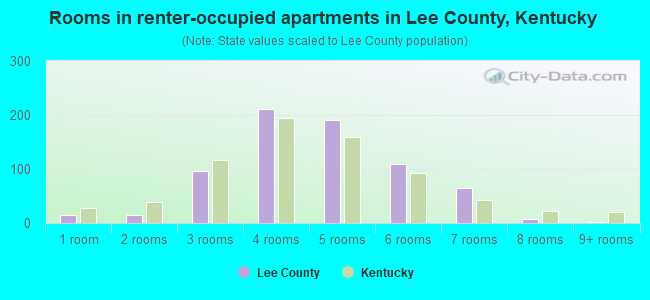
- Rooms in renter-occupied apartments in Lee County, Kentucky
- 141 room
- 152 rooms
- 1413 rooms
- 2554 rooms
- 2015 rooms
- 1036 rooms
- 607 rooms
- 98 rooms
- 49+ rooms
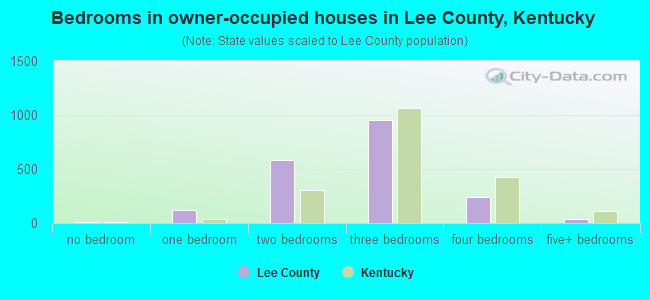
- Bedrooms in owner-occupied houses in Lee County, Kentucky
- 19no bedroom
- 1001 bedroom
- 5722 bedrooms
- 9733 bedrooms
- 2234 bedrooms
- 335+ bedrooms
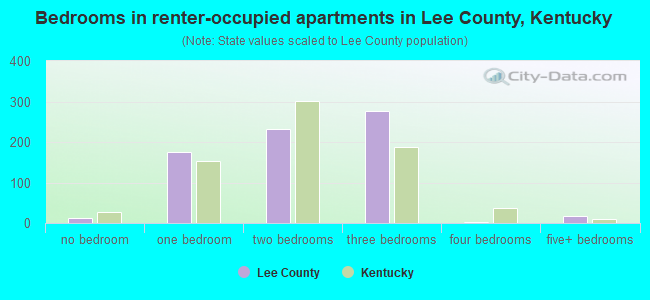
- Bedrooms in renter-occupied apartments in Lee County, Kentucky
- 15no bedroom
- 2371 bedroom
- 2582 bedrooms
- 2793 bedrooms
- 44 bedrooms
- 165+ bedrooms
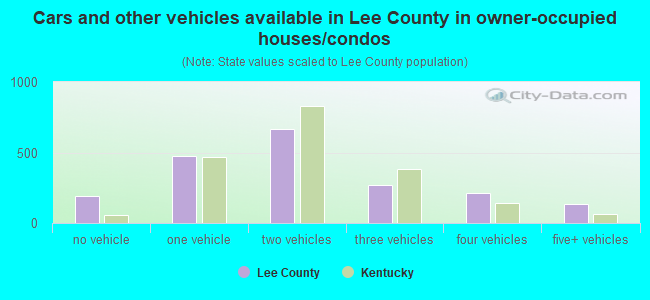
- Cars and other vehicles available in Lee County in owner-occupied houses/condos
- 173no vehicle
- 5411 vehicle
- 6092 vehicles
- 2453 vehicles
- 1684 vehicles
- 1665+ vehicles
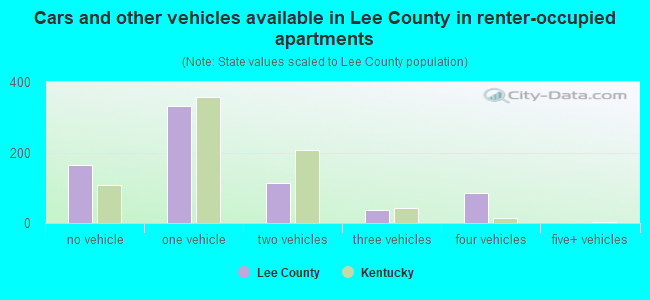
- Cars and other vehicles available in Lee County in renter-occupied apartments
- 225no vehicle
- 3291 vehicle
- 1552 vehicles
- 443 vehicles
- 514 vehicles
- 05+ vehicles
86.0% of Lee County residents lived in the same house 1 years ago.
Out of people who lived in different houses, 16% lived in this county.
Out of people who lived in different counties, 90% lived in Kentucky.
| Lee County: | 86.0% |
| State average: | 87.2% |
Place of birth for U.S.-born residents:
- This state: 5,580
- Other state: 1,697
- Northeast: 100
- Midwest: 1,162
- South: 306
- West: 117
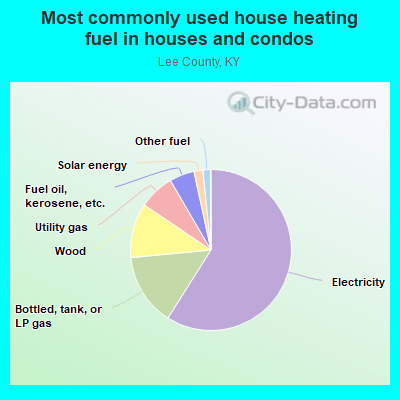
- 57.5%Electricity
- 19.8%Bottled, tank, or LP gas
- 8.8%Wood
- 5.8%Utility gas
- 3.8%Fuel oil, kerosene, etc.
- 2.2%Solar energy
- 2.1%Other fuel
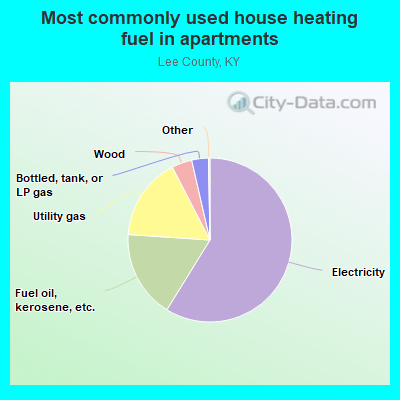
- 72.3%Electricity
- 11.5%Utility gas
- 11.3%Fuel oil, kerosene, etc.
- 2.6%Bottled, tank, or LP gas
- 2.2%Wood
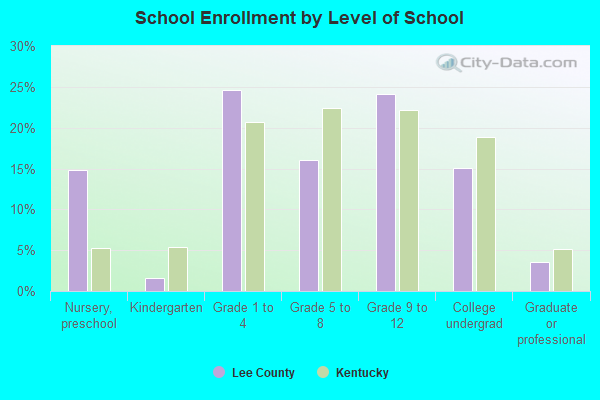
Private vs. public school enrollment:
| Here: | 14.2% |
| Kentucky: | 17.2% |
| Here: | 19.5% |
| Kentucky: | 15.2% |
| Here: | 26.4% |
| Kentucky: | 19.6% |
Lee County government finances - Expenditure in 2018:
- Bond Funds - Cash and Securities: $39,000
- Charges - Solid Waste Management: $523,000
Other: $12,000
- Construction - General - Other: $28,000
- Current Operations - General - Other: $907,000
Regular Highways: $885,000
Solid Waste Management: $391,000
Central Staff Services: $269,000
Police Protection: $252,000
General Public Buildings: $247,000
Health - Other: $157,000
Correctional Institutions: $94,000
Parks and Recreation: $66,000
Financial Administration: $58,000
Local Fire Protection: $50,000
Public Welfare - Other: $35,000
Judicial and Legal Services: $23,000
Natural Resources - Other: $2,000
Miscellaneous Commercial Activities - Other: $1,000
- Federal Intergovernmental - Other: $35,000
Health and Hospitals: $15,000
- General - Interest on Debt: $23,000
- Intergovernmental to Local - Other - Correctional Institutions: $336,000
- Local Intergovernmental - General Local Government Support: $31,000
Other: $1,000
- Miscellaneous - Sale of Property: $275,000
General Revenue - Other: $69,000
Rents: $52,000
Interest Earnings: $6,000
- Other Capital Outlay - Regular Highways: $776,000
General - Other: $240,000
Solid Waste Management: $71,000
Health - Other: $35,000
- Other Funds - Cash and Securities: $433,000
- State Intergovernmental - Highways: $988,000
Other: $872,000
General Local Government Support: $22,000
- Tax - Property: $1,302,000
Public Utilities Sales: $210,000
Corporation License: $35,000
Documentary and Stock Transfer: $18,000
- Total Salaries and Wages: $1,036,000
Lee County government finances - Revenue in 2018:
- Bond Funds - Cash and Securities: $39,000
- Charges - Solid Waste Management: $523,000
Other: $12,000
- Construction - General - Other: $28,000
- Current Operations - General - Other: $907,000
Regular Highways: $885,000
Solid Waste Management: $391,000
Central Staff Services: $269,000
Police Protection: $252,000
General Public Buildings: $247,000
Health - Other: $157,000
Correctional Institutions: $94,000
Parks and Recreation: $66,000
Financial Administration: $58,000
Local Fire Protection: $50,000
Public Welfare - Other: $35,000
Judicial and Legal Services: $23,000
Natural Resources - Other: $2,000
Miscellaneous Commercial Activities - Other: $1,000
- Federal Intergovernmental - Other: $35,000
Health and Hospitals: $15,000
- General - Interest on Debt: $23,000
- Intergovernmental to Local - Other - Correctional Institutions: $336,000
- Local Intergovernmental - General Local Government Support: $31,000
Other: $1,000
- Miscellaneous - Sale of Property: $275,000
General Revenue - Other: $69,000
Rents: $52,000
Interest Earnings: $6,000
- Other Capital Outlay - Regular Highways: $776,000
General - Other: $240,000
Solid Waste Management: $71,000
Health - Other: $35,000
- Other Funds - Cash and Securities: $433,000
- State Intergovernmental - Highways: $988,000
Other: $872,000
General Local Government Support: $22,000
- Tax - Property: $1,302,000
Public Utilities Sales: $210,000
Corporation License: $35,000
Documentary and Stock Transfer: $18,000
- Total Salaries and Wages: $1,036,000
Lee County government finances - Debt in 2018:
- Bond Funds - Cash and Securities: $39,000
- Charges - Solid Waste Management: $523,000
Other: $12,000
- Construction - General - Other: $28,000
- Current Operations - General - Other: $907,000
Regular Highways: $885,000
Solid Waste Management: $391,000
Central Staff Services: $269,000
Police Protection: $252,000
General Public Buildings: $247,000
Health - Other: $157,000
Correctional Institutions: $94,000
Parks and Recreation: $66,000
Financial Administration: $58,000
Local Fire Protection: $50,000
Public Welfare - Other: $35,000
Judicial and Legal Services: $23,000
Natural Resources - Other: $2,000
Miscellaneous Commercial Activities - Other: $1,000
- Federal Intergovernmental - Other: $35,000
Health and Hospitals: $15,000
- General - Interest on Debt: $23,000
- Intergovernmental to Local - Other - Correctional Institutions: $336,000
- Local Intergovernmental - General Local Government Support: $31,000
Other: $1,000
- Miscellaneous - Sale of Property: $275,000
General Revenue - Other: $69,000
Rents: $52,000
Interest Earnings: $6,000
- Other Capital Outlay - Regular Highways: $776,000
General - Other: $240,000
Solid Waste Management: $71,000
Health - Other: $35,000
- Other Funds - Cash and Securities: $433,000
- State Intergovernmental - Highways: $988,000
Other: $872,000
General Local Government Support: $22,000
- Tax - Property: $1,302,000
Public Utilities Sales: $210,000
Corporation License: $35,000
Documentary and Stock Transfer: $18,000
- Total Salaries and Wages: $1,036,000
Lee County government finances - Cash and Securities in 2018:
- Bond Funds - Cash and Securities: $39,000
- Charges - Solid Waste Management: $523,000
Other: $12,000
- Construction - General - Other: $28,000
- Current Operations - General - Other: $907,000
Regular Highways: $885,000
Solid Waste Management: $391,000
Central Staff Services: $269,000
Police Protection: $252,000
General Public Buildings: $247,000
Health - Other: $157,000
Correctional Institutions: $94,000
Parks and Recreation: $66,000
Financial Administration: $58,000
Local Fire Protection: $50,000
Public Welfare - Other: $35,000
Judicial and Legal Services: $23,000
Natural Resources - Other: $2,000
Miscellaneous Commercial Activities - Other: $1,000
- Federal Intergovernmental - Other: $35,000
Health and Hospitals: $15,000
- General - Interest on Debt: $23,000
- Intergovernmental to Local - Other - Correctional Institutions: $336,000
- Local Intergovernmental - General Local Government Support: $31,000
Other: $1,000
- Miscellaneous - Sale of Property: $275,000
General Revenue - Other: $69,000
Rents: $52,000
Interest Earnings: $6,000
- Other Capital Outlay - Regular Highways: $776,000
General - Other: $240,000
Solid Waste Management: $71,000
Health - Other: $35,000
- Other Funds - Cash and Securities: $433,000
- State Intergovernmental - Highways: $988,000
Other: $872,000
General Local Government Support: $22,000
- Tax - Property: $1,302,000
Public Utilities Sales: $210,000
Corporation License: $35,000
Documentary and Stock Transfer: $18,000
- Total Salaries and Wages: $1,036,000
Supplemental Security Income (SSI) in 2006:
- Total number of recipients: 935
- Number of aged recipients: 47
- Number of blind and disabled recipients: 888
- Number of recipients under 18: 111
- Number of recipients between 18 and 64: 654
- Number of recipients older than 64: 170
- Number of recipients also receiving OASDI: 260
- Amount of payments (thousands of dollars): 431
| Most common first names in Lee County, KY among deceased individuals | ||
| Name | Count | Lived (average) |
|---|---|---|
| James | 49 | 71.5 years |
| John | 48 | 71.7 years |
| William | 41 | 75.7 years |
| Robert | 38 | 74.8 years |
| Mary | 36 | 79.9 years |
| Henry | 18 | 77.8 years |
| Lillie | 18 | 81.5 years |
| Thomas | 18 | 65.5 years |
| Clarence | 18 | 75.4 years |
| Charles | 16 | 70.9 years |
| Most common last names in Lee County, KY among deceased individuals | ||
| Last name | Count | Lived (average) |
|---|---|---|
| Brandenburg | 82 | 76.2 years |
| Mcintosh | 49 | 72.6 years |
| Moore | 39 | 72.2 years |
| Spencer | 39 | 73.8 years |
| Stamper | 37 | 72.7 years |
| Combs | 32 | 76.0 years |
| Johnson | 29 | 67.6 years |
| Deaton | 28 | 70.0 years |
| Smith | 25 | 75.0 years |
| Fox | 25 | 74.3 years |
| Businesses in Lee County, KY | ||||
| Name | Count | Name | Count | |
|---|---|---|---|---|
| Advance Auto Parts | 1 | Rite Aid | 1 | |
| Dairy Queen | 1 | Subway | 1 | |
| H&R Block | 1 | U-Haul | 1 | |
Lee County on our top lists:
- #33 on the list of "Top 101 counties with the smallest number of children under 18 without health insurance coverage in 2000"
- #65 on the list of "Top 101 counties with the smallest number of people without health insurance coverage in 2000"