Livingston County, Michigan (MI)
County owner-occupied free and clear houses and condos in 2010: 12,212
County owner-occupied houses and condos in 2000: 48,780
Renter-occupied apartments: 9,877 (it was 6,604 in 2000)
| % of renters here: | 12% |
| State: | 28% |
Land area: 568 sq. mi.
Water area: 17.0 sq. mi.
Population density: 345 people per square mile (high).
Industries providing employment: Educational, health and social services (21.1%), Manufacturing (17.5%), Retail trade (11.4%), Professional, scientific, management, administrative, and waste management services (10.7%).
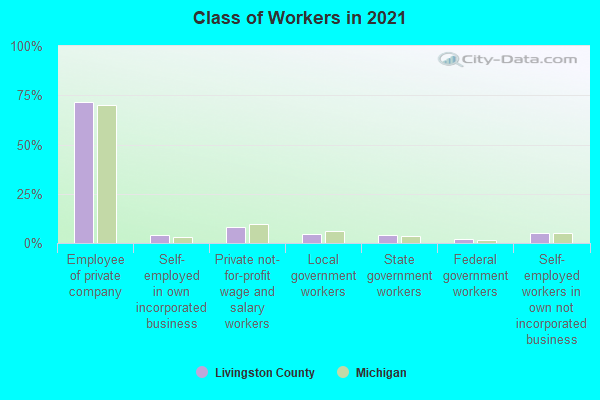
Type of workers:
- Private wage or salary: 84%
- Government: 10%
- Self-employed, not incorporated: 5%
- Unpaid family work: 0%
- OSM Map
- General Map
- Google Map
- MSN Map

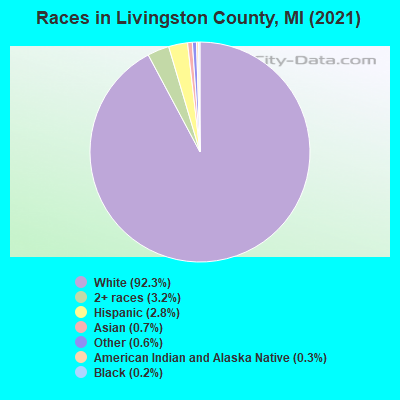
- 181,37992.5%White Non-Hispanic Alone
- 5,4982.8%Hispanic or Latino
- 5,1872.6%Two or more races
- 1,7670.9%Asian alone
- 1,4700.7%Black Non-Hispanic Alone
- 5500.3%Some other race alone
- 3100.2%American Indian and Alaska Native alone
| Median resident age: | 44.0 years |
| Michigan median age: | 40.3 years |
| Males: 99,030 | |
| Females: 97,131 |

 | I-96 speed traps in Livingston County (14 replies) |
| Home Builders - Livingston County (1 reply) |
| Best fall color hikes in Emmet County area? (17 replies) |
| Major Downtown/Midtown/Corktown Developments! (1047 replies) |
| Fall colors near Detroit Metro (6 replies) |
| One Step Closer: Scoping out Metro Detroit & Grand Rapids areas for Future Relocation (26 replies) |
| Livingston County: | 2.0 people |
| Michigan: | 2 people |
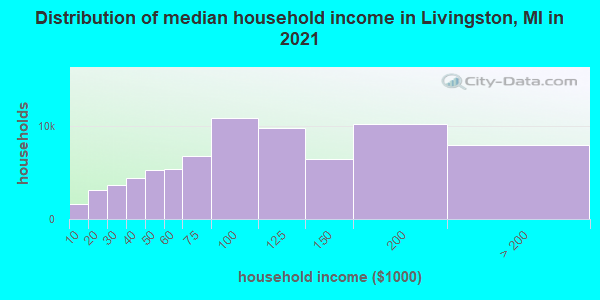
Estimated median household income in 2022: $100,139 ($67,400 in 1999)
| This county: | $100,139 |
| Michigan: | $66,986 |
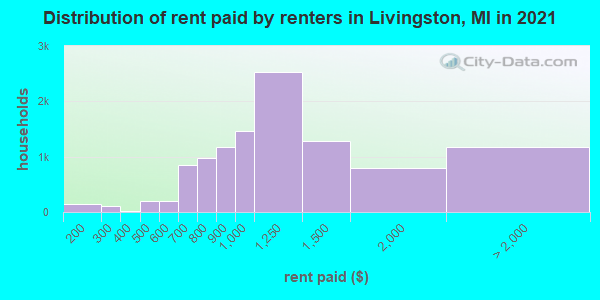
Median contract rent in 2022 for apartments: $1,057 (lower quartile is $827, upper quartile is $1,265)
| This county: | $1057 |
| State: | $865 |
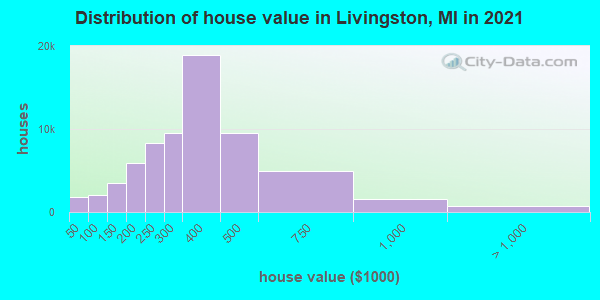
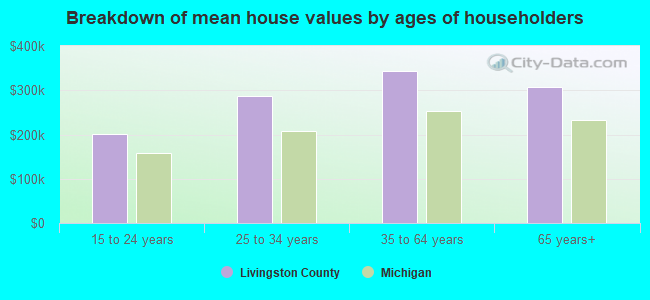
Estimated median house or condo value in 2022: $348,800 (it was $185,900 in 2000)
| Livingston: | $348,800 |
| Michigan: | $224,400 |
Mean price in 2022:
Median monthly housing costs for homes and condos with a mortgage: $1,765Detached houses: $388,032
Here: $388,032 State: $280,038 Townhouses or other attached units: $323,784
Here: $323,784 State: $239,520 In 2-unit structures: $281,712
Here: $281,712 State: $219,481 In 3-to-4-unit structures: $202,185
Here: $202,185 State: $207,067 In 5-or-more-unit structures: $150,891
Here: $150,891 State: $192,733 Mobile homes: $69,471
Here: $69,471 State: $72,868
Median monthly housing costs for units without a mortgage: $652
Institutionalized population: 829
Crime in 2021 (reported by the sheriff's office or county police, not the county total):
- Murders: 1
- Rapes: 27
- Robberies: 1
- Assaults: 42
- Burglaries: 66
- Thefts: 280
- Auto thefts: 13
Crime in 2020 (reported by the sheriff's office or county police, not the county total):
- Murders: 0
- Rapes: 15
- Robberies: 6
- Assaults: 41
- Burglaries: 62
- Thefts: 338
- Auto thefts: 23
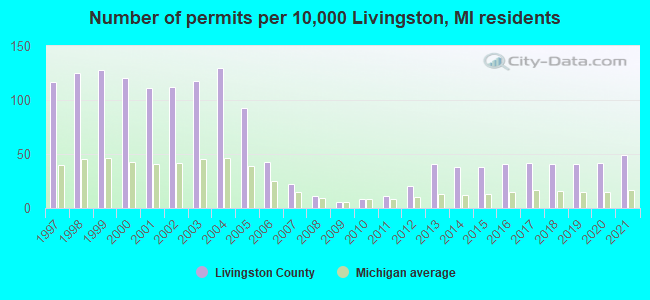
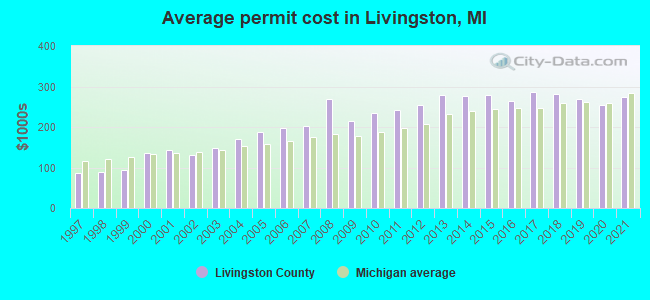
Single-family new house construction building permits:
- 2022: 764 buildings, average cost: $261,900
- 2021: 763 buildings, average cost: $273,700
- 2020: 666 buildings, average cost: $254,700
- 2019: 644 buildings, average cost: $268,200
- 2018: 638 buildings, average cost: $281,300
- 2017: 667 buildings, average cost: $285,900
- 2016: 648 buildings, average cost: $264,200
- 2015: 597 buildings, average cost: $280,400
- 2014: 603 buildings, average cost: $275,800
- 2013: 645 buildings, average cost: $279,500
- 2012: 307 buildings, average cost: $255,000
- 2011: 168 buildings, average cost: $243,200
- 2010: 130 buildings, average cost: $235,400
- 2009: 93 buildings, average cost: $214,400
- 2008: 176 buildings, average cost: $268,800
- 2007: 346 buildings, average cost: $202,800
- 2006: 679 buildings, average cost: $196,600
- 2005: 1454 buildings, average cost: $186,700
- 2004: 2033 buildings, average cost: $170,000
- 2003: 1857 buildings, average cost: $147,400
- 2002: 1765 buildings, average cost: $130,900
- 2001: 1741 buildings, average cost: $142,300
- 2000: 1877 buildings, average cost: $135,900
- 1999: 2009 buildings, average cost: $93,700
- 1998: 1969 buildings, average cost: $87,600
- 1997: 1830 buildings, average cost: $87,200
Median real estate property taxes paid for housing units with mortgages in 2022: $3,481 (1.0%)
Median real estate property taxes paid for housing units with no mortgage in 2022: $3,115 (1.0%)
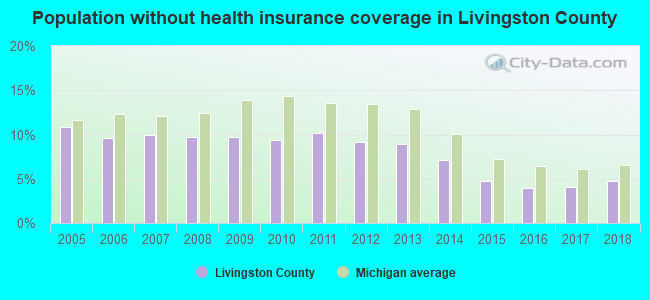
| Livingston County: | 4.6% |
| Michigan: | 13.4% |
Median age of residents in 2022: 44.0 years old
(Males: 42.6 years old, Females: 45.3 years old)
(Median age for: White residents: 45.0 years old, Black residents: 41.0 years old, American Indian residents: 30.8 years old, Asian residents: 39.9 years old, Hispanic or Latino residents: 33.1 years old, Other race residents: 51.9 years old)
Fair market rent in 2006 for a 1-bedroom apartment in Livingston County is $706 a month.
Fair market rent for a 2-bedroom apartment is $831 a month.
Fair market rent for a 3-bedroom apartment is $1198 a month.
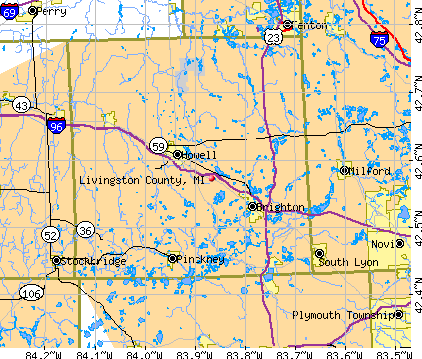
Cities in this county include: Howell, Brighton, Whitmore Lake, Fowlerville, Pinckney.
Notable locations in this county outside city limits:
Notable locations in Livingston County: Onondaga Dragway (A), Highfields Community Boys Camp (B), Chisholm Hills Country Club (C), Lansing Rest Area (D), Okemos Rest Area (E), Lansing Cottonwood Campground (F), Eastwood Towne Center (G), Wheatfield Valley Golf Course (H), Brookshire Golf Club (I), Willow Creek Golf Course (J), P J Family Campground (K), Eldorado Golf Course (L), Eagle View Golf Club (M), Branson Bay Golf Course (N), Wheel Inn Campground (O), Waverly Hills Municipal Golf Course (P), Walnut Hills Country Club (Q), Oak Lane Golf Club (R), Michigan State University Observatory (S), Holt Senior Care and Rehabilitation Center (T). Display/hide their locations on the map
Churches in Livingston County include: Church of Jesus Christ (A), Felt Plains Church (B), Gospel Hall Church (C), Grovenburg Church (D), Childs Bible Church (E), West Locke Church (F), West Columbia Church (G), Plains Church (H), United Methodist Church (I). Display/hide their locations on the map
Cemeteries: Brick Cemetery (1), Leek Cemetery (2), In God We Trust Cemetery (3), Cabot Cemetery (4), Greenwood Cemetery (5), Markham Cemetery (6), Leek Cemetery (7). Display/hide their locations on the map
Lakes: Lowe Lake (A), Lanes Lake (B), Nichols Lake (C), Jones Lake (D), Jacobs Lake (E), Hunton Lake (F), Mud Lake (G), Hewes Lake (H). Display/hide their locations on the map
Streams, rivers, and creeks: Fowler Drain (A), West Branch Willow Creek (B), West Branch Red Cedar River (C), Banta Drain (D), Wolf Creek (E), Sullivan Creek (F), Cook and Thorburn Drain (G), Squaw Creek (H), Kalamink Creek (I). Display/hide their locations on the map
Parks in Livingston County include: Wilderness Park (1), Baldwin Park (2), White Oak Township Hall Historical Marker (3), Grand River Trail Historical Marker (4), Saint Katherine's Chapel Historical Marker (5), Valhalla Park (6), Michigan Park (7), Browell Roadside Park (8), Columbia Creek Park (9). Display/hide their locations on the map
Neighboring counties: Barry County  , Josephine County, Oregon , Genesee County, New York
  , Franklin County, Idaho , Ionia County
  .
.
| Here: | 2.5% |
| Michigan: | 3.5% |
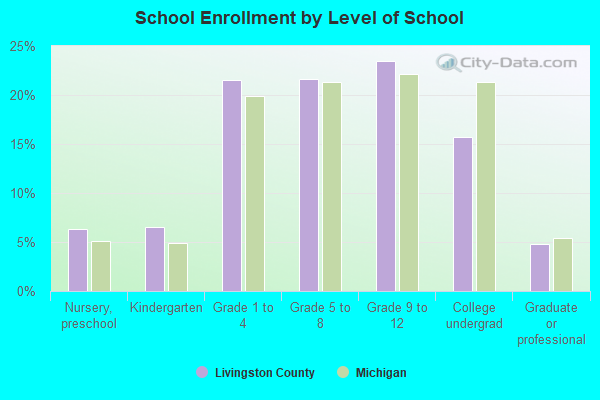
Current college students: 7,127
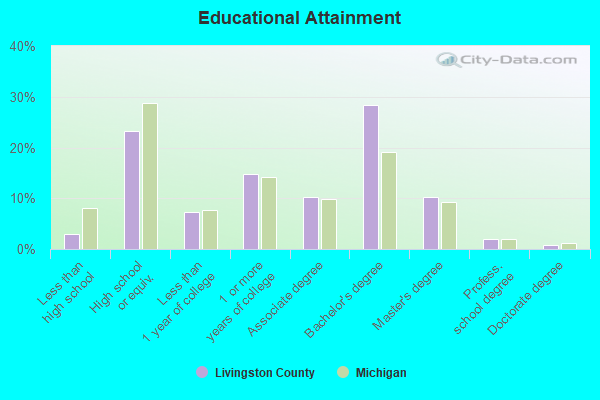
People 25 years of age or older with a high school degree or higher: 96.5%
People 25 years of age or older with a bachelor's degree or higher: 40.8%
Number of foreign born residents: 6,171 (79.2% naturalized citizens)
| Livingston County: | 3.1% |
| Whole state: | 6.9% |
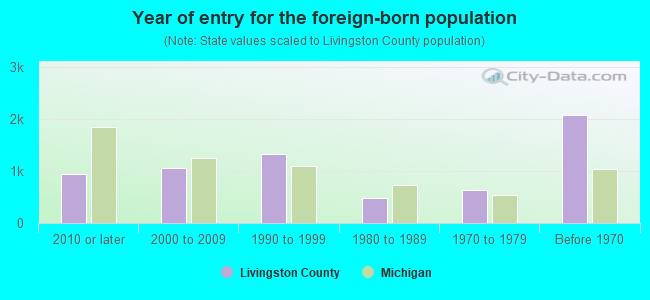
- Year of entry for the foreign-born population
- 1,0522010 or later
- 1,0722000 to 2009
- 1,1891990 to 1999
- 4721980 to 1989
- 6311970 to 1979
- 2,077Before 1970
Mean travel time to work (commute): minutes
Percentage of county residents living and working in this county: 99.7%
Housing units in structures:
- One, detached: 63,396
- One, attached: 3,716
- Two: 968
- 3 or 4: 1,516
- 5 to 9: 1,918
- 10 to 19: 1,056
- 20 to 49: 1,701
- 50 or more: 917
- Mobile homes: 4,984
Housing units in Livingston County with a mortgage: 44,950 (4,357 second mortgage, 106 home equity loan, 3,763 both second mortgage and home equity loan)
Houses without a mortgage: 1,248
| Here: | 97.8% with mortgage |
| State: | 96.7% with mortgage |
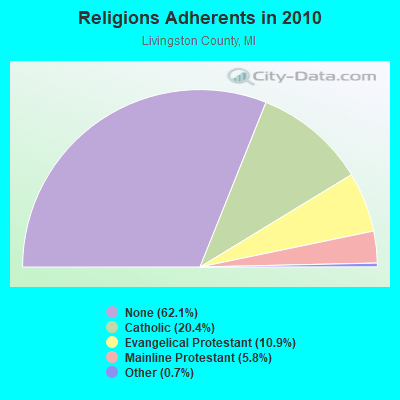
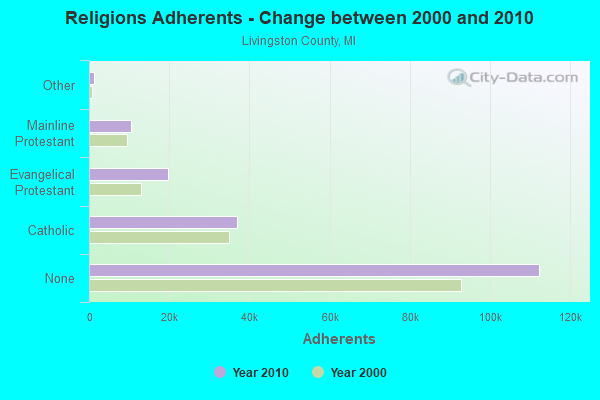
Religion statistics for Livingston County
| Religion | Adherents | Congregations |
|---|---|---|
| Catholic | 36,976 | 9 |
| Evangelical Protestant | 19,679 | 59 |
| Mainline Protestant | 10,563 | 25 |
| Other | 1,249 | 7 |
| Black Protestant | 123 | 1 |
| None | 112,377 | - |
Source: Clifford Grammich, Kirk Hadaway, Richard Houseal, Dale E.Jones, Alexei Krindatch, Richie Stanley and Richard H.Taylor. 2012. 2010 U.S.Religion Census: Religious Congregations & Membership Study. Association of Statisticians of American Religious Bodies. Jones, Dale E., et al. 2002. Congregations and Membership in the United States 2000. Nashville, TN: Glenmary Research Center.
Food Environment Statistics:
| Livingston County: | 1.37 / 10,000 pop. |
| State: | 2.34 / 10,000 pop. |
| Here: | 0.22 / 10,000 pop. |
| Michigan: | 0.18 / 10,000 pop. |
| This county: | 0.93 / 10,000 pop. |
| Michigan: | 1.52 / 10,000 pop. |
| Livingston County: | 2.03 / 10,000 pop. |
| Michigan: | 2.99 / 10,000 pop. |
| This county: | 5.47 / 10,000 pop. |
| State: | 6.80 / 10,000 pop. |
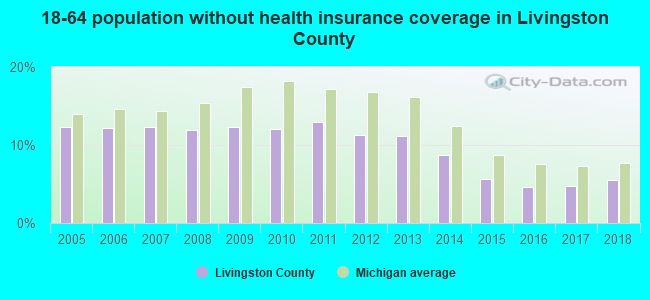
| Livingston County: | 7.9% |
| Michigan: | 9.7% |
| Livingston County: | 25.7% |
| State: | 29.7% |
| Here: | 14.3% |
| State: | 13.4% |
Agriculture in Livingston County:
Average size of farms: 110 acresAverage value of agricultural products sold per farm: $29,032
Average value of crops sold per acre for harvested cropland: $275.57
The value of nursery, greenhouse, floriculture, and sod as a percentage of the total market value of agricultural products sold: 15.49%
The value of livestock, poultry, and their products as a percentage of the total market value of agricultural products sold: 35.35%
Average total farm production expenses per farm: $35,625
Harvested cropland as a percentage of land in farms: 62.02%
Irrigated harvested cropland as a percentage of land in farms: 2.23%
Average market value of all machinery and equipment per farm: $57,430
The percentage of farms operated by a family or individual: 89.40%
Average age of principal farm operators: 54 years
Average number of cattle and calves per 100 acres of all land in farms: 8.44
Milk cows as a percentage of all cattle and calves: 31.70%
Corn for grain: 19772 harvested acres
All wheat for grain: 4857 harvested acres
Soybeans for beans: 18166 harvested acres
Vegetables: 1,622 harvested acres
Land in orchards: 133 acres
Tornado activity:
Livingston County historical area-adjusted tornado activity is significantly below Michigan state average. It is 1932647.8 times below overall U.S. average.Tornadoes in this county have caused 3 fatalities and 6 injuries recorded between 1950 and 2004.
On 10/18/2007, a category 2 (max. wind speeds 113-157 mph) tornado killed 2 people and injured one person and caused $15 million in damages.
Earthquake activity:
Livingston County-area historical earthquake activity is significantly above Michigan state average. It is 42% smaller than the overall U.S. average.On 9/25/1998 at 19:52:52, a magnitude 5.2 (4.8 MB, 4.3 MS, 5.2 LG, 4.5 MW, Depth: 3.1 mi, Class: Moderate, Intensity: VI - VII) earthquake occurred 193.4 miles away from Livingston County center
On 1/31/1986 at 16:46:43, a magnitude 5.0 (5.0 MB) earthquake occurred 154.3 miles away from the county center
On 7/12/1986 at 08:19:37, a magnitude 4.5 (4.5 MB, Class: Light, Intensity: IV - V) earthquake occurred 143.1 miles away from the county center
On 5/2/2015 at 16:23:07, a magnitude 4.2 (4.2 MW, Depth: 2.8 mi) earthquake occurred 83.0 miles away from the county center
On 7/27/1980 at 18:52:21, a magnitude 5.2 (5.1 MB, 4.7 MS, 5.0 UK, 5.2 UK) earthquake occurred 302.0 miles away from Livingston County center
On 4/18/2008 at 09:36:59, a magnitude 5.4 (5.1 MB, 4.8 MS, 5.4 MW, 5.2 MW) earthquake occurred 354.6 miles away from the county center
Magnitude types: regional Lg-wave magnitude (LG), body-wave magnitude (MB), surface-wave magnitude (MS), moment magnitude (MW)
Most recent natural disasters:
- Michigan Covid-19 Pandemic, Incident Period: January 20, 2020, FEMA Id: 4494, Natural disaster type: Other
- Michigan Hurricane Katrina Evacuation, Incident Period: August 29, 2005 to October 01, 2005, Emergency Declared EM-3225: September 07, 2005, FEMA Id: 3225, Natural disaster type: Hurricane
- Michigan Severe Storms, Tornadoes and Flooding, Incident Period: May 20, 2004 to June 08, 2004, Major Disaster (Presidential) Declared DR-1527: June 30, 2004, FEMA Id: 1527, Natural disaster type: Storm, Tornado, Flood
- Michigan Power Outage, Incident Period: August 14, 2003 to August 17, 2003, Emergency Declared EM-3189: September 23, 2003, FEMA Id: 3189, Natural disaster type: Power Outage
- Michigan Severe Winter Storm, Incident Period: December 11, 2000 to December 31, 2000, Emergency Declared EM-3160: January 10, 2001, FEMA Id: 3160, Natural disaster type: Winter Storm
- Michigan Blizzards and Snowstorms, Incident Period: January 27, 1978, Emergency Declared EM-3057: January 27, 1978, FEMA Id: 3057, Natural disaster type: Snowstorm, Blizzard
- Michigan Severe Storms, High Winds, Flooding, Incident Period: April 26, 1975, Major Disaster (Presidential) Declared DR-465: April 26, 1975, FEMA Id: 465, Natural disaster type: Storm, Flood, Wind
The number of natural disasters in Livingston County (7) is smaller than the US average (15).
Major Disasters (Presidential) Declared: 2
Emergencies Declared: 4
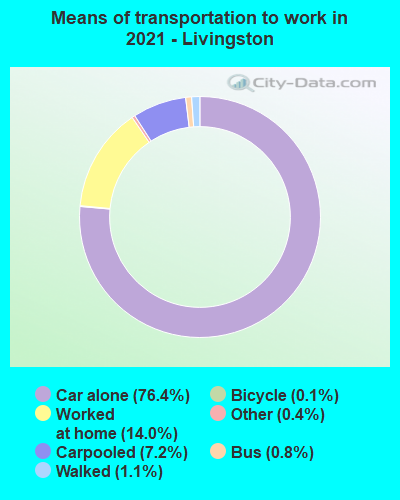
Means of transportation to work:
- Drove a car alone: 50,658 (71.1%)
- Carpooled: 4,492 (6.3%)
- Bus: 379 (0.5%)
- Taxicab, motorcycle, or other means: 393 (0.6%)
- Bicycle: 89 (0.1%)
- Walked: 868 (1.2%)
- Worked at home: 16,071 (22.6%)
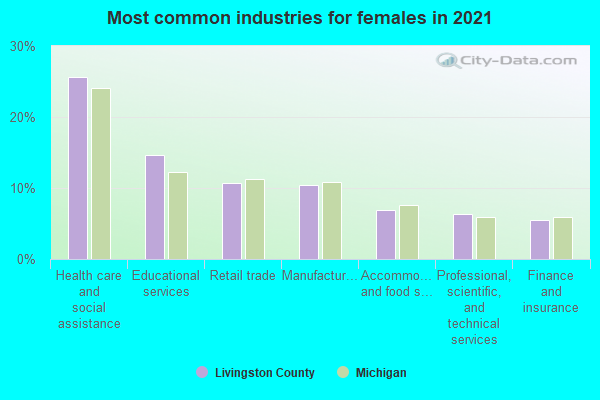
- Health care and social assistance (24%)
- Educational services (12%)
- Manufacturing (8%)
- Retail trade (7%)
- Professional, scientific, and technical services (6%)
- Finance and insurance (5%)
- Other services, except public administration (5%)
- Health care and social assistance (28%)
- Educational services (14%)
- Manufacturing (9%)
- Retail trade (9%)
- Professional, scientific, and technical services (7%)
- Finance and insurance (6%)
- Other services, except public administration (6%)
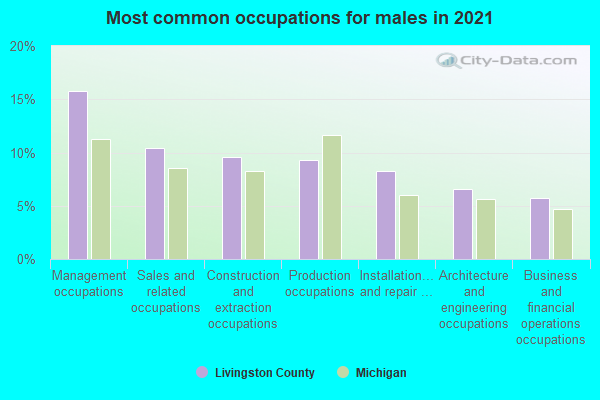
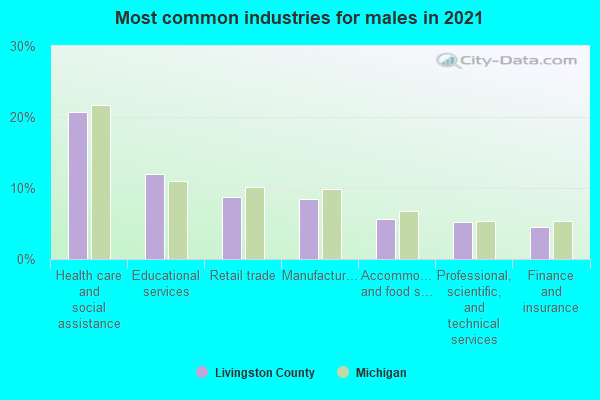
- Management occupations (19%)
- Sales and related occupations (10%)
- Construction and extraction occupations (8%)
- Production occupations (8%)
- Installation, maintenance, and repair occupations (7%)
- Architecture and engineering occupations (7%)
- Business and financial operations occupations (6%)
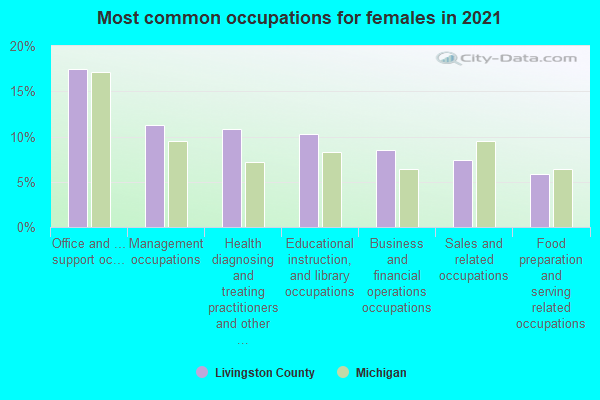
- Office and administrative support occupations (18%)
- Management occupations (13%)
- Educational instruction, and library occupations (10%)
- Health diagnosing and treating practitioners and other technical occupations (10%)
- Business and financial operations occupations (9%)
- Sales and related occupations (8%)
- Health technologists and technicians (4%)
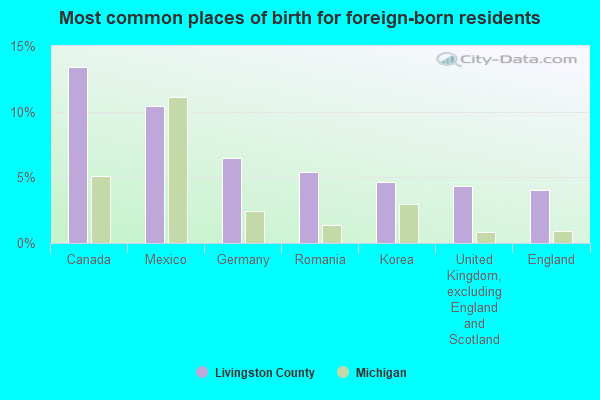
- Canada (15%)
- Mexico (8%)
- Germany (5%)
- Romania (5%)
- China, excluding Hong Kong and Taiwan (4%)
- Korea (4%)
- England (3%)
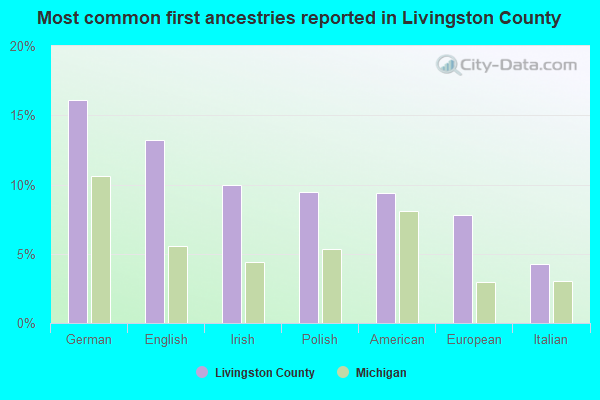
- German (16%)
- English (12%)
- Irish (11%)
- American (10%)
- Polish (9%)
- European (9%)
- Italian (5%)
People in group quarters in Livingston County, Michigan in 2010:
- 517 people in nursing facilities/skilled-nursing facilities
- 209 people in local jails and other municipal confinement facilities
- 157 people in group homes intended for adults
- 102 people in state prisons
- 100 people in residential treatment centers for adults
- 51 people in workers' group living quarters and job corps centers
- 10 people in other noninstitutional facilities
- 4 people in emergency and transitional shelters (with sleeping facilities) for people experiencing homelessness
People in group quarters in Livingston County, Michigan in 2000:
- 416 people in homes for abused, dependent, and neglected children
- 247 people in other types of correctional institutions
- 237 people in other group homes
- 212 people in nursing homes
- 166 people in local jails and other confinement facilities (including police lockups)
- 162 people in other noninstitutional group quarters
- 88 people in agriculture workers' dormitories on farms
- 63 people in homes for the mentally retarded
- 56 people in hospitals or wards for drug/alcohol abuse
- 16 people in other nonhousehold living situations
- 10 people in unknown juvenile institutions
- 5 people in religious group quarters
- 3 people in college dormitories (includes college quarters off campus)
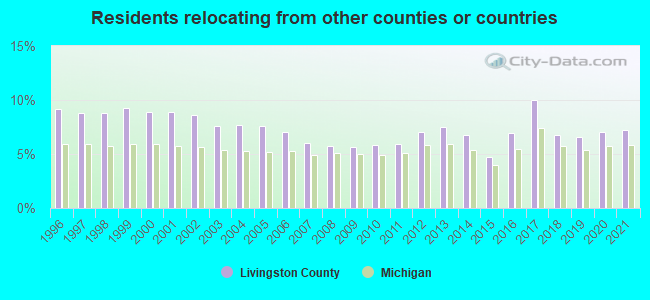
7.22% of this county's 2021 resident taxpayers lived in other counties in 2020 ($83,085 average adjusted gross income)
| Here: | 7.22% |
| Michigan average: | 5.83% |
10 or fewer of this county's residents moved from foreign countries.
5.70% relocated from other counties in Michigan ($65,050 average AGI)
1.52% relocated from other states ($18,036 average AGI)
Livingston County: 1.52% Michigan average: 1.78%
Top counties from which taxpayers relocated into this county between 2020 and 2021:
| from Oakland County, MI | |
| from Wayne County, MI | |
| from Washtenaw County, MI | |
| from Genesee County, MI | |
| from Ingham County, MI | |
| from Macomb County, MI | |
| from Shiawassee County, MI |
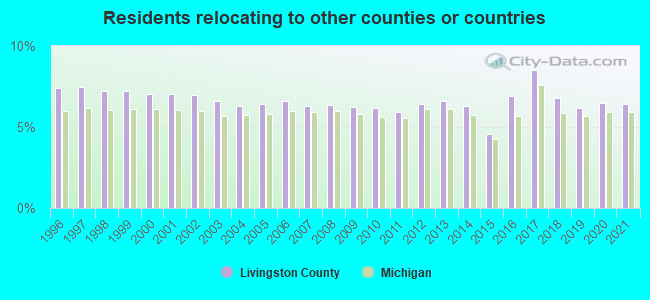
6.45% of this county's 2020 resident taxpayers moved to other counties in 2021 ($76,522 average adjusted gross income)
| Here: | 6.45% |
| Michigan average: | 5.95% |
10 or fewer of this county's residents moved to foreign countries.
4.81% relocated to other counties in Michigan ($55,584 average AGI)
1.63% relocated to other states ($20,938 average AGI)
Livingston County: 1.63% Michigan average: 1.91%
Top counties to which taxpayers relocated from this county between 2020 and 2021:
| to Oakland County, MI | |
| to Genesee County, MI | |
| to Washtenaw County, MI | |
| to Wayne County, MI | |
| to Ingham County, MI | |
| to Shiawassee County, MI | |
| to Kent County, MI |
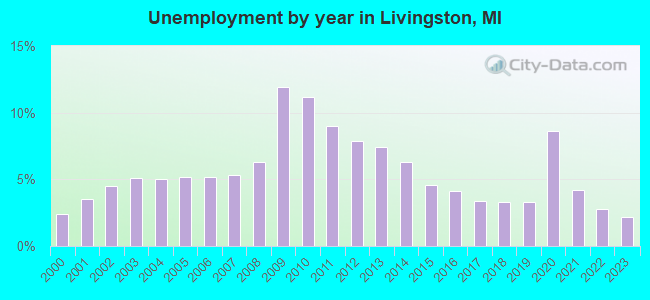
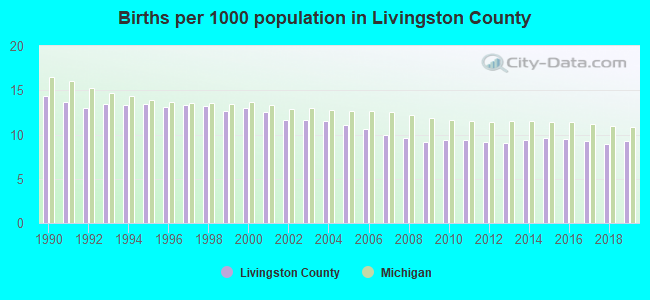
Births per 1000 population from 1990 to 1999: 13.4
Births per 1000 population from 2000 to 2009: 11.1
Births per 1000 population from 2010 to 2022: 7.8
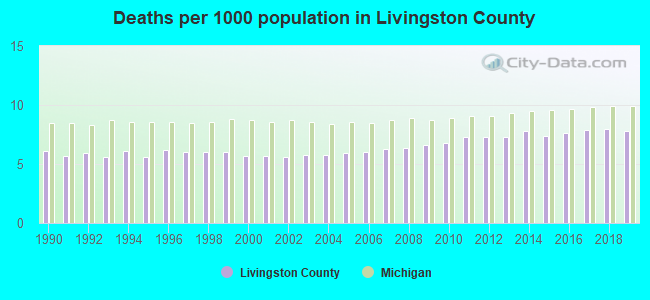
Deaths per 1000 population from 1990 to 1999: 5.9
Deaths per 1000 population from 2000 to 2009: 6.0
Deaths per 1000 population from 2010 to 2020: 7.7
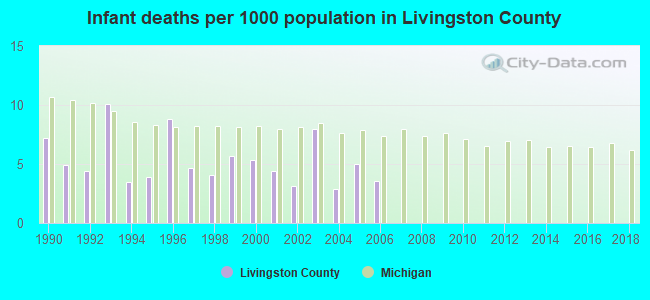
Infant deaths per 1000 live births from 1990 to 1999: 5.7
Infant deaths per 1000 live births from 2000 to 2006: 4.6
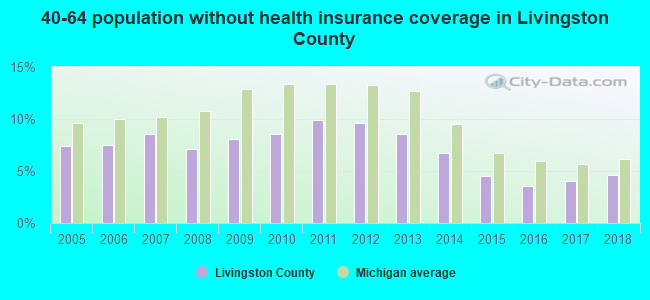
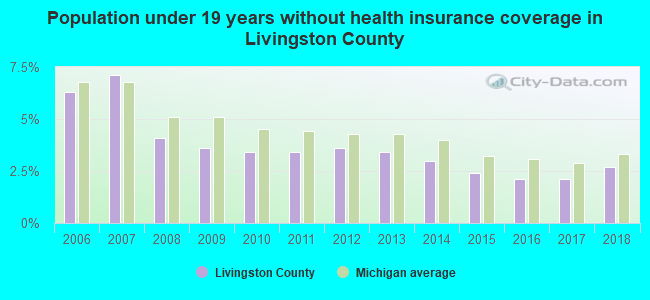
Persons under 19 years old without health insurance coverage in 2018: 2.7%
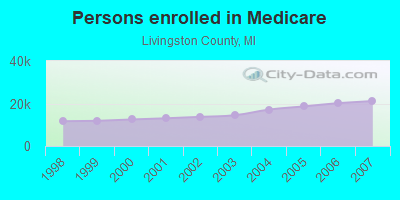
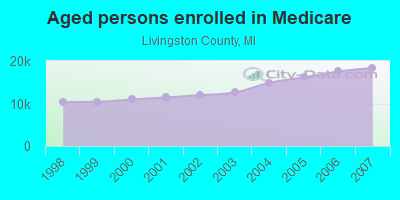
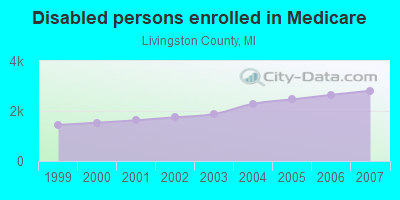
Persons enrolled in hospital insurance and/or supplemental medical insurance (Medicare) in July 1, 2007: 21,161 (18,349 aged, 2,812 disabled)
Children under 18 without health insurance coverage in 2007: 1,618 (3%)
Most common underlying causes of death in Livingston County, Michigan in 1999 - 2019:
- Atherosclerotic heart disease (2,046)
- Bronchus or lung, unspecified - Malignant neoplasms (1,648)
- Acute myocardial infarction, unspecified (1,508)
- Chronic obstructive pulmonary disease, unspecified (1,090)
- Atherosclerotic cardiovascular disease, so described (873)
- Alzheimer disease, unspecified (816)
- Unspecified dementia (746)
- Congestive heart failure (698)
- Stroke, not specified as haemorrhage or infarction (579)
- Breast, unspecified - Malignant neoplasms (462)
Population without health insurance coverage in 2000: 7%
Children under 18 without health insurance coverage in 2000: 7%
Short term general hospital admissions per 100,000 population in 2004: 1,989
Short term general hospital beds per 100,000 population in 2004: 28
Emergency room visits per 100,000 population in 2004: 18,241
General practice office based MDs per 100,000 population in 2005: 1,061
Medical specialist MDs per 100,000 population in 2005: 592
Dentists per 100,000 population in 1998: 4
Total births per 100,000 population, July 2005 - July 2006 : 49
Total deaths per 100,000 population, July 2005 - July 2006: 59
Limited-service eating places per 100,000 population in 2005 : 18
Beer, wine & liquor stores per 100,000 population in 2005: 1
Suicides per 1,000,000 population from 2000 to 2006: 104.4. This is less than state average.
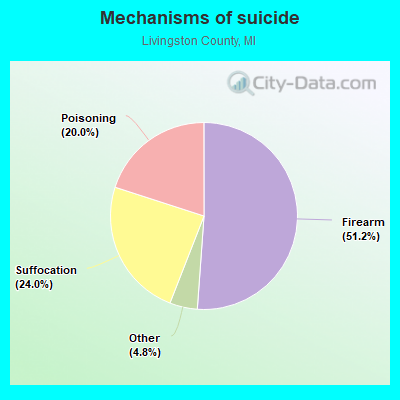
- Firearm - 53.4
- Suffocation - 25.1
- Poisoning - 20.9
- Other - 5.0
Household type by relationship:
Households: 196,161- Male householders: 39,481 (7,680 living alone), Female householders: 37,139 (7,788 living alone)
49,631 spouses (49,456 opposite-sex spouses), 3,574 unmarried partners, (3,185 opposite-sex unmarried partners), 55,608 children (52,575 natural, 837 adopted, 2,196 stepchildren), 2,306 grandchildren, 1,539 brothers or sisters, 1,780 parents, 0 foster children, 1,485 other relatives, 2,180 non-relatives
- In group quarters: 1,438
Size of family households: 28,437 2-persons, 11,983 3-persons, 9,893 4-persons, 5,281 5-persons, 1,536 6-persons, 711 7-or-more-persons.
Size of nonfamily households: 15,468 1-person, 2,857 2-persons, 320 3-persons, 50 4-persons, 30 5-persons, 54 6-persons.
31,382 married couples with children.
4,968 single-parent households (1,289 men, 3,679 women).
96.5% of residents of Livingston speak English at home.
1.0% of residents speak Spanish at home (75% speak English very well, 15% speak English well, 9% speak English not well, 1% don't speak English at all).
1.3% of residents speak other Indo-European language at home (84% speak English very well, 10% speak English well, 6% speak English not well).
0.5% of residents speak Asian or Pacific Island language at home (58% speak English very well, 27% speak English well, 13% speak English not well, 2% don't speak English at all).
0.4% of residents speak other language at home (73% speak English very well, 20% speak English well, 8% speak English not well).
In fiscal year 2004:
Federal Government expenditure: $437,957,000 ($2,467 per capita)
Department of Defense expenditure: $28,671,000
Federal direct payments to individuals for retirement and disability: $242,497,000
Federal other direct payments to individuals: $88,155,000
Federal direct payments not to individuals: $2,413,000
Federal grants: $57,422,000
Federal procurement contracts: $22,537,000 ($17,874,000 Department of Defense)
Federal salaries and wages: $24,934,000 ($5,956,000 Department of Defense)
Federal Government direct loans: $2,635,000
Federal guaranteed/insured loans: $74,951,000
Federal Government insurance: $64,206,000
Population change from April 1, 2000 to July 1, 2005:
Births: 10,453| Here: | 58 per 1000 residents |
| State: | 68 per 1000 residents |
Deaths: 5,103
| Here: | 28 per 1000 residents |
| State: | 45 per 1000 residents |
Net international migration: +853
| Here: | +5 per 1000 residents |
| State: | +12 per 1000 residents |
Net internal migration: +18,668
| Here: | |
| State: |
Total withdrawal of fresh water for public supply: 5.82 millions of gallons per day (all from ground)
| Here: | 7.1 |
| State: | 6.5 |
| Here: | 4.1 |
| State: | 4.3 |
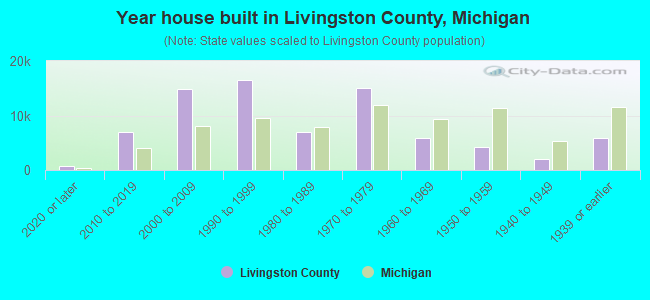
- Year house built in Livingston County, Michigan
- 1,1662020 or later
- 8,5142010 to 2019
- 15,0012000 to 2009
- 18,8171990 to 1999
- 8,5721980 to 1989
- 14,0961970 to 1979
- 4,1501960 to 1969
- 3,8851950 to 1959
- 1,6221940 to 1949
- 4,3491939 or earlier
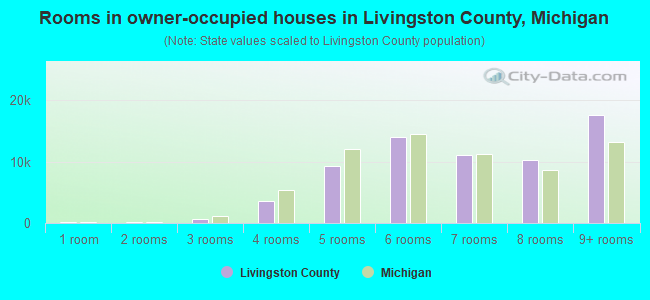
- Rooms in owner-occupied houses in Livingston County, Michigan
- 881 room
- 452 rooms
- 5093 rooms
- 3,9864 rooms
- 10,0855 rooms
- 12,4246 rooms
- 11,6557 rooms
- 10,0878 rooms
- 18,7029+ rooms
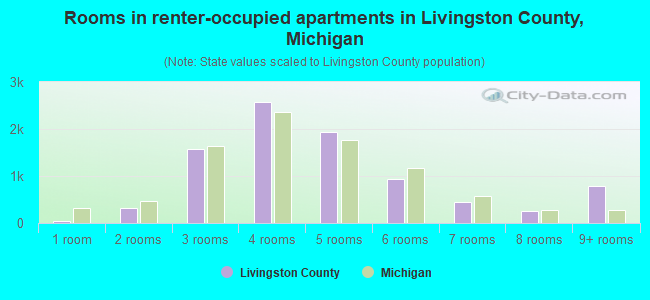
- Rooms in renter-occupied apartments in Livingston County, Michigan
- 3561 room
- 5842 rooms
- 2,2393 rooms
- 2,3524 rooms
- 1,6435 rooms
- 9856 rooms
- 4177 rooms
- 698 rooms
- 3949+ rooms
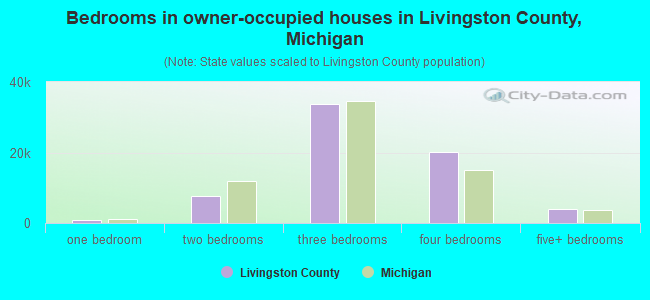
- Bedrooms in owner-occupied houses in Livingston County, Michigan
- 88no bedroom
- 5221 bedroom
- 8,3602 bedrooms
- 32,4133 bedrooms
- 21,4714 bedrooms
- 4,7275+ bedrooms
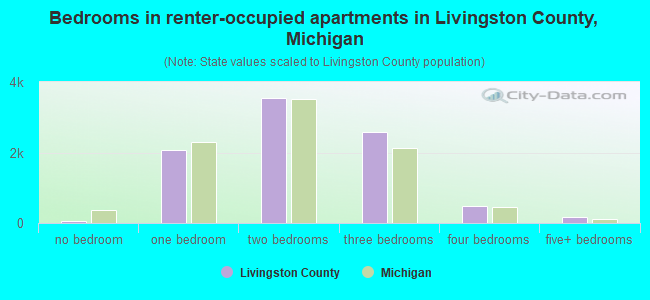
- Bedrooms in renter-occupied apartments in Livingston County, Michigan
- 430no bedroom
- 2,4591 bedroom
- 4,0872 bedrooms
- 1,6043 bedrooms
- 3124 bedrooms
- 1475+ bedrooms
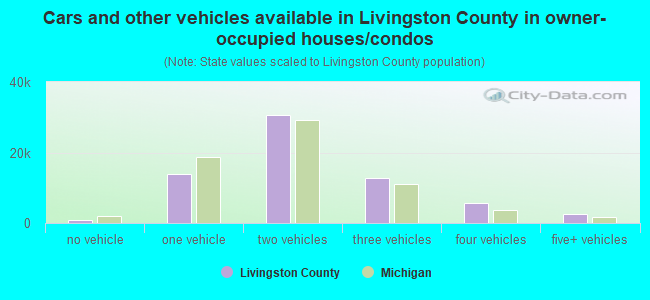
- Cars and other vehicles available in Livingston County in owner-occupied houses/condos
- 1,369no vehicle
- 13,6691 vehicle
- 30,3892 vehicles
- 14,6873 vehicles
- 4,9094 vehicles
- 2,5585+ vehicles
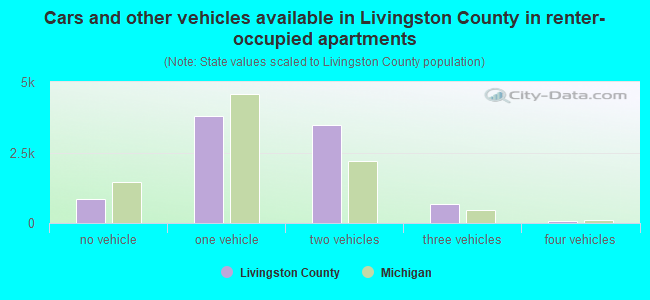
- Cars and other vehicles available in Livingston County in renter-occupied apartments
- 1,120no vehicle
- 4,5321 vehicle
- 2,7032 vehicles
- 3303 vehicles
- 1704 vehicles
- 1845+ vehicles
91.7% of Livingston County residents lived in the same house 1 years ago.
Out of people who lived in different houses, 27% lived in this county.
Out of people who lived in different counties, 71% lived in Michigan.
| Livingston County: | 91.7% |
| State average: | 88.4% |
Place of birth for U.S.-born residents:
- This state: 158,643
- Other state: 30,022
- Northeast: 5,488
- Midwest: 12,013
- South: 6,886
- West: 5,635
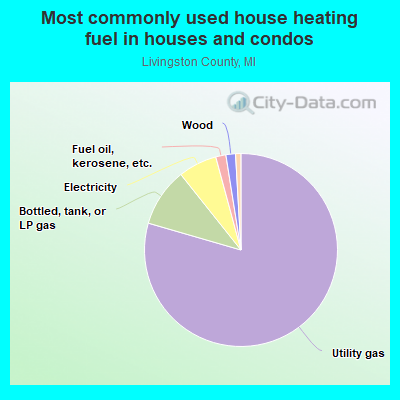
- 78.2%Utility gas
- 9.7%Bottled, tank, or LP gas
- 8.3%Electricity
- 1.8%Wood
- 0.9%Other fuel
- 0.9%Fuel oil, kerosene, etc.
- 0.2%No fuel used
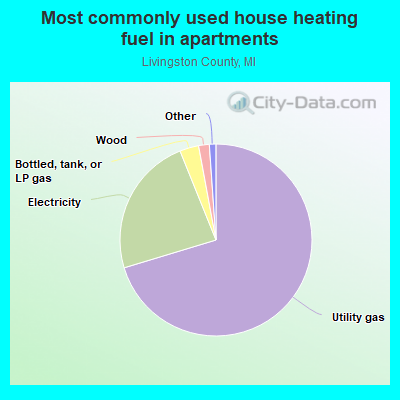
- 63.7%Utility gas
- 26.7%Electricity
- 6.9%Bottled, tank, or LP gas
- 1.0%Other fuel
- 0.8%Fuel oil, kerosene, etc.
- 0.8%No fuel used
Private vs. public school enrollment:
| Here: | 7.9% |
| Michigan: | 12.4% |
| Here: | 4.6% |
| Michigan: | 9.8% |
| Here: | 13.6% |
| Michigan: | 14.9% |
Livingston County government finances - Expenditure in 2020:
- Charges - Other: $30,889,000
Other: $30,703,000
Air Transportation: $1,483,000
Air Transportation: $1,322,000
- Current Operations - Judicial and Legal Services: $16,520,000
Health - Other: $15,669,000
Health - Other: $15,454,000
Regular Highways: $14,654,000
Regular Highways: $13,566,000
Correctional Institutions: $10,824,000
General - Other: $10,692,000
Judicial and Legal Services: $10,312,000
General - Other: $9,823,000
Correctional Institutions: $9,715,000
Police Protection: $9,063,000
Police Protection: $8,290,000
Central Staff Services: $4,356,000
Transit Utilities: $4,125,000
Central Staff Services: $4,087,000
Public Welfare - Other: $3,676,000
Water Utilities: $3,591,000
Water Utilities: $3,551,000
Protective Inspection and Regulation - Other: $3,117,000
Transit Utilities: $2,911,000
Public Welfare - Other: $2,663,000
Protective Inspection and Regulation - Other: $2,543,000
Financial Administration: $2,094,000
Financial Administration: $1,488,000
Air Transportation: $1,226,000
Air Transportation: $1,090,000
Housing and Community Development: $78,000
Parks and Recreation: $20,000
- Federal Intergovernmental - Other: $6,799,000
Other: $5,031,000
Transit Utilities: $2,056,000
Transit Utilities: $1,537,000
Health and Hospitals: $1,448,000
Health and Hospitals: $965,000
- General - Interest on Debt: $1,627,000
Interest on Debt: $793,000
- Local Intergovernmental - Highways: $9,287,000
Highways: $6,395,000
Other: $4,441,000
Other: $2,012,000
- Long Term Debt - Beginning Outstanding - Unspecified Public Purpose: $61,457,000
Outstanding Unspecified Public Purpose: $55,883,000
Outstanding Unspecified Public Purpose: $27,619,000
Beginning Outstanding - Unspecified Public Purpose: $21,343,000
Issue, Unspecified Public Purpose: $18,456,000
Retired Unspecified Public Purpose: $12,180,000
Retired Unspecified Public Purpose: $5,799,000
Issue, Unspecified Public Purpose: $225,000
- Miscellaneous - General Revenue - Other: $5,057,000
Interest Earnings: $3,164,000
Rents: $2,520,000
Rents: $2,054,000
General Revenue - Other: $1,808,000
Fines and Forfeits: $1,710,000
Interest Earnings: $1,258,000
Fines and Forfeits: $1,246,000
Sale of Property: $267,000
Sale of Property: $248,000
Donations From Private Sources: $120,000
- Other Capital Outlay - Police Protection: $4,212,000
Solid Waste Management: $961,000
General - Other: $850,000
Correctional Institutions: $750,000
Health - Other: $485,000
General - Other: $263,000
Regular Highways: $204,000
Correctional Institutions: $13,000
Health - Other: $13,000
- Other Funds - Cash and Securities: $129,549,000
Cash and Securities: $117,084,000
- Revenue - Water Utilities: $3,521,000
Water Utilities: $3,345,000
Transit Utilities: $365,000
Transit Utilities: $342,000
- State Intergovernmental - Highways: $23,148,000
Highways: $19,495,000
Other: $6,881,000
Other: $6,393,000
General Local Government Support: $3,214,000
General Local Government Support: $3,154,000
Health and Hospitals: $2,338,000
Transit Utilities: $1,470,000
Transit Utilities: $1,256,000
Health and Hospitals: $784,000
- Tax - Property: $34,277,000
Property: $31,700,000
Occupation and Business License - Other: $1,299,000
Occupation and Business License - Other: $753,000
Other License: $129,000
Other License: $114,000
Other Selective Sales: $25,000
Other Selective Sales: $22,000
- Total Salaries and Wages: $59,378,000
: $38,390,000
Livingston County government finances - Revenue in 2020:
- Charges - Other: $30,889,000
Other: $30,703,000
Air Transportation: $1,483,000
Air Transportation: $1,322,000
- Current Operations - Judicial and Legal Services: $16,520,000
Health - Other: $15,669,000
Health - Other: $15,454,000
Regular Highways: $14,654,000
Regular Highways: $13,566,000
Correctional Institutions: $10,824,000
General - Other: $10,692,000
Judicial and Legal Services: $10,312,000
General - Other: $9,823,000
Correctional Institutions: $9,715,000
Police Protection: $9,063,000
Police Protection: $8,290,000
Central Staff Services: $4,356,000
Transit Utilities: $4,125,000
Central Staff Services: $4,087,000
Public Welfare - Other: $3,676,000
Water Utilities: $3,591,000
Water Utilities: $3,551,000
Protective Inspection and Regulation - Other: $3,117,000
Transit Utilities: $2,911,000
Public Welfare - Other: $2,663,000
Protective Inspection and Regulation - Other: $2,543,000
Financial Administration: $2,094,000
Financial Administration: $1,488,000
Air Transportation: $1,226,000
Air Transportation: $1,090,000
Housing and Community Development: $78,000
Parks and Recreation: $20,000
- Federal Intergovernmental - Other: $6,799,000
Other: $5,031,000
Transit Utilities: $2,056,000
Transit Utilities: $1,537,000
Health and Hospitals: $1,448,000
Health and Hospitals: $965,000
- General - Interest on Debt: $1,627,000
Interest on Debt: $793,000
- Local Intergovernmental - Highways: $9,287,000
Highways: $6,395,000
Other: $4,441,000
Other: $2,012,000
- Long Term Debt - Beginning Outstanding - Unspecified Public Purpose: $61,457,000
Outstanding Unspecified Public Purpose: $55,883,000
Outstanding Unspecified Public Purpose: $27,619,000
Beginning Outstanding - Unspecified Public Purpose: $21,343,000
Issue, Unspecified Public Purpose: $18,456,000
Retired Unspecified Public Purpose: $12,180,000
Retired Unspecified Public Purpose: $5,799,000
Issue, Unspecified Public Purpose: $225,000
- Miscellaneous - General Revenue - Other: $5,057,000
Interest Earnings: $3,164,000
Rents: $2,520,000
Rents: $2,054,000
General Revenue - Other: $1,808,000
Fines and Forfeits: $1,710,000
Interest Earnings: $1,258,000
Fines and Forfeits: $1,246,000
Sale of Property: $267,000
Sale of Property: $248,000
Donations From Private Sources: $120,000
- Other Capital Outlay - Police Protection: $4,212,000
Solid Waste Management: $961,000
General - Other: $850,000
Correctional Institutions: $750,000
Health - Other: $485,000
General - Other: $263,000
Regular Highways: $204,000
Correctional Institutions: $13,000
Health - Other: $13,000
- Other Funds - Cash and Securities: $129,549,000
Cash and Securities: $117,084,000
- Revenue - Water Utilities: $3,521,000
Water Utilities: $3,345,000
Transit Utilities: $365,000
Transit Utilities: $342,000
- State Intergovernmental - Highways: $23,148,000
Highways: $19,495,000
Other: $6,881,000
Other: $6,393,000
General Local Government Support: $3,214,000
General Local Government Support: $3,154,000
Health and Hospitals: $2,338,000
Transit Utilities: $1,470,000
Transit Utilities: $1,256,000
Health and Hospitals: $784,000
- Tax - Property: $34,277,000
Property: $31,700,000
Occupation and Business License - Other: $1,299,000
Occupation and Business License - Other: $753,000
Other License: $129,000
Other License: $114,000
Other Selective Sales: $25,000
Other Selective Sales: $22,000
- Total Salaries and Wages: $59,378,000
: $38,390,000
Livingston County government finances - Debt in 2020:
- Charges - Other: $30,889,000
Other: $30,703,000
Air Transportation: $1,483,000
Air Transportation: $1,322,000
- Current Operations - Judicial and Legal Services: $16,520,000
Health - Other: $15,669,000
Health - Other: $15,454,000
Regular Highways: $14,654,000
Regular Highways: $13,566,000
Correctional Institutions: $10,824,000
General - Other: $10,692,000
Judicial and Legal Services: $10,312,000
General - Other: $9,823,000
Correctional Institutions: $9,715,000
Police Protection: $9,063,000
Police Protection: $8,290,000
Central Staff Services: $4,356,000
Transit Utilities: $4,125,000
Central Staff Services: $4,087,000
Public Welfare - Other: $3,676,000
Water Utilities: $3,591,000
Water Utilities: $3,551,000
Protective Inspection and Regulation - Other: $3,117,000
Transit Utilities: $2,911,000
Public Welfare - Other: $2,663,000
Protective Inspection and Regulation - Other: $2,543,000
Financial Administration: $2,094,000
Financial Administration: $1,488,000
Air Transportation: $1,226,000
Air Transportation: $1,090,000
Housing and Community Development: $78,000
Parks and Recreation: $20,000
- Federal Intergovernmental - Other: $6,799,000
Other: $5,031,000
Transit Utilities: $2,056,000
Transit Utilities: $1,537,000
Health and Hospitals: $1,448,000
Health and Hospitals: $965,000
- General - Interest on Debt: $1,627,000
Interest on Debt: $793,000
- Local Intergovernmental - Highways: $9,287,000
Highways: $6,395,000
Other: $4,441,000
Other: $2,012,000
- Long Term Debt - Beginning Outstanding - Unspecified Public Purpose: $61,457,000
Outstanding Unspecified Public Purpose: $55,883,000
Outstanding Unspecified Public Purpose: $27,619,000
Beginning Outstanding - Unspecified Public Purpose: $21,343,000
Issue, Unspecified Public Purpose: $18,456,000
Retired Unspecified Public Purpose: $12,180,000
Retired Unspecified Public Purpose: $5,799,000
Issue, Unspecified Public Purpose: $225,000
- Miscellaneous - General Revenue - Other: $5,057,000
Interest Earnings: $3,164,000
Rents: $2,520,000
Rents: $2,054,000
General Revenue - Other: $1,808,000
Fines and Forfeits: $1,710,000
Interest Earnings: $1,258,000
Fines and Forfeits: $1,246,000
Sale of Property: $267,000
Sale of Property: $248,000
Donations From Private Sources: $120,000
- Other Capital Outlay - Police Protection: $4,212,000
Solid Waste Management: $961,000
General - Other: $850,000
Correctional Institutions: $750,000
Health - Other: $485,000
General - Other: $263,000
Regular Highways: $204,000
Correctional Institutions: $13,000
Health - Other: $13,000
- Other Funds - Cash and Securities: $129,549,000
Cash and Securities: $117,084,000
- Revenue - Water Utilities: $3,521,000
Water Utilities: $3,345,000
Transit Utilities: $365,000
Transit Utilities: $342,000
- State Intergovernmental - Highways: $23,148,000
Highways: $19,495,000
Other: $6,881,000
Other: $6,393,000
General Local Government Support: $3,214,000
General Local Government Support: $3,154,000
Health and Hospitals: $2,338,000
Transit Utilities: $1,470,000
Transit Utilities: $1,256,000
Health and Hospitals: $784,000
- Tax - Property: $34,277,000
Property: $31,700,000
Occupation and Business License - Other: $1,299,000
Occupation and Business License - Other: $753,000
Other License: $129,000
Other License: $114,000
Other Selective Sales: $25,000
Other Selective Sales: $22,000
- Total Salaries and Wages: $59,378,000
: $38,390,000
Livingston County government finances - Cash and Securities in 2020:
- Charges - Other: $30,889,000
Other: $30,703,000
Air Transportation: $1,483,000
Air Transportation: $1,322,000
- Current Operations - Judicial and Legal Services: $16,520,000
Health - Other: $15,669,000
Health - Other: $15,454,000
Regular Highways: $14,654,000
Regular Highways: $13,566,000
Correctional Institutions: $10,824,000
General - Other: $10,692,000
Judicial and Legal Services: $10,312,000
General - Other: $9,823,000
Correctional Institutions: $9,715,000
Police Protection: $9,063,000
Police Protection: $8,290,000
Central Staff Services: $4,356,000
Transit Utilities: $4,125,000
Central Staff Services: $4,087,000
Public Welfare - Other: $3,676,000
Water Utilities: $3,591,000
Water Utilities: $3,551,000
Protective Inspection and Regulation - Other: $3,117,000
Transit Utilities: $2,911,000
Public Welfare - Other: $2,663,000
Protective Inspection and Regulation - Other: $2,543,000
Financial Administration: $2,094,000
Financial Administration: $1,488,000
Air Transportation: $1,226,000
Air Transportation: $1,090,000
Housing and Community Development: $78,000
Parks and Recreation: $20,000
- Federal Intergovernmental - Other: $6,799,000
Other: $5,031,000
Transit Utilities: $2,056,000
Transit Utilities: $1,537,000
Health and Hospitals: $1,448,000
Health and Hospitals: $965,000
- General - Interest on Debt: $1,627,000
Interest on Debt: $793,000
- Local Intergovernmental - Highways: $9,287,000
Highways: $6,395,000
Other: $4,441,000
Other: $2,012,000
- Long Term Debt - Beginning Outstanding - Unspecified Public Purpose: $61,457,000
Outstanding Unspecified Public Purpose: $55,883,000
Outstanding Unspecified Public Purpose: $27,619,000
Beginning Outstanding - Unspecified Public Purpose: $21,343,000
Issue, Unspecified Public Purpose: $18,456,000
Retired Unspecified Public Purpose: $12,180,000
Retired Unspecified Public Purpose: $5,799,000
Issue, Unspecified Public Purpose: $225,000
- Miscellaneous - General Revenue - Other: $5,057,000
Interest Earnings: $3,164,000
Rents: $2,520,000
Rents: $2,054,000
General Revenue - Other: $1,808,000
Fines and Forfeits: $1,710,000
Interest Earnings: $1,258,000
Fines and Forfeits: $1,246,000
Sale of Property: $267,000
Sale of Property: $248,000
Donations From Private Sources: $120,000
- Other Capital Outlay - Police Protection: $4,212,000
Solid Waste Management: $961,000
General - Other: $850,000
Correctional Institutions: $750,000
Health - Other: $485,000
General - Other: $263,000
Regular Highways: $204,000
Correctional Institutions: $13,000
Health - Other: $13,000
- Other Funds - Cash and Securities: $129,549,000
Cash and Securities: $117,084,000
- Revenue - Water Utilities: $3,521,000
Water Utilities: $3,345,000
Transit Utilities: $365,000
Transit Utilities: $342,000
- State Intergovernmental - Highways: $23,148,000
Highways: $19,495,000
Other: $6,881,000
Other: $6,393,000
General Local Government Support: $3,214,000
General Local Government Support: $3,154,000
Health and Hospitals: $2,338,000
Transit Utilities: $1,470,000
Transit Utilities: $1,256,000
Health and Hospitals: $784,000
- Tax - Property: $34,277,000
Property: $31,700,000
Occupation and Business License - Other: $1,299,000
Occupation and Business License - Other: $753,000
Other License: $129,000
Other License: $114,000
Other Selective Sales: $25,000
Other Selective Sales: $22,000
- Total Salaries and Wages: $59,378,000
: $38,390,000
Supplemental Security Income (SSI) in 2006:
- Total number of recipients: 845
- Number of aged recipients: 45
- Number of blind and disabled recipients: 800
- Number of recipients under 18: 148
- Number of recipients between 18 and 64: 601
- Number of recipients older than 64: 96
- Number of recipients also receiving OASDI: 261
- Amount of payments (thousands of dollars): 394
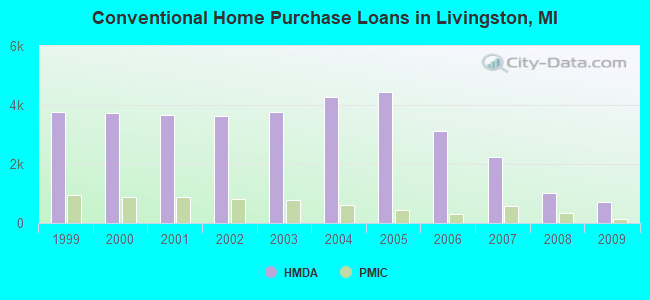
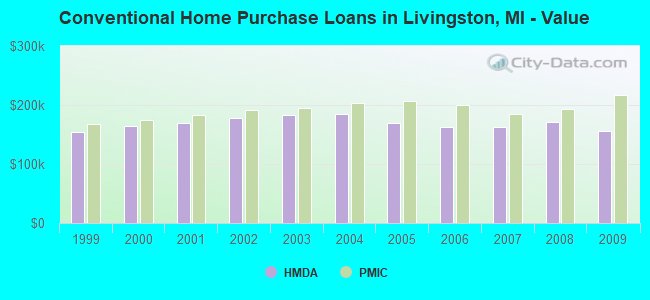
| Home Mortgage Disclosure Act Aggregated Statistics For Year 2009 (Based on 52 full tracts) | ||||||||||||||
| A) FHA, FSA/RHS & VA Home Purchase Loans | B) Conventional Home Purchase Loans | C) Refinancings | D) Home Improvement Loans | E) Loans on Dwellings For 5+ Families | F) Non-occupant Loans on < 5 Family Dwellings (A B C & D) | G) Loans On Manufactured Home Dwelling (A B C & D) | ||||||||
|---|---|---|---|---|---|---|---|---|---|---|---|---|---|---|
| Number | Average Value | Number | Average Value | Number | Average Value | Number | Average Value | Number | Average Value | Number | Average Value | Number | Average Value | |
| LOANS ORIGINATED | 768 | $142,503 | 728 | $155,548 | 3,536 | $181,679 | 105 | $72,067 | 3 | $791,667 | 239 | $151,385 | 47 | $66,553 |
| APPLICATIONS APPROVED, NOT ACCEPTED | 55 | $144,782 | 69 | $147,812 | 452 | $194,498 | 20 | $49,700 | 2 | $399,000 | 26 | $169,885 | 13 | $34,308 |
| APPLICATIONS DENIED | 221 | $134,914 | 125 | $140,952 | 1,496 | $202,350 | 104 | $50,452 | 1 | $9,450,000 | 65 | $153,031 | 36 | $55,250 |
| APPLICATIONS WITHDRAWN | 172 | $128,901 | 72 | $149,972 | 717 | $193,597 | 23 | $54,304 | 0 | $0 | 31 | $114,032 | 2 | $72,500 |
| FILES CLOSED FOR INCOMPLETENESS | 18 | $156,611 | 18 | $159,333 | 227 | $188,683 | 7 | $112,286 | 0 | $0 | 11 | $140,636 | 8 | $37,250 |
| Private Mortgage Insurance Companies Aggregated Statistics For Year 2009 (Based on 51 full tracts) | ||||||
| A) Conventional Home Purchase Loans | B) Refinancings | C) Non-occupant Loans on < 5 Family Dwellings (A & B) | ||||
|---|---|---|---|---|---|---|
| Number | Average Value | Number | Average Value | Number | Average Value | |
| LOANS ORIGINATED | 119 | $217,151 | 97 | $211,381 | 8 | $186,125 |
| APPLICATIONS APPROVED, NOT ACCEPTED | 47 | $189,298 | 41 | $227,659 | 2 | $177,000 |
| APPLICATIONS DENIED | 35 | $219,029 | 38 | $251,000 | 2 | $291,000 |
| APPLICATIONS WITHDRAWN | 15 | $256,467 | 12 | $252,500 | 1 | $333,000 |
| FILES CLOSED FOR INCOMPLETENESS | 7 | $136,714 | 3 | $188,333 | 3 | $134,000 |
| Most common first names in Livingston County, MI among deceased individuals | ||
| Name | Count | Lived (average) |
|---|---|---|
| John | 480 | 75.0 years |
| William | 477 | 73.9 years |
| Mary | 471 | 80.2 years |
| Robert | 429 | 70.5 years |
| James | 344 | 70.2 years |
| Helen | 319 | 82.7 years |
| George | 283 | 76.5 years |
| Charles | 266 | 75.1 years |
| Margaret | 240 | 80.1 years |
| Dorothy | 225 | 79.5 years |
| Most common last names in Livingston County, MI among deceased individuals | ||
| Last name | Count | Lived (average) |
|---|---|---|
| Smith | 231 | 75.9 years |
| Miller | 107 | 76.5 years |
| Johnson | 96 | 74.9 years |
| Brown | 88 | 76.4 years |
| Davis | 80 | 76.3 years |
| Williams | 78 | 75.6 years |
| Clark | 65 | 78.2 years |
| Campbell | 63 | 77.4 years |
| Martin | 59 | 78.0 years |
| White | 58 | 75.1 years |
| Businesses in Livingston County, MI | ||||
| Name | Count | Name | Count | |
|---|---|---|---|---|
| 7-Eleven | 3 | Kmart | 1 | |
| ALDI | 1 | Kohl's | 2 | |
| AT&T | 2 | Kroger | 4 | |
| Ace Hardware | 2 | La-Z-Boy | 1 | |
| Advance Auto Parts | 1 | Lane Bryant | 2 | |
| Aeropostale | 2 | Lane Furniture | 2 | |
| American Eagle Outfitters | 1 | Little Caesars Pizza | 3 | |
| Ann Taylor | 3 | Lowe's | 1 | |
| Applebee's | 1 | Marshalls | 1 | |
| Arby's | 2 | MasterBrand Cabinets | 7 | |
| AutoZone | 3 | Maurices | 1 | |
| Banana Republic | 1 | Mazda | 1 | |
| Barnes & Noble | 1 | McDonald's | 9 | |
| Baskin-Robbins | 2 | Meijer | 2 | |
| Bath & Body Works | 2 | Men's Wearhouse | 1 | |
| Baymont Inn | 1 | Motherhood Maternity | 1 | |
| Bed Bath & Beyond | 1 | New Balance | 1 | |
| Best Western | 2 | Nike | 7 | |
| Blockbuster | 3 | Old Navy | 2 | |
| Buffalo Wild Wings | 2 | Olive Garden | 1 | |
| Burger King | 3 | Outback | 1 | |
| CVS | 5 | Outback Steakhouse | 1 | |
| Carson Pirie Scott | 1 | Pac Sun | 2 | |
| Casual Male XL | 1 | Panera Bread | 2 | |
| Chevrolet | 2 | Papa John's Pizza | 1 | |
| Chico's | 1 | Payless | 2 | |
| Circle K | 1 | Penske | 2 | |
| Cold Stone Creamery | 1 | PetSmart | 1 | |
| Coldwater Creek | 1 | Pier 1 Imports | 2 | |
| Costco | 1 | Pizza Hut | 2 | |
| Cracker Barrel | 1 | RadioShack | 2 | |
| Curves | 3 | Red Robin | 1 | |
| Dairy Queen | 2 | Rite Aid | 3 | |
| Deb | 1 | Rue21 | 1 | |
| Decora Cabinetry | 2 | SAS Shoes | 1 | |
| Discount Tire | 2 | Sears | 2 | |
| DressBarn | 2 | Sephora | 1 | |
| Dressbarn | 2 | Skechers USA | 1 | |
| Dunkin Donuts | 3 | Sprint Nextel | 6 | |
| Eddie Bauer | 1 | Staples | 2 | |
| Famous Footwear | 1 | Starbucks | 5 | |
| FedEx | 20 | Subway | 10 | |
| Ford | 3 | T-Mobile | 6 | |
| GNC | 4 | T.G.I. Driday's | 1 | |
| GameStop | 1 | T.J.Maxx | 1 | |
| Gap | 1 | Taco Bell | 3 | |
| Gymboree | 1 | Target | 2 | |
| H&R Block | 4 | The Room Place | 1 | |
| Hilton | 1 | Tim Hortons | 1 | |
| Holiday Inn | 2 | Toys"R"Us | 1 | |
| Home Depot | 2 | True Value | 3 | |
| Honda | 1 | U-Haul | 6 | |
| IHOP | 1 | UPS | 28 | |
| J. Jill | 1 | Vans | 2 | |
| JCPenney | 1 | Verizon Wireless | 2 | |
| Jimmy John's | 1 | Victoria's Secret | 1 | |
| JoS. A. Bank | 1 | Walgreens | 3 | |
| Jones New York | 4 | Walmart | 2 | |
| Journeys | 2 | Wendy's | 6 | |
| Justice | 2 | White Castle | 1 | |
| KFC | 2 | YMCA | 1 | |
Livingston County on our top lists:
- #4 on the list of "Top 101 counties with the largest increase in the number of deaths per 1000 residents 2000-2006 to 2007-2013 (pop. 50,000+)"
- #15 on the list of "Top 101 counties with the largest decrease in the number of births per 1000 residents 2000-2006 to 2007-2013 (pop 50,000+)"
- #21 on the list of "Top 101 counties with the lowest number of births per 1000 residents 2007-2013"
- #21 on the list of "Top 101 counties with the lowest number of births per 1000 residents 2007-2013 (pop 50,000+)"
- #38 on the list of "Top 101 counties with the largest number of children under 18 without health insurance coverage in 2000 (pop. 50,000+)"
- #39 on the list of "Top 101 counties with the lowest percentage of residents relocating from foreign countries between 2010 and 2011 (pop. 50,000+)"
- #43 on the list of "Top 101 counties with the lowest percentage of residents relocating from foreign countries between 2010 and 2011"