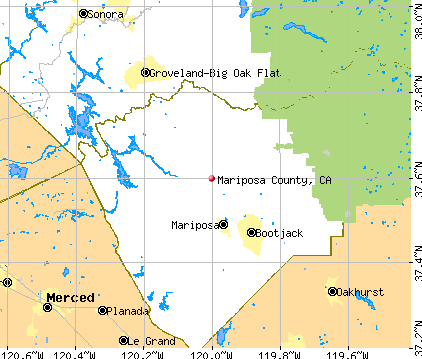
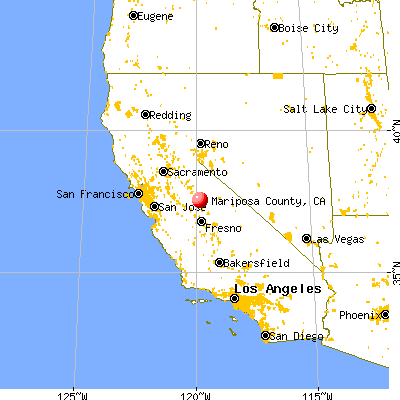
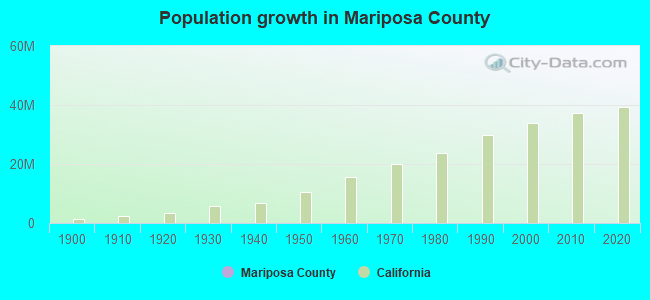
Mariposa County, California (CA)
County owner-occupied free and clear houses and condos in 2010: 2,274
County owner-occupied houses and condos in 2000: 4,623
Renter-occupied apartments: 2,466 (it was 1,990 in 2000)
| % of renters here: | 30% |
| State: | 44% |
Land area: 1451 sq. mi.
Water area: 11.7 sq. mi.
Population density: 12 people per square mile (low).
Industries providing employment: Arts, entertainment, recreation, accommodation and food services (19.9%), Educational, health and social services (18.7%), Public administration (12.1%).
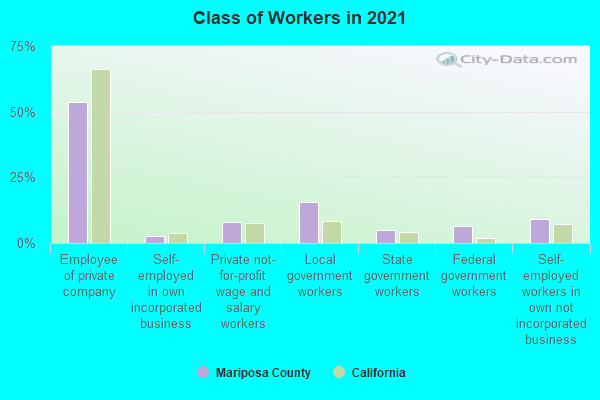
Type of workers:
- Private wage or salary: 60%
- Government: 30%
- Self-employed, not incorporated: 10%
- Unpaid family work: 0%
- OSM Map
- General Map
- Google Map
- MSN Map

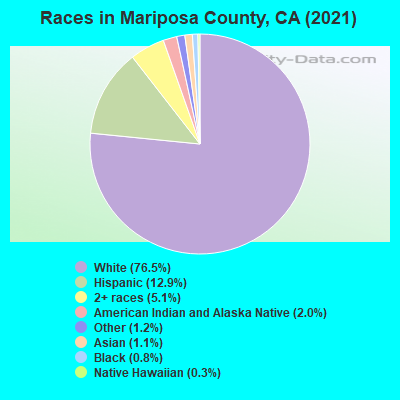
- 12,57575.7%White Non-Hispanic Alone
- 2,23913.5%Hispanic or Latino
- 9505.7%Two or more races
- 2301.4%Asian alone
- 2201.3%Some other race alone
- 2141.3%American Indian and Alaska Native alone
- 1300.8%Black Non-Hispanic Alone
- 620.4%Native Hawaiian and Other
Pacific Islander alone
| Median resident age: | 52.4 years |
| California median age: | 37.9 years |
| Males: 8,559 | |
| Females: 8,428 |

 | April 2021: CA Median Home Price Soars to $813,980; Sales Climb 65.1% Year-Over-Year (81 replies) |
| SonoRa or SonoMa? (36 replies) |
| Natural gas could become banned in California (146 replies) |
| California Home Prices 2021 (18 replies) |
| Mariposa County: City Nearby? (8 replies) |
| Fresno: one of 13 cities where you can live comfortably for < $60/year (61 replies) |
| Mariposa County: | 2.0 people |
| California: | 3 people |
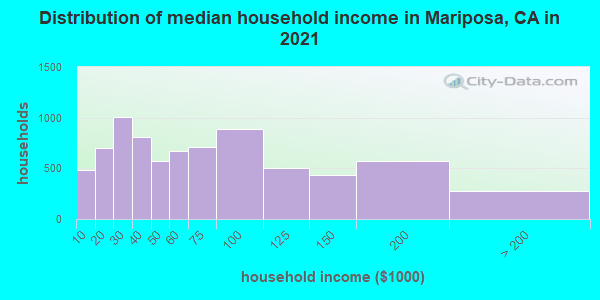
Estimated median household income in 2022: $59,789 ($34,626 in 1999)
| This county: | $59,789 |
| California: | $91,551 |
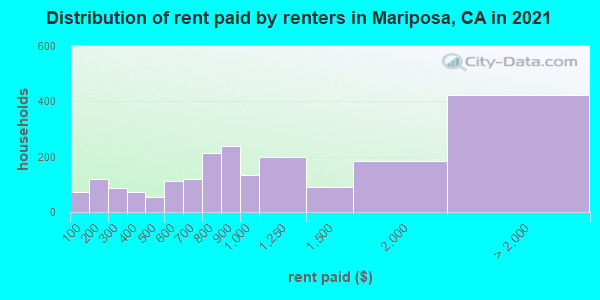
Median contract rent in 2022 for apartments: $886 (lower quartile is $634, upper quartile is $1,420)
| This county: | $886 |
| State: | $1719 |
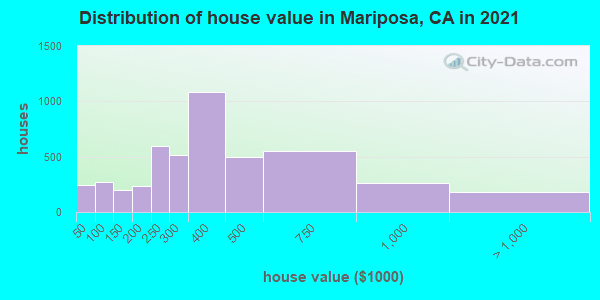
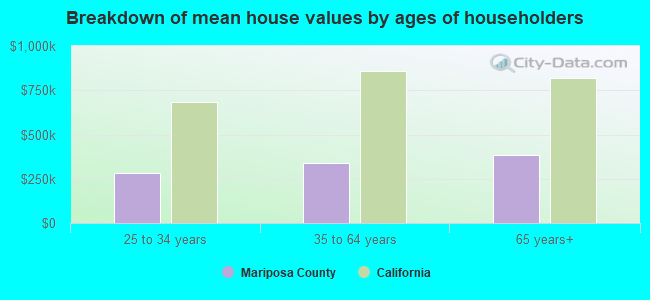
Estimated median house or condo value in 2022: $364,737 (it was $138,700 in 2000)
| Mariposa: | $364,737 |
| California: | $715,900 |
Median monthly housing costs for homes and condos with a mortgage: $1,891
Median monthly housing costs for units without a mortgage: $471
Institutionalized population: 163
Crime in 2020 (reported by the sheriff's office or county police, not the county total):
- Murders: 0
- Rapes: 12
- Robberies: 1
- Assaults: 48
- Burglaries: 54
- Thefts: 125
- Auto thefts: 4
Crime in 2019 (reported by the sheriff's office or county police, not the county total):
- Murders: 0
- Rapes: 8
- Robberies: 2
- Assaults: 69
- Burglaries: 53
- Thefts: 115
- Auto thefts: 3
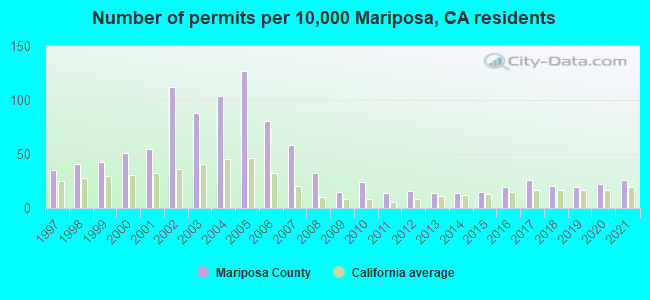
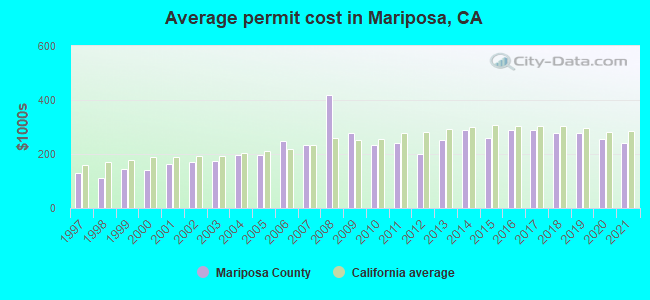
Single-family new house construction building permits:
- 2022: 36 buildings, average cost: $228,100
- 2021: 44 buildings, average cost: $239,800
- 2020: 37 buildings, average cost: $254,700
- 2019: 33 buildings, average cost: $278,700
- 2018: 34 buildings, average cost: $275,900
- 2017: 45 buildings, average cost: $289,100
- 2016: 32 buildings, average cost: $287,800
- 2015: 26 buildings, average cost: $260,900
- 2014: 24 buildings, average cost: $288,400
- 2013: 24 buildings, average cost: $250,500
- 2012: 28 buildings, average cost: $200,700
- 2011: 24 buildings, average cost: $242,000
- 2010: 41 buildings, average cost: $233,000
- 2009: 26 buildings, average cost: $278,100
- 2008: 54 buildings, average cost: $418,000
- 2007: 100 buildings, average cost: $234,200
- 2006: 139 buildings, average cost: $248,000
- 2005: 217 buildings, average cost: $196,000
- 2004: 178 buildings, average cost: $196,000
- 2003: 151 buildings, average cost: $172,700
- 2002: 191 buildings, average cost: $172,100
- 2001: 95 buildings, average cost: $162,900
- 2000: 87 buildings, average cost: $138,600
- 1999: 74 buildings, average cost: $144,800
- 1998: 71 buildings, average cost: $111,300
- 1997: 60 buildings, average cost: $128,500
Median real estate property taxes paid for housing units with mortgages in 2022: $2,607 (0.6%)
Median real estate property taxes paid for housing units with no mortgage in 2022: $1,855 (0.6%)
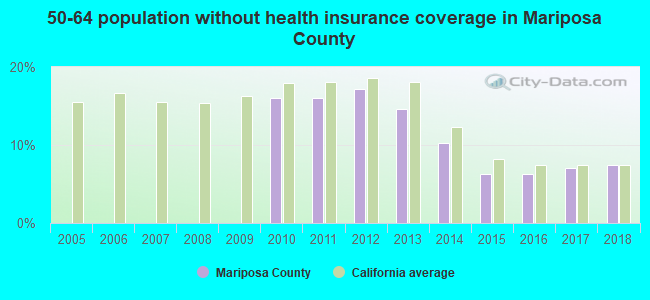
| Mariposa County: | 16.1% |
| California: | 12.2% |
Median age of residents in 2022: 52.4 years old
(Males: 51.1 years old, Females: 54.2 years old)
(Median age for: White residents: 55.9 years old, Black residents: 46.8 years old, American Indian residents: 63.5 years old, Asian residents: 41.1 years old, Hispanic or Latino residents: 33.1 years old, Other race residents: 44.4 years old)
Fair market rent in 2006 for a 1-bedroom apartment in Mariposa County is $559 a month.
Fair market rent for a 2-bedroom apartment is $713 a month.
Fair market rent for a 3-bedroom apartment is $1017 a month.
Cities in this county include: Coulterville, Yosemite, Bootjack, Mariposa, Midpines, Lake Don Pedro, Greeley Hill, Catheys Valley, El Portal, Yosemite Valley.
| Zip code | City | Number of tests | Number of tests >= 4 pCi/L |
|---|---|---|---|
| 93623 | Fish Camp | 3 | 1 |
| 95306 | Catheys Valley | 5 | 1 |
| 95311 | Coulterville | 3 | 0 |
| 95318 | El Portal | 6 | 0 |
| 95325 | Hornitos | 1 | 0 |
| 95338 | Mariposa | 26 | 1 |
| 95345 | Midpines | 1 | 0 |
| 95389 | Yosemite National Park | 4 | 0 |
2023 air pollution in Mariposa County:
Ozone (1-hour): 0.045 ppm (standard limit: 0.12 ppm). Above U.S. average.
Particulate Matter (PM10) Annual: 10.0 µg/m3. Below U.S. average.
Particulate Matter (PM2.5) Annual: 4.3 µg/m3(standard limit: 15.0 µg/m3). Below U.S. average.
Neighboring counties: Boone County, West Virginia  , Barton County, Missouri , McDowell County, West Virginia , Raleigh County, West Virginia , Pope County, Illinois , Washington County, Kentucky .
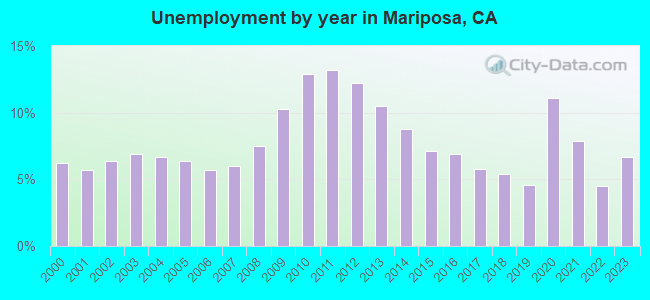
| Here: | 5.4% |
| California: | 5.1% |
Current college students: 819
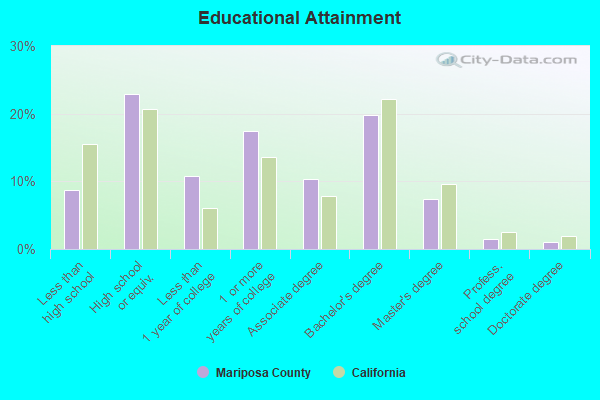
People 25 years of age or older with a high school degree or higher: 91.9%
People 25 years of age or older with a bachelor's degree or higher: 28.9%
Number of foreign born residents: 1,351 (42.9% naturalized citizens)
| Mariposa County: | 8.0% |
| Whole state: | 26.7% |
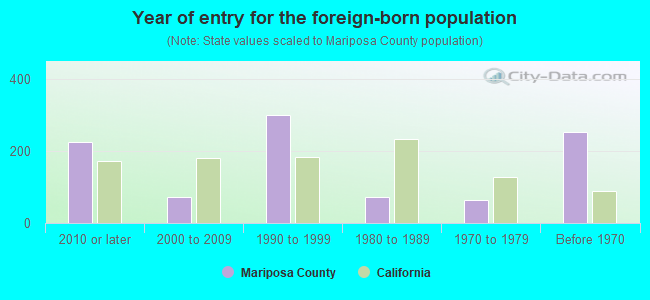
- Year of entry for the foreign-born population
- 5992010 or later
- 1062000 to 2009
- 2841990 to 1999
- 711980 to 1989
- 631970 to 1979
- 254Before 1970
Mean travel time to work (commute): minutes
Percentage of county residents living and working in this county: 99.9%
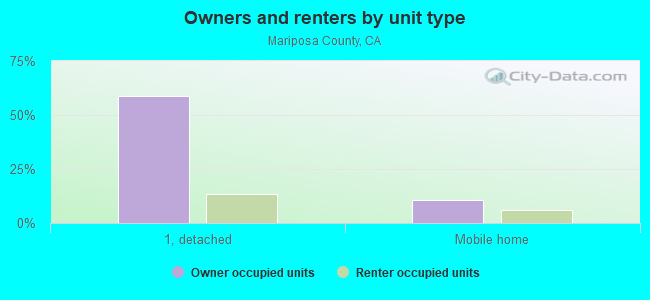
Housing units in structures:
- One, detached: 7,402
- One, attached: 149
- Two: 89
- 3 or 4: 115
- 5 to 9: 85
- 10 to 19: 103
- 20 to 49: 158
- 50 or more: 60
- Mobile homes: 1,636
- Boats, RVs, vans, etc.: 135
Housing units in Mariposa County with a mortgage: 2,813 (168 second mortgage, 35 home equity loan, 113 both second mortgage and home equity loan)
Houses without a mortgage: 51
| Here: | 3.8% with mortgage |
| State: | 98.6% with mortgage |
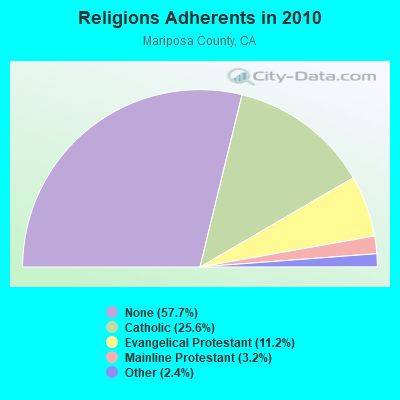
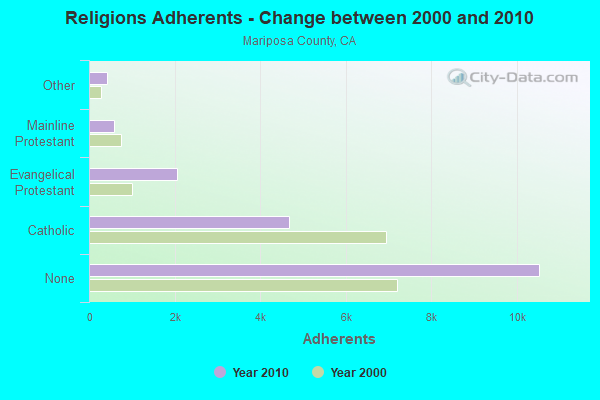
Religion statistics for Mariposa County
| Religion | Adherents | Congregations |
|---|---|---|
| Catholic | 4,671 | 3 |
| Evangelical Protestant | 2,048 | 20 |
| Mainline Protestant | 578 | 3 |
| Other | 431 | 5 |
| None | 10,523 | - |
Source: Clifford Grammich, Kirk Hadaway, Richard Houseal, Dale E.Jones, Alexei Krindatch, Richie Stanley and Richard H.Taylor. 2012. 2010 U.S.Religion Census: Religious Congregations & Membership Study. Association of Statisticians of American Religious Bodies. Jones, Dale E., et al. 2002. Congregations and Membership in the United States 2000. Nashville, TN: Glenmary Research Center.
Food Environment Statistics:
| Mariposa County: | 6.67 / 10,000 pop. |
| State: | 2.14 / 10,000 pop. |
| This county: | 2.22 / 10,000 pop. |
| California: | 0.62 / 10,000 pop. |
| Mariposa County: | 3.33 / 10,000 pop. |
| California: | 1.49 / 10,000 pop. |
| This county: | 5.56 / 10,000 pop. |
| State: | 7.42 / 10,000 pop. |
| Mariposa County: | 7.9% |
| California: | 7.3% |
| Mariposa County: | 23.2% |
| State: | 21.3% |
| Here: | 14.2% |
| State: | 17.9% |
Agriculture in Mariposa County:
Average size of farms: 772 acresAverage value of agricultural products sold per farm: $22,130
Average value of crops sold per acre for harvested cropland: $739.04
The value of nursery, greenhouse, floriculture, and sod as a percentage of the total market value of agricultural products sold: 2.49%
The value of livestock, poultry, and their products as a percentage of the total market value of agricultural products sold: 92.52%
Average total farm production expenses per farm: $41,894
Harvested cropland as a percentage of land in farms: 0.29%
Irrigated harvested cropland as a percentage of land in farms: 16.82%
Average market value of all machinery and equipment per farm: $34,442
The percentage of farms operated by a family or individual: 91.90%
Average age of principal farm operators: 60 years
Average number of cattle and calves per 100 acres of all land in farms: 10.30
Milk cows as a percentage of all cattle and calves: 1.09%
Vegetables: 7 harvested acres
Land in orchards: 139 acres
Earthquake activity:
Mariposa County-area historical earthquake activity is significantly above California state average. It is 8400% greater than the overall U.S. average.On 4/18/1906 at 13:12:21, a magnitude 7.9 (7.9 UK, Class: Major, Intensity: VIII - XII) earthquake occurred 166.1 miles away from Mariposa County center, causing $524,000,000 total damage
On 7/21/1952 at 11:52:14, a magnitude 7.7 (7.7 UK) earthquake occurred 188.0 miles away from the county center, causing $50,000,000 total damage
On 11/4/1927 at 13:51:53, a magnitude 7.5 (7.5 UK) earthquake occurred 194.1 miles away from the county center
On 12/21/1932 at 06:10:09, a magnitude 7.2 (7.2 UK) earthquake occurred 122.2 miles away from the county center
On 10/18/1989 at 00:04:15, a magnitude 7.1 (6.5 MB, 7.1 MS, 6.9 MW, 7.0 ML) earthquake occurred 102.8 miles away from Mariposa County center, causing 62 deaths (62 shaking deaths) and 3757 injuries, causing $1,305,032,704 total damage
On 10/3/1915 at 06:52:48, a magnitude 7.6 (7.6 UK) earthquake occurred 241.7 miles away from the county center
Magnitude types: body-wave magnitude (MB), local magnitude (ML), surface-wave magnitude (MS), moment magnitude (MW)
Most recent natural disasters:
- California Covid-19 Pandemic, Incident Period: January 20, 2020, FEMA Id: 4482, Natural disaster type: Other
- California Severe Winter Storms, Flooding, Landslides, And Mudslides, Incident Period: February 24, 2019 - March 1, 2019, FEMA Id: 4434, Natural disaster type: Winter Storm, Mudslide, Landslide, Flood
- California Severe Winter Storms, Flooding, Landslides, And Mudslides, Incident Period: February 13, 2019 - February 15, 2019, FEMA Id: 4431, Natural disaster type: Winter Storm, Mudslide, Landslide, Flood
- California Severe Winter Storms, Flooding, Mudslides, Incident Period: February 1, 2017 - February 23, 2017, FEMA Id: 4308, Natural disaster type: Winter Storm, Mudslide, Flood
- California Wildfires, Incident Period: June 20, 2008 to August 20, 2008, Emergency Declared EM-3287: June 28, 2008, FEMA Id: 3287, Natural disaster type: Fire
- California Hurricane Katrina Evacuation, Incident Period: August 29, 2005 to October 01, 2005, Emergency Declared EM-3248: September 13, 2005, FEMA Id: 3248, Natural disaster type: Hurricane
- California Old Highway Fire, Incident Period: September 12, 2004 to September 17, 2004, Fire Management Assistance Declared: September 13, 2004, FEMA Id: 2555, Natural disaster type: Fire
- California Bear Fire, Incident Period: September 02, 2004 to September 07, 2004, Fire Management Assistance Declared: September 02, 2004, FEMA Id: 2552, Natural disaster type: Fire
- California Severe Storms/Flooding, Incident Period: December 28, 1996 to April 01, 1997, Major Disaster (Presidential) Declared DR-1155: January 04, 1997, FEMA Id: 1155, Natural disaster type: Storm, Flood
- California Severe Winter Storms, Flooding, Landslides, Mud Flows, Incident Period: February 13, 1995 to April 19, 1995, Major Disaster (Presidential) Declared DR-1046: March 12, 1995, FEMA Id: 1046, Natural disaster type: Winter Storm, Landslide, Flood
- 3 other natural disasters have been reported since 1953.
The number of natural disasters in Mariposa County (13) is near the US average (15).
Major Disasters (Presidential) Declared: 4
Emergencies Declared: 3
Causes of natural disasters: Floods: 7, Winter Storms: 4, Fires: 3, Landslides: 3, Mudslides: 3, Storms: 3, Drought: 1, Hurricane: 1, Tornado: 1, Other: 1 (Note: some incidents may be assigned to more than one category).
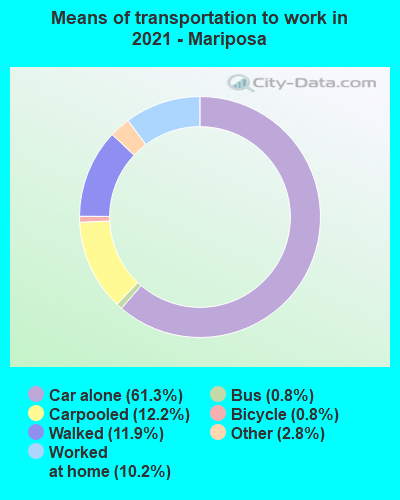
Means of transportation to work:
- Drove a car alone: 4,396 (57.4%)
- Carpooled: 934 (12.2%)
- Bus: 103 (1.3%)
- Taxicab, motorcycle, or other means: 149 (1.9%)
- Bicycle: 110 (1.4%)
- Walked: 642 (8.4%)
- Worked at home: 1,439 (18.8%)
- Health care and social assistance (14%)
- Public administration (12%)
- Educational services (11%)
- Accommodation and food services (11%)
- Retail trade (8%)
- Arts, entertainment, and recreation (7%)
- Other services, except public administration (6%)

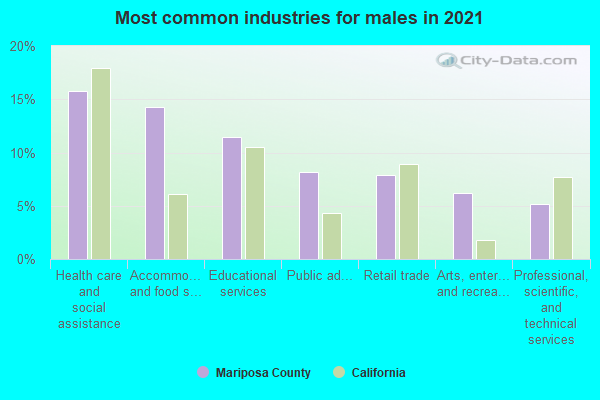
- Health care and social assistance (17%)
- Public administration (14%)
- Educational services (13%)
- Accommodation and food services (13%)
- Retail trade (9%)
- Arts, entertainment, and recreation (9%)
- Other services, except public administration (7%)
- Construction and extraction occupations (10%)
- Food preparation and serving related occupations (9%)
- Management occupations (9%)
- Sales and related occupations (9%)
- Building and grounds cleaning and maintenance occupations (8%)
- Transportation occupations (7%)
- Educational instruction, and library occupations (5%)
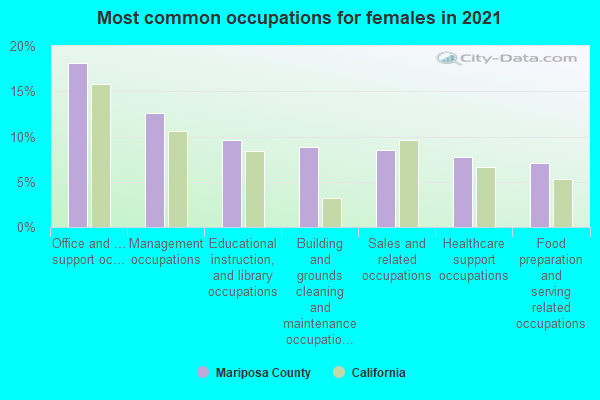
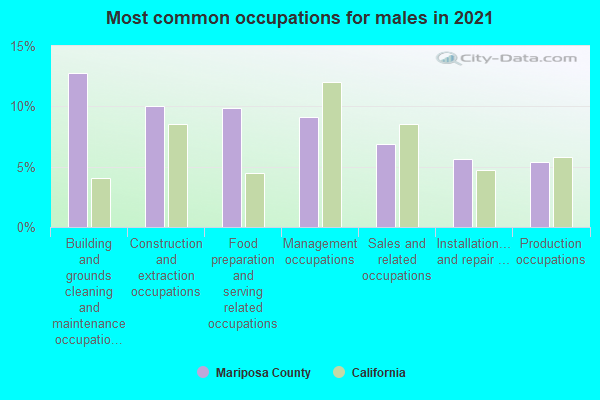
- Office and administrative support occupations (18%)
- Educational instruction, and library occupations (12%)
- Management occupations (10%)
- Sales and related occupations (9%)
- Food preparation and serving related occupations (8%)
- Healthcare support occupations (7%)
- Building and grounds cleaning and maintenance occupations (6%)
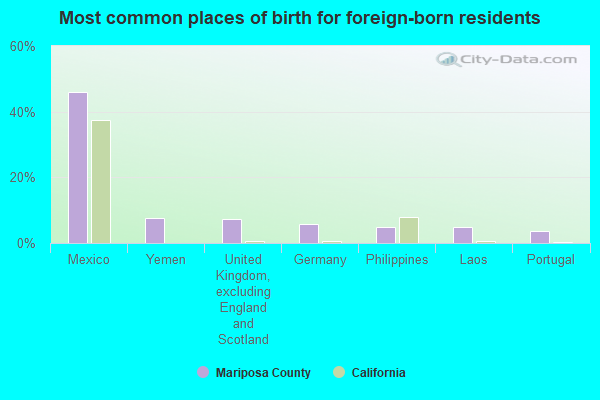
- Mexico (53%)
- England (5%)
- United Kingdom, excluding England and Scotland (4%)
- Yemen (4%)
- Peru (3%)
- Germany (3%)
- Kenya (3%)
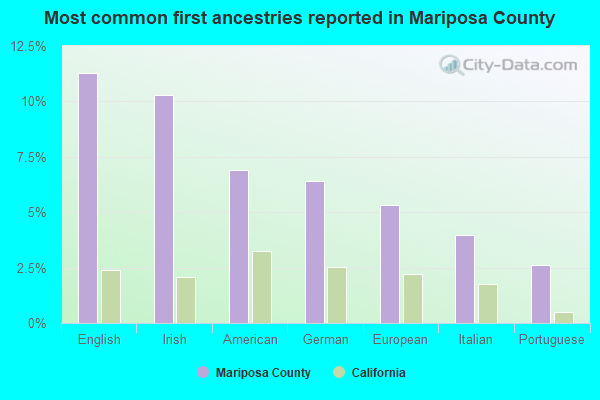
- English (12%)
- Irish (10%)
- German (7%)
- American (7%)
- European (5%)
- Italian (4%)
- Portuguese (3%)
People in group quarters in Mariposa County, California in 2010:
- 550 people in workers' group living quarters and job corps centers
- 94 people in state prisons
- 37 people in local jails and other municipal confinement facilities
- 26 people in nursing facilities/skilled-nursing facilities
- 12 people in other noninstitutional facilities
- 6 people in group homes for juveniles (non-correctional)
People in group quarters in Mariposa County, California in 2000:
- 1,164 people in other workers' dormitories
- 90 people in state prisons
- 61 people in other noninstitutional group quarters
- 48 people in local jails and other confinement facilities (including police lockups)
- 30 people in nursing homes
- 25 people in unknown juvenile institutions
- 6 people in homes for abused, dependent, and neglected children
- 2 people in other group homes
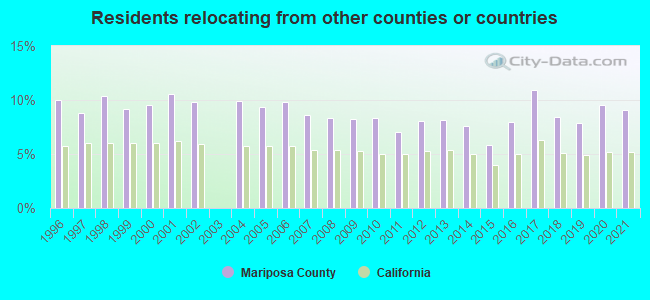
9.04% of this county's 2021 resident taxpayers lived in other counties in 2020 ($60,185 average adjusted gross income)
| Here: | 9.04% |
| California average: | 5.19% |
10 or fewer of this county's residents moved from foreign countries.
7.52% relocated from other counties in California ($52,586 average AGI)
1.52% relocated from other states ($7,598 average AGI)
Mariposa County: 1.52% California average: 1.56%
Top counties from which taxpayers relocated into this county between 2020 and 2021:
| from Stanislaus County, CA | |
| from Merced County, CA | |
| from Madera County, CA | |
| from Tuolumne County, CA | |
| from Fresno County, CA | |
| from Los Angeles County, CA | |
| from Santa Clara County, CA |
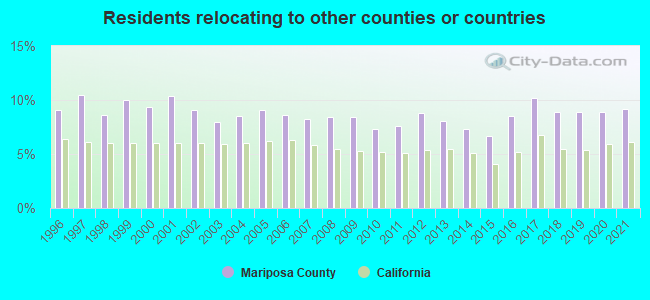
9.16% of this county's 2020 resident taxpayers moved to other counties in 2021 ($54,193 average adjusted gross income)
| Here: | 9.16% |
| California average: | 6.14% |
10 or fewer of this county's residents moved to foreign countries.
5.43% relocated to other counties in California ($31,370 average AGI)
3.73% relocated to other states ($22,822 average AGI)
Mariposa County: 3.73% California average: 2.55%
Top counties to which taxpayers relocated from this county between 2020 and 2021:
| to Madera County, CA | |
| to Tuolumne County, CA | |
| to Merced County, CA | |
| to Stanislaus County, CA | |
| to Fresno County, CA |
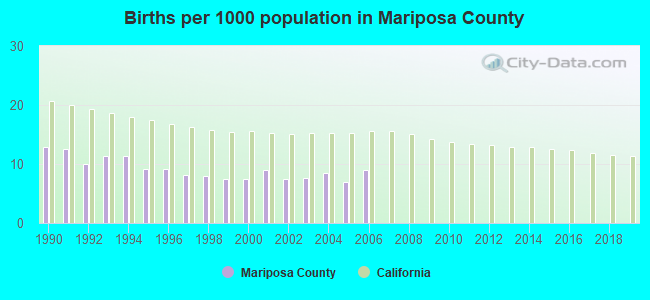
Births per 1000 population from 1990 to 1999: 10.0
Births per 1000 population from 2000 to 2006: 7.9
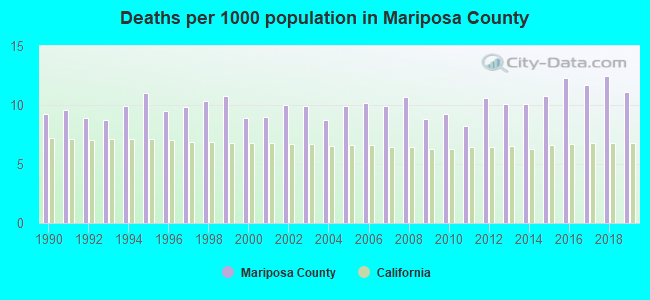
Deaths per 1000 population from 1990 to 1999: 9.8
Deaths per 1000 population from 2000 to 2009: 9.6
Deaths per 1000 population from 2010 to 2020: 10.8
Infant deaths per 1000 live births from 1990 to 1999: 4.8
Infant deaths per 1000 live births from 2000 to 2006: 6.1

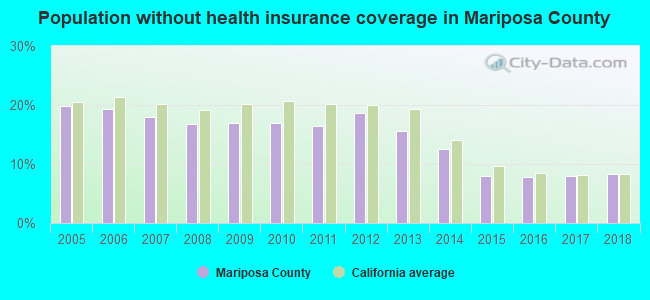
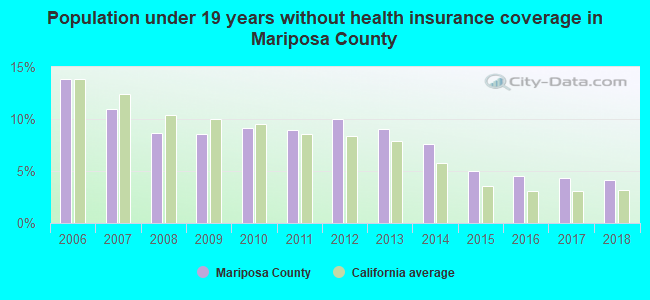
Persons under 19 years old without health insurance coverage in 2018: 4.1%
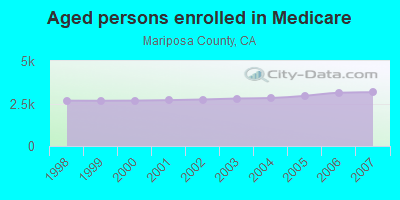
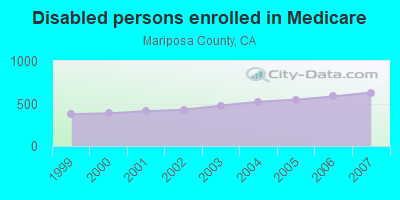
Persons enrolled in hospital insurance and/or supplemental medical insurance (Medicare) in July 1, 2007: 3,791 (3,162 aged, 629 disabled)
Children under 18 without health insurance coverage in 2007: 327 (10%)

Most common underlying causes of death in Mariposa County, California in 1999 - 2019:
- Atherosclerotic heart disease (318)
- Bronchus or lung, unspecified - Malignant neoplasms (202)
- Acute myocardial infarction, unspecified (115)
- Atherosclerotic cardiovascular disease, so described (89)
- Chronic obstructive pulmonary disease, unspecified (80)
- Stroke, not specified as haemorrhage or infarction (23)
- Other ill-defined and unspecified causes of mortality (14)
- Unspecified dementia (13)
Population without health insurance coverage in 2000: 16%
Children under 18 without health insurance coverage in 2000: 14%
Suicides per 1,000,000 population from 2000 to 2006: 196.3. This is less than state average.
Household type by relationship:
Households: 16,987- Male householders: 3,246 (1,154 living alone), Female householders: 4,497 (1,430 living alone)
3,465 spouses (3,430 opposite-sex spouses), 578 unmarried partners, (565 opposite-sex unmarried partners), 2,907 children (2,580 natural, 84 adopted, 237 stepchildren), 410 grandchildren, 40 brothers or sisters, 76 parents, 4 foster children, 92 other relatives, 92 non-relatives
- In group quarters: 1,776
Size of family households: 2,560 2-persons, 867 3-persons, 636 4-persons, 370 5-persons, 48 6-persons, 103 7-or-more-persons.
Size of nonfamily households: 2,585 1-person, 550 2-persons, 44 3-persons, 20 4-persons.
1,302 married couples with children.
1,125 single-parent households (330 men, 795 women).
89.6% of residents of Mariposa speak English at home.
7.8% of residents speak Spanish at home (64% speak English very well, 9% speak English well, 23% speak English not well, 4% don't speak English at all).
1.4% of residents speak other Indo-European language at home (82% speak English very well, 6% speak English well, 8% speak English not well, 3% don't speak English at all).
0.8% of residents speak Asian or Pacific Island language at home (64% speak English very well, 27% speak English well, 10% speak English not well).
0.4% of residents speak other language at home (15% speak English very well, 85% speak English well).
In fiscal year 2004:
Federal Government expenditure: $125,219,000 ($6,955 per capita)
Department of Defense expenditure: $4,868,000
Federal direct payments to individuals for retirement and disability: $54,448,000
Federal other direct payments to individuals: $23,901,000
Federal direct payments not to individuals: $3,000
Federal grants: $16,383,000
Federal procurement contracts: $5,529,000 ($1,803,000 Department of Defense)
Federal salaries and wages: $24,954,000 ($0,000 Department of Defense)
Federal Government direct loans: $400,000
Federal guaranteed/insured loans: $3,424,000
Federal Government insurance: $0,000
Population change from April 1, 2000 to July 1, 2005:
Births: 704| Here: | 39 per 1000 residents |
| State: | 77 per 1000 residents |
Deaths: 883
| Here: | 49 per 1000 residents |
| State: | 34 per 1000 residents |
Net international migration: +27
| Here: | +1 per 1000 residents |
| State: | +39 per 1000 residents |
Net internal migration: +1,134
| Here: | |
| State: |
Total withdrawal of fresh water for public supply: 1.15 millions of gallons per day (57% from ground, 43% from surface)
| Here: | 5.7 |
| State: | 6.0 |
| Here: | 4.7 |
| State: | 3.9 |
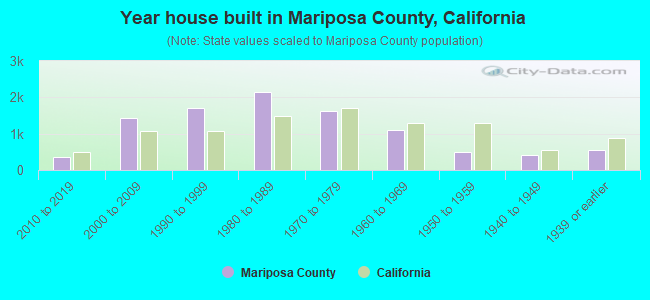
- Year house built in Mariposa County, California
- 02020 or later
- 6442010 to 2019
- 1,3082000 to 2009
- 1,5881990 to 1999
- 2,2371980 to 1989
- 1,5321970 to 1979
- 1,0851960 to 1969
- 5891950 to 1959
- 4051940 to 1949
- 4711939 or earlier
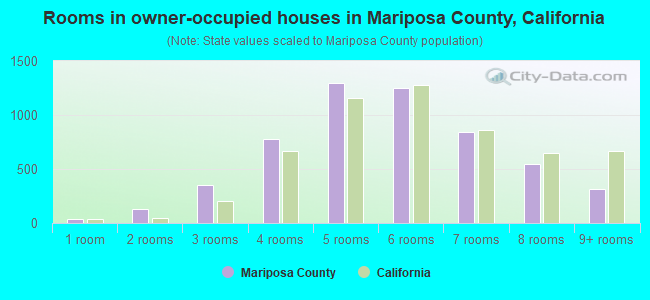
- Rooms in owner-occupied houses in Mariposa County, California
- 411 room
- 1212 rooms
- 2653 rooms
- 8524 rooms
- 1,3775 rooms
- 1,3616 rooms
- 8817 rooms
- 5378 rooms
- 2979+ rooms

- Rooms in renter-occupied apartments in Mariposa County, California
- 2001 room
- 2032 rooms
- 2193 rooms
- 3164 rooms
- 5475 rooms
- 3396 rooms
- 1457 rooms
- 368 rooms
- 149+ rooms
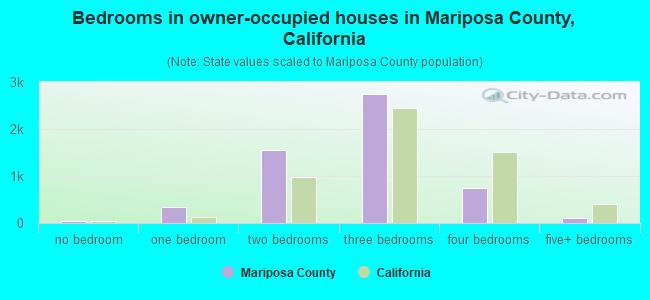
- Bedrooms in owner-occupied houses in Mariposa County, California
- 40no bedroom
- 2951 bedroom
- 1,7272 bedrooms
- 2,7503 bedrooms
- 8014 bedrooms
- 815+ bedrooms
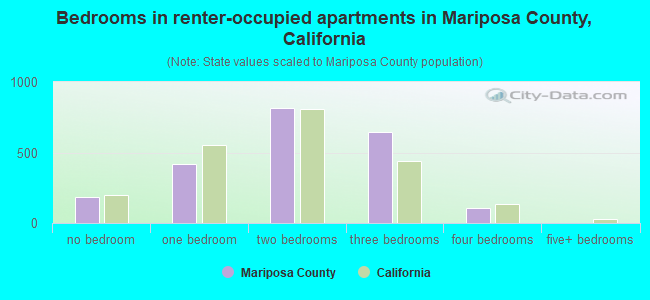
- Bedrooms in renter-occupied apartments in Mariposa County, California
- 200no bedroom
- 3191 bedroom
- 7322 bedrooms
- 6863 bedrooms
- 824 bedrooms
- 05+ bedrooms

- Cars and other vehicles available in Mariposa County in owner-occupied houses/condos
- 243no vehicle
- 1,3431 vehicle
- 2,3042 vehicles
- 1,0613 vehicles
- 5164 vehicles
- 2685+ vehicles
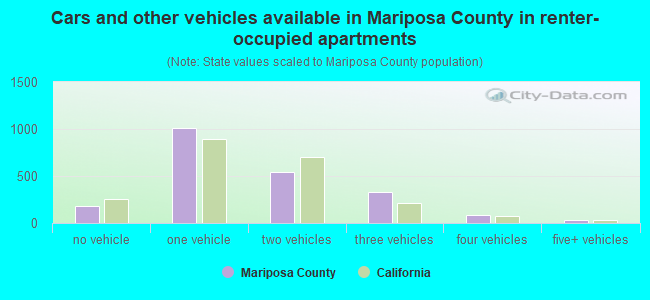
- Cars and other vehicles available in Mariposa County in renter-occupied apartments
- 170no vehicle
- 9871 vehicle
- 4992 vehicles
- 2493 vehicles
- 1234 vehicles
- 05+ vehicles
87.4% of Mariposa County residents lived in the same house 1 years ago.
Out of people who lived in different houses, 31% lived in this county.
Out of people who lived in different counties, 72% lived in California.
| Mariposa County: | 87.4% |
| State average: | 88.9% |
Place of birth for U.S.-born residents:
- This state: 11,194
- Other state: 4,256
- Northeast: 683
- Midwest: 1,600
- South: 941
- West: 1,011

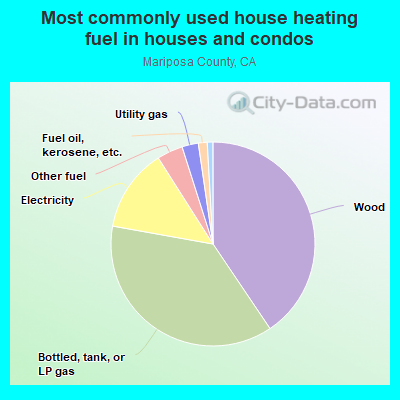
- 40.3%Wood
- 36.5%Bottled, tank, or LP gas
- 15.4%Electricity
- 3.3%Other fuel
- 2.7%Utility gas
- 1.3%Fuel oil, kerosene, etc.
- 0.6%Solar energy
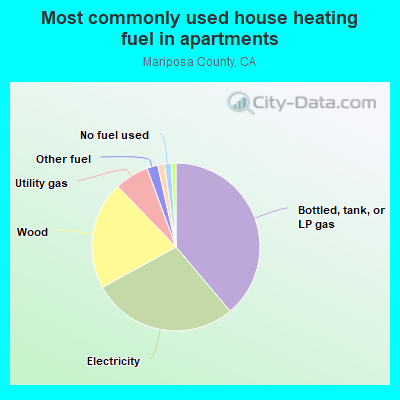
- 42.7%Bottled, tank, or LP gas
- 25.2%Electricity
- 21.5%Wood
- 6.6%Utility gas
- 1.6%No fuel used
- 1.5%Other fuel
- 0.5%Solar energy
- 0.4%Fuel oil, kerosene, etc.
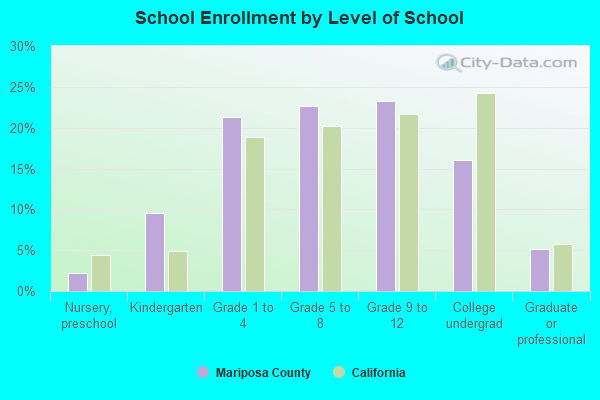
Private vs. public school enrollment:
| Here: | 16.9% |
| California: | 10.5% |
| Here: | 6.1% |
| California: | 8.5% |
| Here: | 24.3% |
| California: | 15.9% |
Mariposa County government finances - Expenditure in 2018:
- Assistance and Subsidies - Public Welfare, Cash Assistance Programs - Other: $3,142,000
Public Welfare, Cash Assistance Programs - Other: $2,365,000
- Charges - Other: $3,105,000
Solid Waste Management: $2,617,000
Solid Waste Management: $2,428,000
Other: $2,297,000
Sewerage: $663,000
Regular Highways: $438,000
Sewerage: $388,000
Regular Highways: $336,000
Air Transportation: $60,000
Air Transportation: $49,000
Parks and Recreation: $45,000
Parks and Recreation: $39,000
Natural Resources - Other: $6,000
Natural Resources - Other: $5,000
- Construction - Sewerage: $7,098,000
Sewerage: $6,925,000
- Current Operations - Health - Other: $13,865,000
Public Welfare - Other: $13,390,000
Public Welfare - Other: $11,558,000
General - Other: $10,748,000
Health - Other: $10,451,000
Police Protection: $9,064,000
Police Protection: $8,575,000
General - Other: $7,653,000
Central Staff Services: $4,240,000
Regular Highways: $4,167,000
Judicial and Legal Services: $4,089,000
Elementary and Secondary Education: $3,829,000
Regular Highways: $3,669,000
Central Staff Services: $3,460,000
Correctional Institutions: $3,423,000
Elementary and Secondary Education: $3,345,000
Correctional Institutions: $3,311,000
Judicial and Legal Services: $3,262,000
Solid Waste Management: $2,954,000
Financial Administration: $2,672,000
Local Fire Protection: $2,647,000
Local Fire Protection: $2,610,000
Financial Administration: $2,336,000
Solid Waste Management: $2,289,000
Corrections - Other: $2,122,000
Corrections - Other: $1,381,000
Protective Inspection and Regulation - Other: $741,000
Sewerage: $722,000
Libraries: $721,000
Sewerage: $670,000
Libraries: $646,000
Electric Utilities: $633,000
Natural Resources - Other: $556,000
Electric Utilities: $520,000
Natural Resources - Other: $445,000
Parks and Recreation: $443,000
Parks and Recreation: $377,000
Water Utilities: $371,000
Transit Utilities: $363,000
Water Utilities: $291,000
Air Transportation: $189,000
Transit Utilities: $99,000
Air Transportation: $94,000
Parking Facilities: $10,000
Parking Facilities: $9,000
Public Welfare, Vendor Payments for Other Purposes: $2,000
Public Welfare, Vendor Payments for Other Purposes: $2,000
- Federal Intergovernmental - Other: $3,222,000
Other: $2,849,000
General Local Government Support: $1,312,000
General Local Government Support: $1,202,000
Housing and Community Development: $1,015,000
Transit Utilities: $196,000
Natural Resources: $144,000
Natural Resources: $133,000
Transit Utilities: $105,000
Air Transportation: $32,000
Education: $30,000
Education: $20,000
Air Transportation: $12,000
- General - Interest on Debt: $468,000
Interest on Debt: $358,000
- Intergovernmental to Local - Other - Elementary and Secondary Education: $91,000
Other - Elementary and Secondary Education: $84,000
Other - Health - Other: $48,000
- Intergovernmental to State - Judicial and Legal Services: $172,000
Judicial and Legal Services: $165,000
- Local Intergovernmental - Education: $1,609,000
Education: $1,263,000
Water Utilities: $302,000
Transit Utilities: $24,000
- Long Term Debt - Beginning Outstanding - Unspecified Public Purpose: $12,361,000
Outstanding Unspecified Public Purpose: $11,528,000
Beginning Outstanding - Unspecified Public Purpose: $11,367,000
Outstanding Unspecified Public Purpose: $11,158,000
Retired Unspecified Public Purpose: $833,000
Retired Unspecified Public Purpose: $631,000
Issue, Unspecified Public Purpose: $422,000
- Miscellaneous - Rents: $1,506,000
Special Assessments: $1,151,000
Special Assessments: $1,105,000
General Revenue - Other: $590,000
General Revenue - Other: $430,000
Interest Earnings: $429,000
Interest Earnings: $318,000
Fines and Forfeits: $270,000
Fines and Forfeits: $239,000
Sale of Property: $32,000
Rents: $27,000
Donations From Private Sources: $1,000
- Other Capital Outlay - Regular Highways: $6,476,000
Regular Highways: $3,439,000
General - Other: $864,000
General - Other: $858,000
Solid Waste Management: $171,000
Solid Waste Management: $161,000
Corrections - Other: $154,000
Public Welfare - Other: $60,000
Judicial and Legal Services: $24,000
Central Staff Services: $20,000
- Other Funds - Cash and Securities: $40,389,000
Cash and Securities: $19,859,000
- Revenue - Electric Utilities: $359,000
Water Utilities: $339,000
Electric Utilities: $330,000
Water Utilities: $313,000
Transit Utilities: $2,000
- Short Term Debt Outstanding - Beginning: $5,000
End of Fiscal Year: $3,000
- Sinking Funds - Cash and Securities: $205,000
Cash and Securities: $190,000
- State Intergovernmental - Public Welfare: $15,162,000
Public Welfare: $13,239,000
Health and Hospitals: $12,983,000
Health and Hospitals: $9,141,000
Other: $9,026,000
Other: $7,011,000
Highways: $5,092,000
Education: $2,639,000
Highways: $2,478,000
Education: $2,276,000
Transit Utilities: $197,000
Transit Utilities: $104,000
General Local Government Support: $86,000
General Local Government Support: $84,000
Sewerage: $2,000
Sewerage: $1,000
- Tax - Other Selective Sales: $15,102,000
Other Selective Sales: $14,766,000
Property: $9,423,000
Property: $8,599,000
General Sales and Gross Receipts: $2,155,000
General Sales and Gross Receipts: $2,026,000
Occupation and Business License - Other: $726,000
Occupation and Business License - Other: $620,000
Other: $335,000
Public Utilities Sales: $175,000
Documentary and Stock Transfer: $151,000
Public Utilities Sales: $146,000
Documentary and Stock Transfer: $146,000
Other License: $4,000
Other License: $4,000
- Total Salaries and Wages: $2,080,000
: $1,737,000
Mariposa County government finances - Revenue in 2018:
- Assistance and Subsidies - Public Welfare, Cash Assistance Programs - Other: $3,142,000
Public Welfare, Cash Assistance Programs - Other: $2,365,000
- Charges - Other: $3,105,000
Solid Waste Management: $2,617,000
Solid Waste Management: $2,428,000
Other: $2,297,000
Sewerage: $663,000
Regular Highways: $438,000
Sewerage: $388,000
Regular Highways: $336,000
Air Transportation: $60,000
Air Transportation: $49,000
Parks and Recreation: $45,000
Parks and Recreation: $39,000
Natural Resources - Other: $6,000
Natural Resources - Other: $5,000
- Construction - Sewerage: $7,098,000
Sewerage: $6,925,000
- Current Operations - Health - Other: $13,865,000
Public Welfare - Other: $13,390,000
Public Welfare - Other: $11,558,000
General - Other: $10,748,000
Health - Other: $10,451,000
Police Protection: $9,064,000
Police Protection: $8,575,000
General - Other: $7,653,000
Central Staff Services: $4,240,000
Regular Highways: $4,167,000
Judicial and Legal Services: $4,089,000
Elementary and Secondary Education: $3,829,000
Regular Highways: $3,669,000
Central Staff Services: $3,460,000
Correctional Institutions: $3,423,000
Elementary and Secondary Education: $3,345,000
Correctional Institutions: $3,311,000
Judicial and Legal Services: $3,262,000
Solid Waste Management: $2,954,000
Financial Administration: $2,672,000
Local Fire Protection: $2,647,000
Local Fire Protection: $2,610,000
Financial Administration: $2,336,000
Solid Waste Management: $2,289,000
Corrections - Other: $2,122,000
Corrections - Other: $1,381,000
Protective Inspection and Regulation - Other: $741,000
Sewerage: $722,000
Libraries: $721,000
Sewerage: $670,000
Libraries: $646,000
Electric Utilities: $633,000
Natural Resources - Other: $556,000
Electric Utilities: $520,000
Natural Resources - Other: $445,000
Parks and Recreation: $443,000
Parks and Recreation: $377,000
Water Utilities: $371,000
Transit Utilities: $363,000
Water Utilities: $291,000
Air Transportation: $189,000
Transit Utilities: $99,000
Air Transportation: $94,000
Parking Facilities: $10,000
Parking Facilities: $9,000
Public Welfare, Vendor Payments for Other Purposes: $2,000
Public Welfare, Vendor Payments for Other Purposes: $2,000
- Federal Intergovernmental - Other: $3,222,000
Other: $2,849,000
General Local Government Support: $1,312,000
General Local Government Support: $1,202,000
Housing and Community Development: $1,015,000
Transit Utilities: $196,000
Natural Resources: $144,000
Natural Resources: $133,000
Transit Utilities: $105,000
Air Transportation: $32,000
Education: $30,000
Education: $20,000
Air Transportation: $12,000
- General - Interest on Debt: $468,000
Interest on Debt: $358,000
- Intergovernmental to Local - Other - Elementary and Secondary Education: $91,000
Other - Elementary and Secondary Education: $84,000
Other - Health - Other: $48,000
- Intergovernmental to State - Judicial and Legal Services: $172,000
Judicial and Legal Services: $165,000
- Local Intergovernmental - Education: $1,609,000
Education: $1,263,000
Water Utilities: $302,000
Transit Utilities: $24,000
- Long Term Debt - Beginning Outstanding - Unspecified Public Purpose: $12,361,000
Outstanding Unspecified Public Purpose: $11,528,000
Beginning Outstanding - Unspecified Public Purpose: $11,367,000
Outstanding Unspecified Public Purpose: $11,158,000
Retired Unspecified Public Purpose: $833,000
Retired Unspecified Public Purpose: $631,000
Issue, Unspecified Public Purpose: $422,000
- Miscellaneous - Rents: $1,506,000
Special Assessments: $1,151,000
Special Assessments: $1,105,000
General Revenue - Other: $590,000
General Revenue - Other: $430,000
Interest Earnings: $429,000
Interest Earnings: $318,000
Fines and Forfeits: $270,000
Fines and Forfeits: $239,000
Sale of Property: $32,000
Rents: $27,000
Donations From Private Sources: $1,000
- Other Capital Outlay - Regular Highways: $6,476,000
Regular Highways: $3,439,000
General - Other: $864,000
General - Other: $858,000
Solid Waste Management: $171,000
Solid Waste Management: $161,000
Corrections - Other: $154,000
Public Welfare - Other: $60,000
Judicial and Legal Services: $24,000
Central Staff Services: $20,000
- Other Funds - Cash and Securities: $40,389,000
Cash and Securities: $19,859,000
- Revenue - Electric Utilities: $359,000
Water Utilities: $339,000
Electric Utilities: $330,000
Water Utilities: $313,000
Transit Utilities: $2,000
- Short Term Debt Outstanding - Beginning: $5,000
End of Fiscal Year: $3,000
- Sinking Funds - Cash and Securities: $205,000
Cash and Securities: $190,000
- State Intergovernmental - Public Welfare: $15,162,000
Public Welfare: $13,239,000
Health and Hospitals: $12,983,000
Health and Hospitals: $9,141,000
Other: $9,026,000
Other: $7,011,000
Highways: $5,092,000
Education: $2,639,000
Highways: $2,478,000
Education: $2,276,000
Transit Utilities: $197,000
Transit Utilities: $104,000
General Local Government Support: $86,000
General Local Government Support: $84,000
Sewerage: $2,000
Sewerage: $1,000
- Tax - Other Selective Sales: $15,102,000
Other Selective Sales: $14,766,000
Property: $9,423,000
Property: $8,599,000
General Sales and Gross Receipts: $2,155,000
General Sales and Gross Receipts: $2,026,000
Occupation and Business License - Other: $726,000
Occupation and Business License - Other: $620,000
Other: $335,000
Public Utilities Sales: $175,000
Documentary and Stock Transfer: $151,000
Public Utilities Sales: $146,000
Documentary and Stock Transfer: $146,000
Other License: $4,000
Other License: $4,000
- Total Salaries and Wages: $2,080,000
: $1,737,000
Mariposa County government finances - Debt in 2018:
- Assistance and Subsidies - Public Welfare, Cash Assistance Programs - Other: $3,142,000
Public Welfare, Cash Assistance Programs - Other: $2,365,000
- Charges - Other: $3,105,000
Solid Waste Management: $2,617,000
Solid Waste Management: $2,428,000
Other: $2,297,000
Sewerage: $663,000
Regular Highways: $438,000
Sewerage: $388,000
Regular Highways: $336,000
Air Transportation: $60,000
Air Transportation: $49,000
Parks and Recreation: $45,000
Parks and Recreation: $39,000
Natural Resources - Other: $6,000
Natural Resources - Other: $5,000
- Construction - Sewerage: $7,098,000
Sewerage: $6,925,000
- Current Operations - Health - Other: $13,865,000
Public Welfare - Other: $13,390,000
Public Welfare - Other: $11,558,000
General - Other: $10,748,000
Health - Other: $10,451,000
Police Protection: $9,064,000
Police Protection: $8,575,000
General - Other: $7,653,000
Central Staff Services: $4,240,000
Regular Highways: $4,167,000
Judicial and Legal Services: $4,089,000
Elementary and Secondary Education: $3,829,000
Regular Highways: $3,669,000
Central Staff Services: $3,460,000
Correctional Institutions: $3,423,000
Elementary and Secondary Education: $3,345,000
Correctional Institutions: $3,311,000
Judicial and Legal Services: $3,262,000
Solid Waste Management: $2,954,000
Financial Administration: $2,672,000
Local Fire Protection: $2,647,000
Local Fire Protection: $2,610,000
Financial Administration: $2,336,000
Solid Waste Management: $2,289,000
Corrections - Other: $2,122,000
Corrections - Other: $1,381,000
Protective Inspection and Regulation - Other: $741,000
Sewerage: $722,000
Libraries: $721,000
Sewerage: $670,000
Libraries: $646,000
Electric Utilities: $633,000
Natural Resources - Other: $556,000
Electric Utilities: $520,000
Natural Resources - Other: $445,000
Parks and Recreation: $443,000
Parks and Recreation: $377,000
Water Utilities: $371,000
Transit Utilities: $363,000
Water Utilities: $291,000
Air Transportation: $189,000
Transit Utilities: $99,000
Air Transportation: $94,000
Parking Facilities: $10,000
Parking Facilities: $9,000
Public Welfare, Vendor Payments for Other Purposes: $2,000
Public Welfare, Vendor Payments for Other Purposes: $2,000
- Federal Intergovernmental - Other: $3,222,000
Other: $2,849,000
General Local Government Support: $1,312,000
General Local Government Support: $1,202,000
Housing and Community Development: $1,015,000
Transit Utilities: $196,000
Natural Resources: $144,000
Natural Resources: $133,000
Transit Utilities: $105,000
Air Transportation: $32,000
Education: $30,000
Education: $20,000
Air Transportation: $12,000
- General - Interest on Debt: $468,000
Interest on Debt: $358,000
- Intergovernmental to Local - Other - Elementary and Secondary Education: $91,000
Other - Elementary and Secondary Education: $84,000
Other - Health - Other: $48,000
- Intergovernmental to State - Judicial and Legal Services: $172,000
Judicial and Legal Services: $165,000
- Local Intergovernmental - Education: $1,609,000
Education: $1,263,000
Water Utilities: $302,000
Transit Utilities: $24,000
- Long Term Debt - Beginning Outstanding - Unspecified Public Purpose: $12,361,000
Outstanding Unspecified Public Purpose: $11,528,000
Beginning Outstanding - Unspecified Public Purpose: $11,367,000
Outstanding Unspecified Public Purpose: $11,158,000
Retired Unspecified Public Purpose: $833,000
Retired Unspecified Public Purpose: $631,000
Issue, Unspecified Public Purpose: $422,000
- Miscellaneous - Rents: $1,506,000
Special Assessments: $1,151,000
Special Assessments: $1,105,000
General Revenue - Other: $590,000
General Revenue - Other: $430,000
Interest Earnings: $429,000
Interest Earnings: $318,000
Fines and Forfeits: $270,000
Fines and Forfeits: $239,000
Sale of Property: $32,000
Rents: $27,000
Donations From Private Sources: $1,000
- Other Capital Outlay - Regular Highways: $6,476,000
Regular Highways: $3,439,000
General - Other: $864,000
General - Other: $858,000
Solid Waste Management: $171,000
Solid Waste Management: $161,000
Corrections - Other: $154,000
Public Welfare - Other: $60,000
Judicial and Legal Services: $24,000
Central Staff Services: $20,000
- Other Funds - Cash and Securities: $40,389,000
Cash and Securities: $19,859,000
- Revenue - Electric Utilities: $359,000
Water Utilities: $339,000
Electric Utilities: $330,000
Water Utilities: $313,000
Transit Utilities: $2,000
- Short Term Debt Outstanding - Beginning: $5,000
End of Fiscal Year: $3,000
- Sinking Funds - Cash and Securities: $205,000
Cash and Securities: $190,000
- State Intergovernmental - Public Welfare: $15,162,000
Public Welfare: $13,239,000
Health and Hospitals: $12,983,000
Health and Hospitals: $9,141,000
Other: $9,026,000
Other: $7,011,000
Highways: $5,092,000
Education: $2,639,000
Highways: $2,478,000
Education: $2,276,000
Transit Utilities: $197,000
Transit Utilities: $104,000
General Local Government Support: $86,000
General Local Government Support: $84,000
Sewerage: $2,000
Sewerage: $1,000
- Tax - Other Selective Sales: $15,102,000
Other Selective Sales: $14,766,000
Property: $9,423,000
Property: $8,599,000
General Sales and Gross Receipts: $2,155,000
General Sales and Gross Receipts: $2,026,000
Occupation and Business License - Other: $726,000
Occupation and Business License - Other: $620,000
Other: $335,000
Public Utilities Sales: $175,000
Documentary and Stock Transfer: $151,000
Public Utilities Sales: $146,000
Documentary and Stock Transfer: $146,000
Other License: $4,000
Other License: $4,000
- Total Salaries and Wages: $2,080,000
: $1,737,000
Mariposa County government finances - Cash and Securities in 2018:
- Assistance and Subsidies - Public Welfare, Cash Assistance Programs - Other: $3,142,000
Public Welfare, Cash Assistance Programs - Other: $2,365,000
- Charges - Other: $3,105,000
Solid Waste Management: $2,617,000
Solid Waste Management: $2,428,000
Other: $2,297,000
Sewerage: $663,000
Regular Highways: $438,000
Sewerage: $388,000
Regular Highways: $336,000
Air Transportation: $60,000
Air Transportation: $49,000
Parks and Recreation: $45,000
Parks and Recreation: $39,000
Natural Resources - Other: $6,000
Natural Resources - Other: $5,000
- Construction - Sewerage: $7,098,000
Sewerage: $6,925,000
- Current Operations - Health - Other: $13,865,000
Public Welfare - Other: $13,390,000
Public Welfare - Other: $11,558,000
General - Other: $10,748,000
Health - Other: $10,451,000
Police Protection: $9,064,000
Police Protection: $8,575,000
General - Other: $7,653,000
Central Staff Services: $4,240,000
Regular Highways: $4,167,000
Judicial and Legal Services: $4,089,000
Elementary and Secondary Education: $3,829,000
Regular Highways: $3,669,000
Central Staff Services: $3,460,000
Correctional Institutions: $3,423,000
Elementary and Secondary Education: $3,345,000
Correctional Institutions: $3,311,000
Judicial and Legal Services: $3,262,000
Solid Waste Management: $2,954,000
Financial Administration: $2,672,000
Local Fire Protection: $2,647,000
Local Fire Protection: $2,610,000
Financial Administration: $2,336,000
Solid Waste Management: $2,289,000
Corrections - Other: $2,122,000
Corrections - Other: $1,381,000
Protective Inspection and Regulation - Other: $741,000
Sewerage: $722,000
Libraries: $721,000
Sewerage: $670,000
Libraries: $646,000
Electric Utilities: $633,000
Natural Resources - Other: $556,000
Electric Utilities: $520,000
Natural Resources - Other: $445,000
Parks and Recreation: $443,000
Parks and Recreation: $377,000
Water Utilities: $371,000
Transit Utilities: $363,000
Water Utilities: $291,000
Air Transportation: $189,000
Transit Utilities: $99,000
Air Transportation: $94,000
Parking Facilities: $10,000
Parking Facilities: $9,000
Public Welfare, Vendor Payments for Other Purposes: $2,000
Public Welfare, Vendor Payments for Other Purposes: $2,000
- Federal Intergovernmental - Other: $3,222,000
Other: $2,849,000
General Local Government Support: $1,312,000
General Local Government Support: $1,202,000
Housing and Community Development: $1,015,000
Transit Utilities: $196,000
Natural Resources: $144,000
Natural Resources: $133,000
Transit Utilities: $105,000
Air Transportation: $32,000
Education: $30,000
Education: $20,000
Air Transportation: $12,000
- General - Interest on Debt: $468,000
Interest on Debt: $358,000
- Intergovernmental to Local - Other - Elementary and Secondary Education: $91,000
Other - Elementary and Secondary Education: $84,000
Other - Health - Other: $48,000
- Intergovernmental to State - Judicial and Legal Services: $172,000
Judicial and Legal Services: $165,000
- Local Intergovernmental - Education: $1,609,000
Education: $1,263,000
Water Utilities: $302,000
Transit Utilities: $24,000
- Long Term Debt - Beginning Outstanding - Unspecified Public Purpose: $12,361,000
Outstanding Unspecified Public Purpose: $11,528,000
Beginning Outstanding - Unspecified Public Purpose: $11,367,000
Outstanding Unspecified Public Purpose: $11,158,000
Retired Unspecified Public Purpose: $833,000
Retired Unspecified Public Purpose: $631,000
Issue, Unspecified Public Purpose: $422,000
- Miscellaneous - Rents: $1,506,000
Special Assessments: $1,151,000
Special Assessments: $1,105,000
General Revenue - Other: $590,000
General Revenue - Other: $430,000
Interest Earnings: $429,000
Interest Earnings: $318,000
Fines and Forfeits: $270,000
Fines and Forfeits: $239,000
Sale of Property: $32,000
Rents: $27,000
Donations From Private Sources: $1,000
- Other Capital Outlay - Regular Highways: $6,476,000
Regular Highways: $3,439,000
General - Other: $864,000
General - Other: $858,000
Solid Waste Management: $171,000
Solid Waste Management: $161,000
Corrections - Other: $154,000
Public Welfare - Other: $60,000
Judicial and Legal Services: $24,000
Central Staff Services: $20,000
- Other Funds - Cash and Securities: $40,389,000
Cash and Securities: $19,859,000
- Revenue - Electric Utilities: $359,000
Water Utilities: $339,000
Electric Utilities: $330,000
Water Utilities: $313,000
Transit Utilities: $2,000
- Short Term Debt Outstanding - Beginning: $5,000
End of Fiscal Year: $3,000
- Sinking Funds - Cash and Securities: $205,000
Cash and Securities: $190,000
- State Intergovernmental - Public Welfare: $15,162,000
Public Welfare: $13,239,000
Health and Hospitals: $12,983,000
Health and Hospitals: $9,141,000
Other: $9,026,000
Other: $7,011,000
Highways: $5,092,000
Education: $2,639,000
Highways: $2,478,000
Education: $2,276,000
Transit Utilities: $197,000
Transit Utilities: $104,000
General Local Government Support: $86,000
General Local Government Support: $84,000
Sewerage: $2,000
Sewerage: $1,000
- Tax - Other Selective Sales: $15,102,000
Other Selective Sales: $14,766,000
Property: $9,423,000
Property: $8,599,000
General Sales and Gross Receipts: $2,155,000
General Sales and Gross Receipts: $2,026,000
Occupation and Business License - Other: $726,000
Occupation and Business License - Other: $620,000
Other: $335,000
Public Utilities Sales: $175,000
Documentary and Stock Transfer: $151,000
Public Utilities Sales: $146,000
Documentary and Stock Transfer: $146,000
Other License: $4,000
Other License: $4,000
- Total Salaries and Wages: $2,080,000
: $1,737,000
Supplemental Security Income (SSI) in 2006:
- Total number of recipients: 591
- Number of aged recipients: 86
- Number of blind and disabled recipients: 505
- Number of recipients under 18: 46
- Number of recipients between 18 and 64: 401
- Number of recipients older than 64: 144
- Number of recipients also receiving OASDI: 305
- Amount of payments (thousands of dollars): 306
| Most common first names in Mariposa County, CA among deceased individuals | ||
| Name | Count | Lived (average) |
|---|---|---|
| William | 73 | 77.1 years |
| Robert | 72 | 74.0 years |
| John | 65 | 73.2 years |
| James | 59 | 73.9 years |
| George | 49 | 78.6 years |
| Mary | 48 | 80.3 years |
| Helen | 47 | 77.5 years |
| Charles | 45 | 80.3 years |
| Richard | 33 | 70.7 years |
| Dorothy | 30 | 80.3 years |
| Most common last names in Mariposa County, CA among deceased individuals | ||
| Last name | Count | Lived (average) |
|---|---|---|
| Johnson | 27 | 75.1 years |
| Jones | 26 | 77.1 years |
| Williams | 22 | 77.5 years |
| Anderson | 18 | 72.2 years |
| Smith | 16 | 78.3 years |
| Lewis | 16 | 74.5 years |
| Miller | 16 | 78.1 years |
| Taylor | 16 | 73.7 years |
| Peterson | 15 | 72.6 years |
| Brown | 15 | 79.0 years |
| Businesses in Mariposa County, CA | ||||
| Name | Count | Name | Count | |
|---|---|---|---|---|
| Best Western | 1 | Super 8 | 1 | |
| Comfort Inn | 1 | True Value | 3 | |
| FedEx | 1 | U-Haul | 1 | |
| GNC | 1 | UPS | 2 | |
| H&R Block | 1 | Vans | 2 | |
| SAS Shoes | 1 | |||
Mariposa County on our top lists:
- #1 on the list of "Top 101 counties with the highest Ozone (1-hour) air pollution readings in 2012 (ppm)"
- #58 on the list of "Top 101 counties with highest percentage of residents voting for 3rd party candidates in the 2012 Presidential Election"