McHenry County, Illinois (IL)
County owner-occupied free and clear houses and condos in 2010: 16,501
County owner-occupied houses and condos in 2000: 74,324
Renter-occupied apartments: 18,477 (it was 15,079 in 2000)
| % of renters here: | 17% |
| State: | 33% |
Land area: 604 sq. mi.
Water area: 7.6 sq. mi.
Population density: 517 people per square mile (high).
Industries providing employment: Educational, health and social services (19.9%), Manufacturing (16.1%), Retail trade (11.8%), Professional, scientific, management, administrative, and waste management services (11.5%).
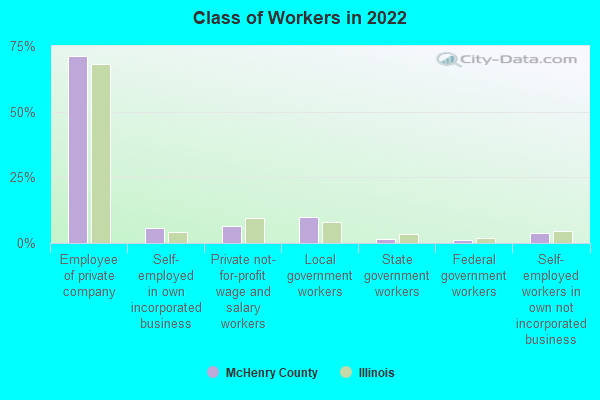
Type of workers:
- Private wage or salary: 83%
- Government: 13%
- Self-employed, not incorporated: 4%
- Unpaid family work: 0%
- OSM Map
- General Map
- Google Map
- MSN Map

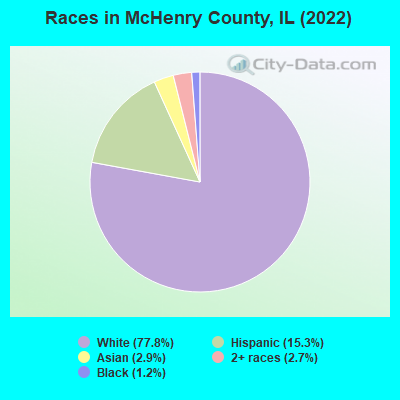
- 242,56077.8%White Non-Hispanic Alone
- 47,56215.3%Hispanic or Latino
- 9,1812.9%Asian alone
- 8,4982.7%Two or more races
- 3,6691.2%Black Non-Hispanic Alone
- 1580.05%American Indian and Alaska Native alone
- 1190.04%Some other race alone
| Median resident age: | 41.3 years |
| Illinois median age: | 39.1 years |
| Males: 156,659 | |
| Females: 155,088 |

 | Libertyville OR Highwood? (28 replies) |
| Moving to Illinois...literally anywhere but Chicago or it’s suburbs (52 replies) |
| Overrated and underrated suburbs Chicago (110 replies) |
| Gentrification in Chinatown (80 replies) |
| Mt Greenwood or Jefferson Park (68 replies) |
| Restaurants cited in Chicago during Covid (39 replies) |
| McHenry County: | 2.0 people |
| Illinois: | 3 people |
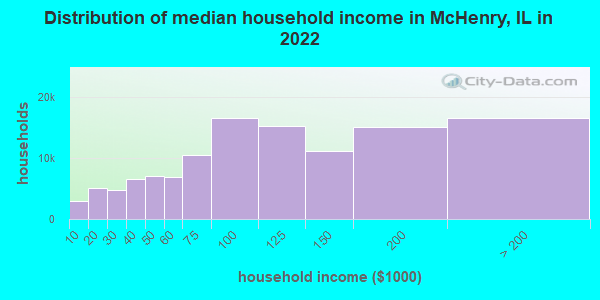
Estimated median household income in 2022: $98,907 ($64,826 in 1999)
| This county: | $98,907 |
| Illinois: | $76,708 |
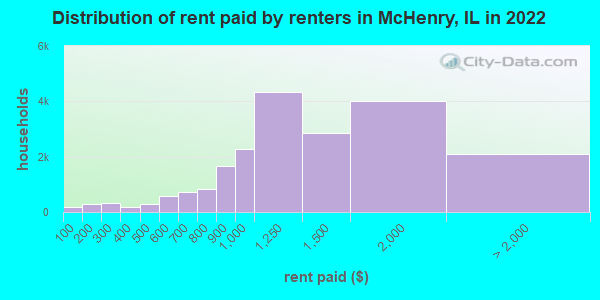
Median contract rent in 2022 for apartments: $997 (lower quartile is $830, upper quartile is $1,340)
| This county: | $997 |
| State: | $1008 |
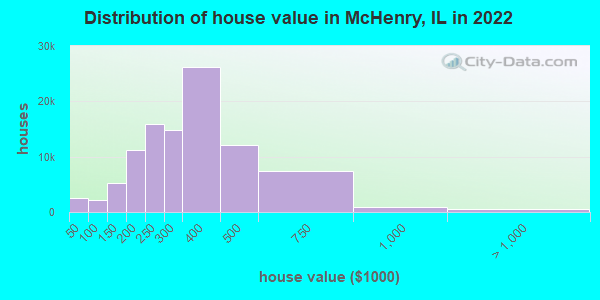
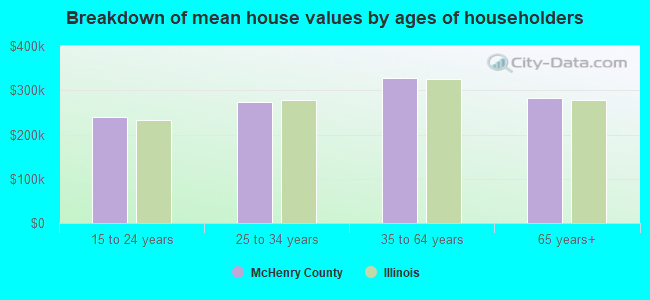
Estimated median house or condo value in 2022: $292,400 (it was $167,400 in 2000)
| McHenry: | $292,400 |
| Illinois: | $251,600 |
Mean price in 2022:
Median monthly housing costs for homes and condos with a mortgage: $1,951Detached houses: $311,267
Here: $311,267 State: $310,164 Townhouses or other attached units: $212,657
Here: $212,657 State: $286,230 In 2-unit structures: $217,098
Here: $217,098 State: $299,638 In 3-to-4-unit structures: $160,017
Here: $160,017 State: $330,907 In 5-or-more-unit structures: $112,491
Here: $112,491 State: $318,887 Mobile homes: $106,276
Here: $106,276 State: $78,855 Occupied boats, RVs, vans, etc.: $87,058
Here: $87,058 State: $171,856
Median monthly housing costs for units without a mortgage: $901
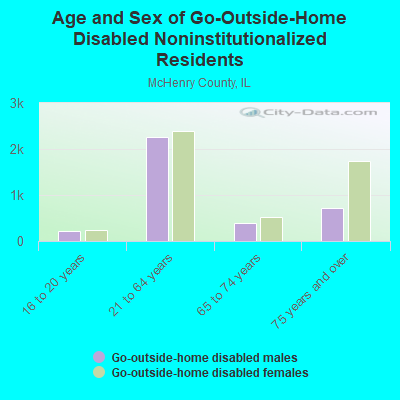
Institutionalized population: 1,337
Crime in 2020 (reported by the sheriff's office or county police, not the county total):
- Murders: 1
- Rapes: 21
- Robberies: 0
- Assaults: 44
- Burglaries: 58
- Thefts: 162
- Auto thefts: 19
Crime in 2019 (reported by the sheriff's office or county police, not the county total):
- Murders: 1
- Rapes: 17
- Robberies: 3
- Assaults: 44
- Burglaries: 63
- Thefts: 179
- Auto thefts: 15
Health of residents in McHenry County based on CDC Behavioral Risk Factor Surveillance System Survey Questionnaires from 2013 to 2021:
General health status score of residents in this county from 1 (poor) to 5 (excellent) is 3.5. This is about average.73.0% of residents exercised in the past month. This is about average.
40.5% of residents smoked 100+ cigarettes in their lives. This is less than average.
58.1% of adult residents drank alcohol in the past 30 days. This is less than average.
68.0% of residents visited a dentist within the past year. This is about average.
Average weight of males is 197 pounds. This is about average.
Average weight of females is 164 pounds. This is about average.
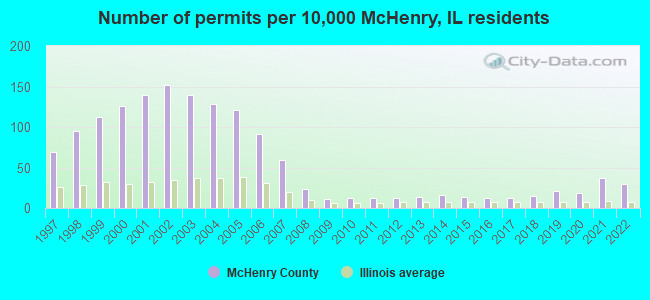
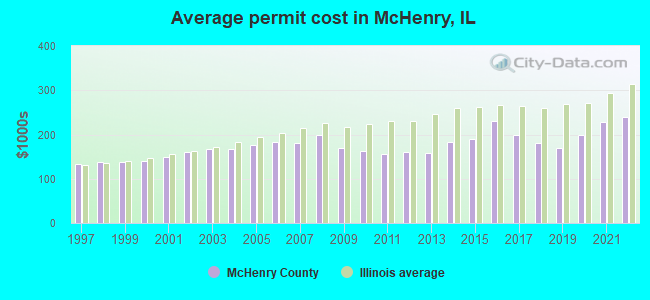
Single-family new house construction building permits:
- 2022: 789 buildings, average cost: $238,500
- 2021: 959 buildings, average cost: $228,200
- 2020: 495 buildings, average cost: $199,900
- 2019: 559 buildings, average cost: $168,600
- 2018: 398 buildings, average cost: $180,000
- 2017: 304 buildings, average cost: $197,600
- 2016: 305 buildings, average cost: $231,000
- 2015: 337 buildings, average cost: $189,800
- 2014: 405 buildings, average cost: $182,600
- 2013: 358 buildings, average cost: $159,200
- 2012: 301 buildings, average cost: $161,100
- 2011: 307 buildings, average cost: $156,700
- 2010: 301 buildings, average cost: $161,600
- 2009: 287 buildings, average cost: $170,000
- 2008: 587 buildings, average cost: $197,800
- 2007: 1536 buildings, average cost: $180,400
- 2006: 2357 buildings, average cost: $183,700
- 2005: 3136 buildings, average cost: $175,900
- 2004: 3347 buildings, average cost: $166,900
- 2003: 3644 buildings, average cost: $168,200
- 2002: 3943 buildings, average cost: $160,900
- 2001: 3627 buildings, average cost: $149,200
- 2000: 3269 buildings, average cost: $138,900
- 1999: 2905 buildings, average cost: $138,000
- 1998: 2483 buildings, average cost: $136,900
- 1997: 1798 buildings, average cost: $132,900
Median real estate property taxes paid for housing units with mortgages in 2022: $6,820 (2.3%)
Median real estate property taxes paid for housing units with no mortgage in 2022: $6,410 (2.2%)
| McHenry County: | 5.5% |
| Illinois: | 11.9% |
Median age of residents in 2022: 41.3 years old
(Males: 39.9 years old, Females: 42.1 years old)
(Median age for: White residents: 44.3 years old, Black residents: 29.8 years old, American Indian residents: 55.8 years old, Asian residents: 44.5 years old, Hispanic or Latino residents: 27.0 years old, Other race residents: 31.5 years old)
Area name: Chicago-Naperville-Joliet, IL HUD Metro FMR Area
Fair market rent in 2006 for a 1-bedroom apartment in McHenry County is $802 a month.
Fair market rent for a 2-bedroom apartment is $901 a month.
Fair market rent for a 3-bedroom apartment is $1102 a month.
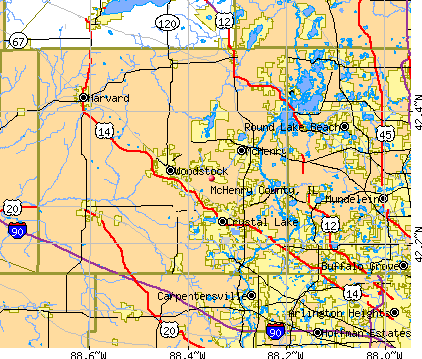
Cities in this county include: Crystal Lake, Algonquin, Lake in the Hills, McHenry, Woodstock, Cary, Harvard, Wonder Lake, Marengo, Huntley.
2023 air pollution in McHenry County:
Ozone (1-hour): 0.038 ppm (standard limit: 0.12 ppm). Near U.S. average.
Particulate Matter (PM2.5) Annual: 11.6 µg/m3(standard limit: 15.0 µg/m3). Above U.S. average.
Notable locations in this county outside city limits:
Notable locations in McHenry County: Johnson Farms (A), Hillcrest Farm (B), Kinnikinnick Farms (C), Worley Farms (D), Gray Farms (E), Camp Epworth (F), Grange Hall (G), Boone County Rural Fire Protection District 2 Station 2 (H), Nystrom's Nursery (I), Stonegate Nursery (J). Display/hide their locations on the map
Churches in McHenry County include: Open Bible Church (A), Church of the Nazarene (B), Flora Church (C), Jefferson Prairie Church (D), Manchester Church (E). Display/hide their locations on the map
Cemeteries: Andrus Cemetery (1), Bamblett Cemetery (2), Belvidere Cemetery (3), Bloods Point Cemetery (4), Burr Oak Cemetery (5), Lawrenceville Cemetery (6), Livingston Cemetery (7). Display/hide their locations on the map
Reservoir: Candlewick Lake (A). Display/hide its location on the map
Creeks: Mud Creek (A), Meander Creek (B), Mosquito Creek (C), Beaver Creek (D), Coon Creek (E), Piscasaw Creek (F), Geryune Creek (G). Display/hide their locations on the map
Parks in McHenry County include: Flora Prairie Nature Preserve (1), Kinnikinnick Creek Nature Preserve (2), Boone County Fair Grounds (3). Display/hide their locations on the map
Neighboring counties: Cook County  , Jerome County, Idaho
  , Oneida County, Idaho , Lake County
  , Racine County, Wisconsin
  , Story County, Iowa .
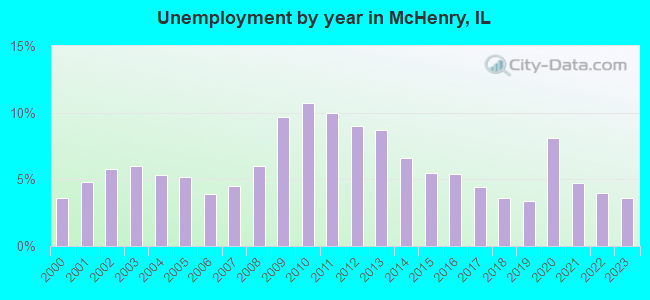
| Here: | 3.6% |
| Illinois: | 4.2% |
Current college students: 12,583
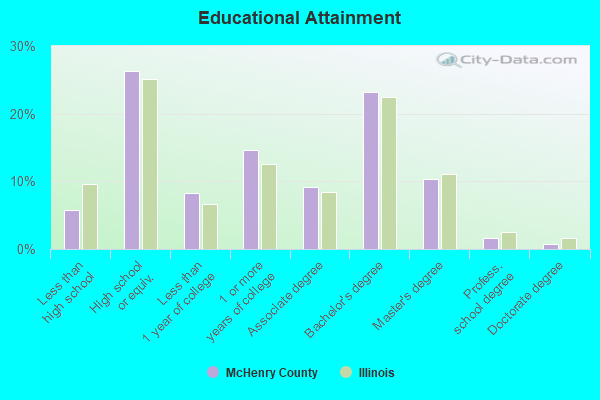
People 25 years of age or older with a high school degree or higher: 94.3%
People 25 years of age or older with a bachelor's degree or higher: 35.9%
Number of foreign born residents: 30,211 (56.4% naturalized citizens)
| McHenry County: | 9.7% |
| Whole state: | 14.4% |
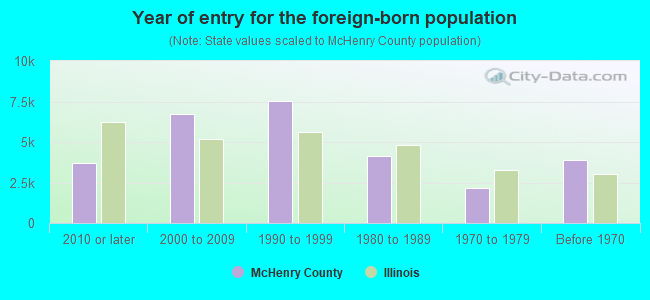
- Year of entry for the foreign-born population
- 3,7262010 or later
- 6,7132000 to 2009
- 7,5481990 to 1999
- 4,1191980 to 1989
- 2,1311970 to 1979
- 3,900Before 1970
Mean travel time to work (commute): minutes
Percentage of county residents living and working in this county: 97.8%
Housing units in structures:
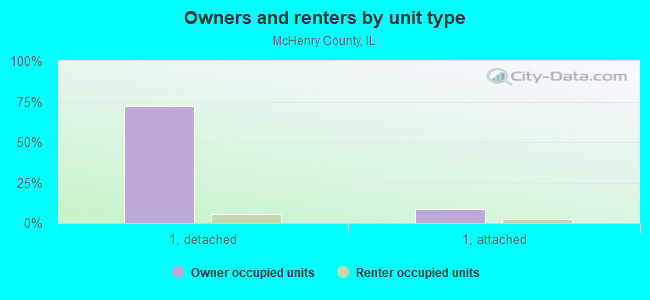
- One, detached: 92,819
- One, attached: 12,868
- Two: 1,903
- 3 or 4: 3,410
- 5 to 9: 4,893
- 10 to 19: 1,784
- 20 to 49: 1,169
- 50 or more: 1,896
- Mobile homes: 708
Housing units in McHenry County with a mortgage: 68,763 (5,528 second mortgage, 72 home equity loan, 4,827 both second mortgage and home equity loan)
Houses without a mortgage: 1,873
| Here: | 98.6% with mortgage |
| State: | 97.4% with mortgage |
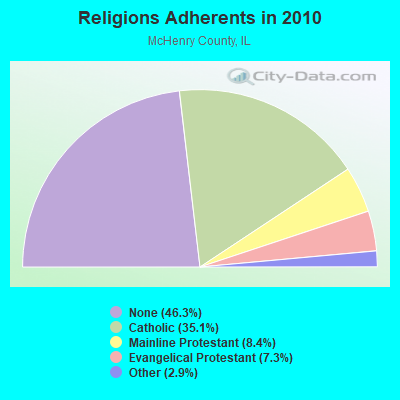
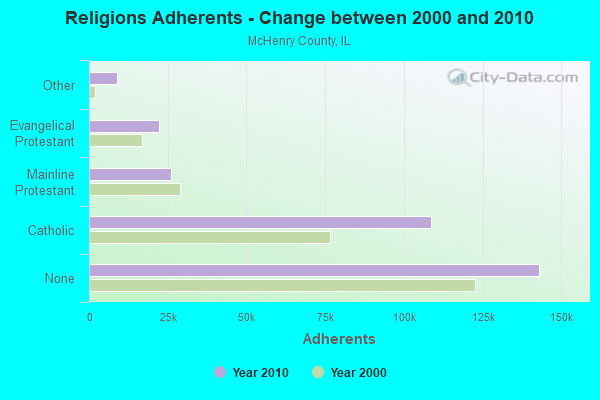
Religion statistics for McHenry County
| Religion | Adherents | Congregations |
|---|---|---|
| Catholic | 108,465 | 17 |
| Mainline Protestant | 25,985 | 46 |
| Evangelical Protestant | 22,386 | 76 |
| Other | 8,809 | 20 |
| Orthodox | 54 | 1 |
| None | 143,061 | - |
Source: Clifford Grammich, Kirk Hadaway, Richard Houseal, Dale E.Jones, Alexei Krindatch, Richie Stanley and Richard H.Taylor. 2012. 2010 U.S.Religion Census: Religious Congregations & Membership Study. Association of Statisticians of American Religious Bodies. Jones, Dale E., et al. 2002. Congregations and Membership in the United States 2000. Nashville, TN: Glenmary Research Center.
Food Environment Statistics:
| McHenry County: | 1.40 / 10,000 pop. |
| State: | 2.24 / 10,000 pop. |
| Here: | 0.13 / 10,000 pop. |
| Illinois: | 0.08 / 10,000 pop. |
| This county: | 0.76 / 10,000 pop. |
| Illinois: | 0.75 / 10,000 pop. |
| McHenry County: | 2.03 / 10,000 pop. |
| Illinois: | 2.61 / 10,000 pop. |
| This county: | 6.29 / 10,000 pop. |
| State: | 6.86 / 10,000 pop. |
| McHenry County: | 6.8% |
| Illinois: | 8.3% |
| McHenry County: | 26.5% |
| State: | 25.2% |
| Here: | 17.7% |
| State: | 14.5% |
Agriculture in McHenry County:
Average size of farms: 268 acresAverage value of agricultural products sold per farm: $105,306
Average value of crops sold per acre for harvested cropland: $340.50
The value of nursery, greenhouse, floriculture, and sod as a percentage of the total market value of agricultural products sold: 26.79%
The value of livestock, poultry, and their products as a percentage of the total market value of agricultural products sold: 24.69%
Average total farm production expenses per farm: $102,962
Harvested cropland as a percentage of land in farms: 86.80%
Irrigated harvested cropland as a percentage of land in farms: 3.45%
Average market value of all machinery and equipment per farm: $94,750
The percentage of farms operated by a family or individual: 82.07%
Average age of principal farm operators: 56 years
Average number of cattle and calves per 100 acres of all land in farms: 7.92
Milk cows as a percentage of all cattle and calves: 25.62%
Corn for grain: 96978 harvested acres
All wheat for grain: 3396 harvested acres
Soybeans for beans: 77340 harvested acres
Vegetables: 2,179 harvested acres
Land in orchards: 332 acres
Tornado activity:
McHenry County historical area-adjusted tornado activity is significantly below Illinois state average. It is 4323192.1 times below overall U.S. average.Tornadoes in this county have caused 24 fatalities and 455 injuries recorded between 1950 and 2004.
On 4/21/1967, a category 4 (max. wind speeds 207-260 mph) tornado killed 24 people and injured 450 people and caused between $50,000 and $500,000 in damages.
Earthquake activity:
McHenry County-area historical earthquake activity is significantly above Illinois state average. It is 39% greater than the overall U.S. average.On 4/18/2008 at 09:36:59, a magnitude 5.4 (5.1 MB, 4.8 MS, 5.4 MW, 5.2 MW, Class: Moderate, Intensity: VI - VII) earthquake occurred 267.0 miles away from McHenry County center
On 6/10/1987 at 23:48:54, a magnitude 5.1 (4.9 MB, 4.4 MS, 4.6 MS, 5.1 LG) earthquake occurred 241.6 miles away from the county center
On 6/28/2004 at 06:10:52, a magnitude 4.2 (4.2 MW, Depth: 6.2 mi, Class: Light, Intensity: IV - V) earthquake occurred 64.3 miles away from the county center
On 4/18/2008 at 09:36:59, a magnitude 5.2 (5.2 MW, Depth: 8.9 mi) earthquake occurred 267.1 miles away from the county center
On 2/10/2010 at 09:59:35, a magnitude 3.8 (3.8 MW, Depth: 6.2 mi, Class: Light, Intensity: II - III) earthquake occurred 23.8 miles away from McHenry County center
On 5/2/2015 at 16:23:07, a magnitude 4.2 (4.2 MW, Depth: 2.8 mi) earthquake occurred 149.8 miles away from the county center
Magnitude types: regional Lg-wave magnitude (LG), body-wave magnitude (MB), surface-wave magnitude (MS), moment magnitude (MW)
Most recent natural disasters:
- Illinois Covid-19 Pandemic, Incident Period: January 20, 2020, FEMA Id: 4489, Natural disaster type: Other
- Illinois Severe Storms, Straight-Line Winds and Flooding, Incident Period: April 16, 2013 to May 05, 2013, Major Disaster (Presidential) Declared DR-4116: May 10, 2013, FEMA Id: 4116, Natural disaster type: Storm, Flood, Wind
- Illinois Severe Winter Storm and Snowstorm, Incident Period: January 31, 2011 to February 03, 2011, Major Disaster (Presidential) Declared DR-1960: March 17, 2011, FEMA Id: 1960, Natural disaster type: Snowstorm, Winter Storm
- Illinois Snow, Incident Period: February 05, 2008 to February 06, 2008, Emergency Declared EM-3283: March 13, 2008, FEMA Id: 3283, Natural disaster type: Snow
- Illinois Snow, Incident Period: November 30, 2006 to December 01, 2006, Emergency Declared EM-3269: December 29, 2006, FEMA Id: 3269, Natural disaster type: Snow
- Illinois Hurricane Katrina Evacuation, Incident Period: August 29, 2005 to October 01, 2005, Emergency Declared EM-3230: September 07, 2005, FEMA Id: 3230, Natural disaster type: Hurricane
- Illinois Severe Winter Storm, Incident Period: December 11, 2000 to December 31, 2000, Emergency Declared EM-3161: January 17, 2001, FEMA Id: 3161, Natural disaster type: Winter Storm
- Illinois Winter Snow Storm, Incident Period: January 01, 1999 to January 15, 1999, Emergency Declared EM-3134: January 08, 1999, FEMA Id: 3134, Natural disaster type: Storm, Snow
- Illinois Flooding, Severe Storms, Incident Period: April 13, 1993 to October 22, 1993, Major Disaster (Presidential) Declared DR-997: July 09, 1993, FEMA Id: 997, Natural disaster type: Storm, Flood
- Illinois SEVERE STORMS, FLOODING, Incident Period: September 21, 1986 to October 15, 1986, Major Disaster (Presidential) Declared DR-776: October 07, 1986, FEMA Id: 776, Natural disaster type: Storm, Flood
- 5 other natural disasters have been reported since 1953.
The number of natural disasters in McHenry County (15) is near the US average (15).
Major Disasters (Presidential) Declared: 8
Emergencies Declared: 6
Causes of natural disasters: Storms: 7, Floods: 6, Snows: 3, Snowstorms: 2, Tornadoes: 2, Winter Storms: 2, Blizzard: 1, Hurricane: 1, Wind: 1, Other: 1 (Note: some incidents may be assigned to more than one category).
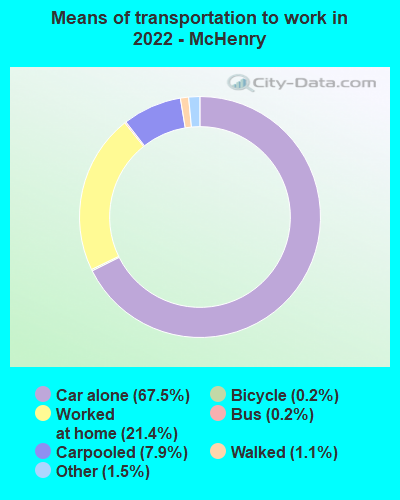
Means of transportation to work:
- Drove a car alone: 85,868 (67.5%)
- Carpooled: 10,085 (7.9%)
- Bus: 236 (0.2%)
- Long-distance train or commuter rail: 91 (0.1%)
- Ferryboat: 76 (0.1%)
- Taxicab, motorcycle, or other means: 1,944 (1.5%)
- Bicycle: 217 (0.2%)
- Walked: 1,434 (1.1%)
- Worked at home: 27,275 (21.4%)

- Health care and social assistance (19%)
- Manufacturing (10%)
- Educational services (10%)
- Retail trade (10%)
- Professional, scientific, and technical services (7%)
- Other services, except public administration (6%)
- Finance and insurance (6%)
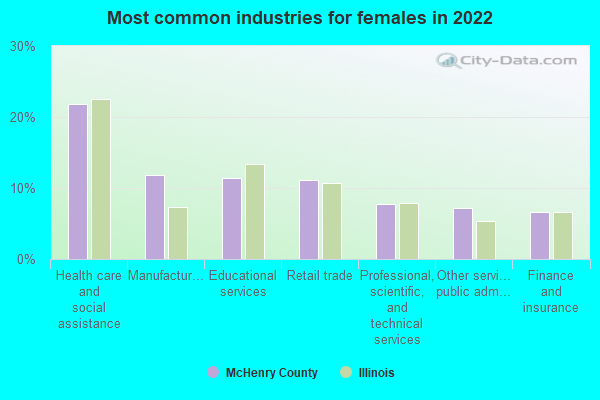
- Health care and social assistance (22%)
- Manufacturing (12%)
- Educational services (11%)
- Retail trade (11%)
- Professional, scientific, and technical services (8%)
- Other services, except public administration (7%)
- Finance and insurance (7%)
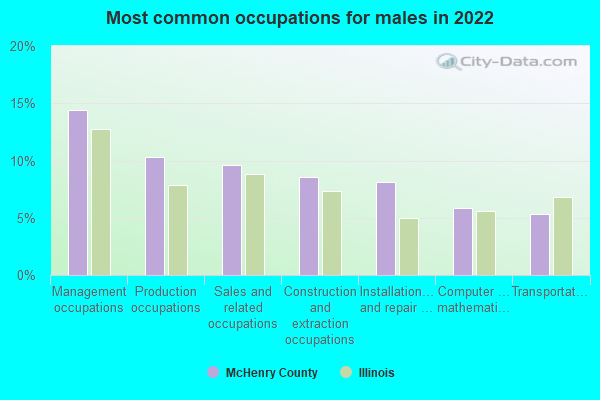
- Management occupations (14%)
- Production occupations (10%)
- Sales and related occupations (10%)
- Construction and extraction occupations (9%)
- Installation, maintenance, and repair occupations (8%)
- Computer and mathematical occupations (6%)
- Transportation occupations (5%)
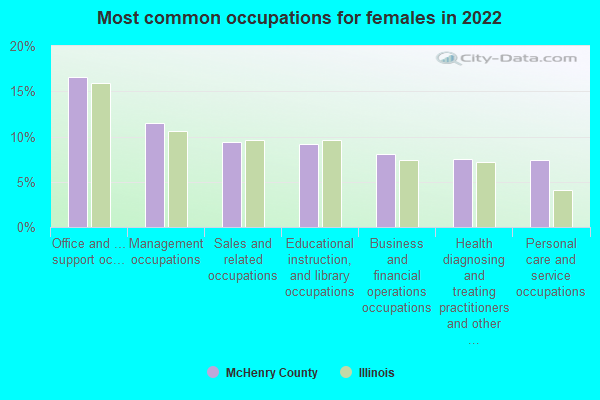
- Office and administrative support occupations (17%)
- Management occupations (12%)
- Sales and related occupations (9%)
- Educational instruction, and library occupations (9%)
- Business and financial operations occupations (8%)
- Health diagnosing and treating practitioners and other technical occupations (8%)
- Personal care and service occupations (7%)
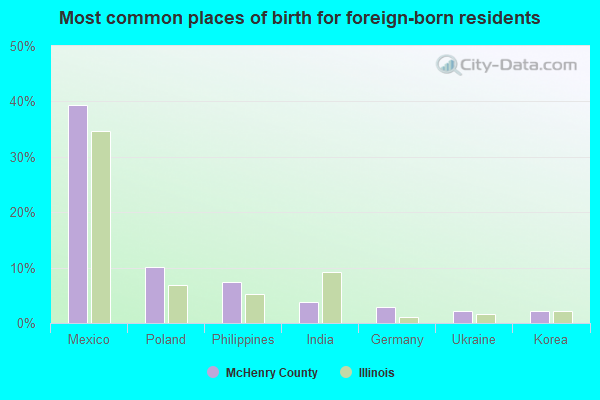
- Mexico (39%)
- Poland (10%)
- Philippines (7%)
- India (4%)
- Germany (3%)
- Ukraine (2%)
- Korea (2%)
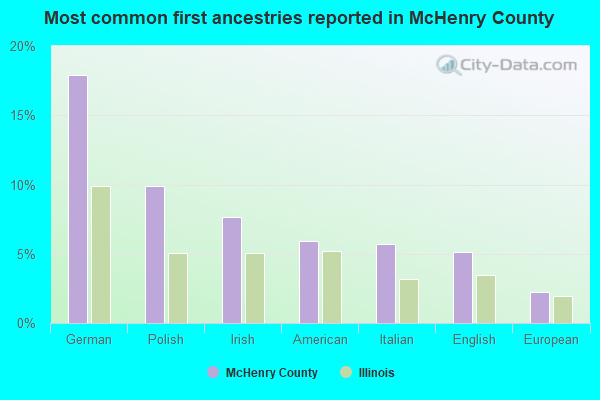
- German (18%)
- Polish (10%)
- Irish (8%)
- American (6%)
- Italian (6%)
- English (5%)
- European (2%)
People in group quarters in McHenry County, Illinois in 2010:
- 791 people in nursing facilities/skilled-nursing facilities
- 537 people in local jails and other municipal confinement facilities
- 124 people in emergency and transitional shelters (with sleeping facilities) for people experiencing homelessness
- 114 people in group homes intended for adults
- 60 people in residential treatment centers for adults
- 10 people in other noninstitutional facilities
- 9 people in in-patient hospice facilities
- 2 people in workers' group living quarters and job corps centers
People in group quarters in McHenry County, Illinois in 2000:
- 799 people in nursing homes
- 307 people in local jails and other confinement facilities (including police lockups)
- 185 people in other nonhousehold living situations
- 122 people in homes for the mentally retarded
- 49 people in other noninstitutional group quarters
- 24 people in religious group quarters
- 21 people in homes for the mentally ill
- 12 people in agriculture workers' dormitories on farms
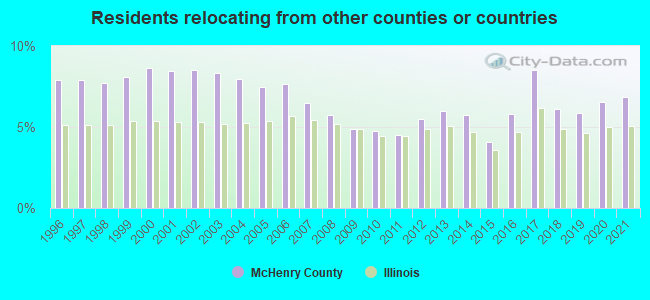
6.83% of this county's 2021 resident taxpayers lived in other counties in 2020 ($74,827 average adjusted gross income)
| Here: | 6.83% |
| Illinois average: | 5.09% |
10 or fewer of this county's residents moved from foreign countries.
5.27% relocated from other counties in Illinois ($55,604 average AGI)
1.57% relocated from other states ($19,223 average AGI)
McHenry County: 1.57% Illinois average: 2.01%
Top counties from which taxpayers relocated into this county between 2020 and 2021:
| from Cook County, IL | |
| from Lake County, IL | |
| from Kane County, IL | |
| from DuPage County, IL | |
| from Walworth County, WI | |
| from Winnebago County, IL | |
| from Boone County, IL |
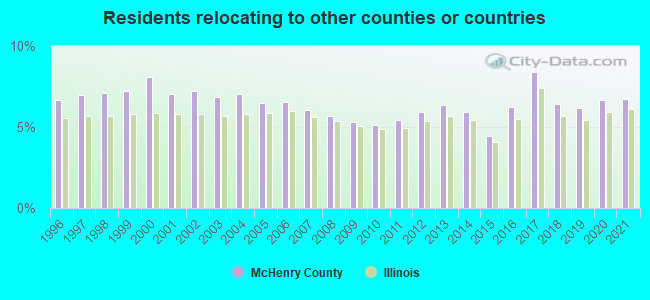
6.72% of this county's 2020 resident taxpayers moved to other counties in 2021 ($80,532 average adjusted gross income)
| Here: | 6.72% |
| Illinois average: | 6.10% |
10 or fewer of this county's residents moved to foreign countries.
3.58% relocated to other counties in Illinois ($32,663 average AGI)
3.15% relocated to other states ($47,869 average AGI)
McHenry County: 3.15% Illinois average: 3.06%
Top counties to which taxpayers relocated from this county between 2020 and 2021:
| to Cook County, IL | |
| to Lake County, IL | |
| to Kane County, IL | |
| to DuPage County, IL | |
| to Walworth County, WI | |
| to Boone County, IL | |
| to Winnebago County, IL |
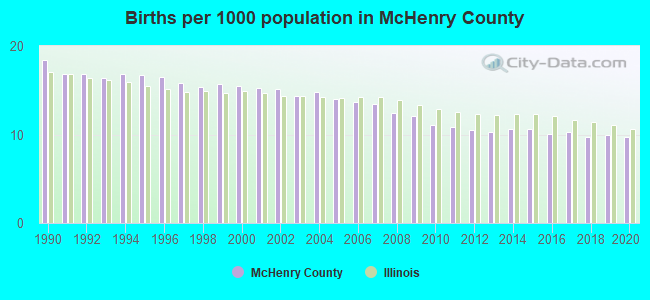
Births per 1000 population from 1990 to 1999: 16.5
Births per 1000 population from 2000 to 2009: 14.1
Births per 1000 population from 2010 to 2022: 8.8
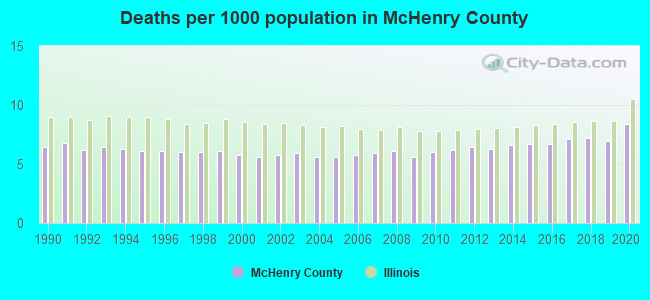
Deaths per 1000 population from 1990 to 1999: 6.2
Deaths per 1000 population from 2000 to 2009: 5.8
Deaths per 1000 population from 2010 to 2020: 6.8
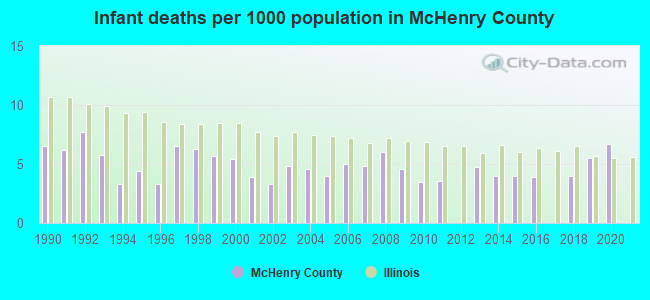
Infant deaths per 1000 live births from 1990 to 1999: 5.6
Infant deaths per 1000 live births from 2000 to 2009: 4.6
Infant deaths per 1000 live births from 2010 to 2021: 3.3
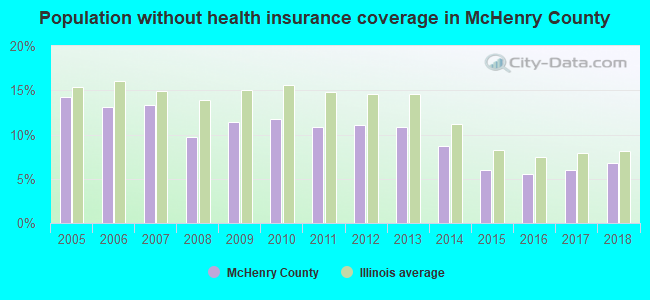
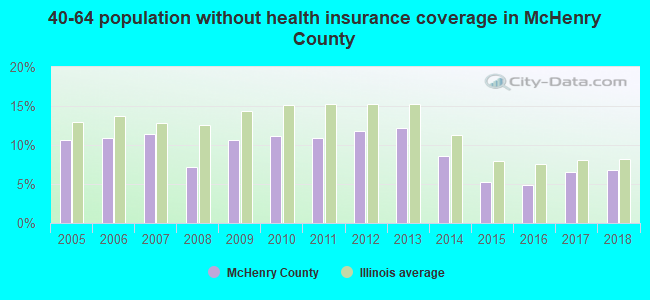
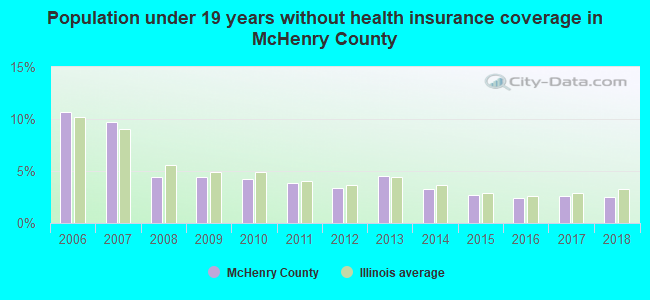
Persons under 19 years old without health insurance coverage in 2018: 2.5%
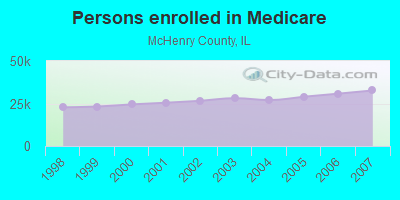
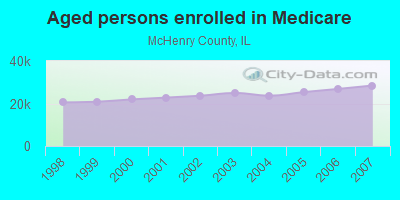
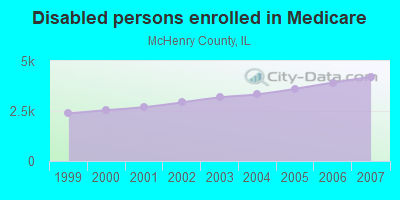
Persons enrolled in hospital insurance and/or supplemental medical insurance (Medicare) in July 1, 2007: 32,666 (28,455 aged, 4,211 disabled)
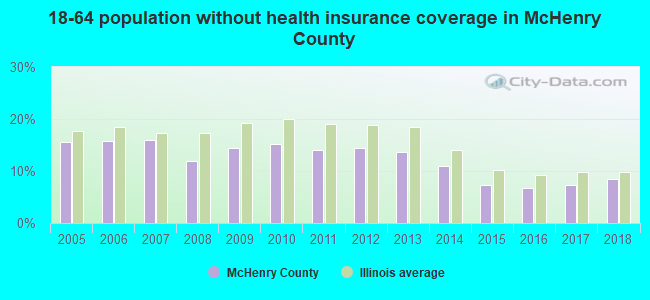
Children under 18 without health insurance coverage in 2007: 6,179 (7%)
Most common underlying causes of death in McHenry County, Illinois in 1999 - 2019:
- Atherosclerotic heart disease (2,988)
- Bronchus or lung, unspecified - Malignant neoplasms (2,661)
- Chronic obstructive pulmonary disease, unspecified (1,651)
- Acute myocardial infarction, unspecified (1,637)
- Unspecified dementia (1,419)
- Alzheimer disease, unspecified (1,168)
- Congestive heart failure (1,120)
- Stroke, not specified as haemorrhage or infarction (1,075)
- Breast, unspecified - Malignant neoplasms (793)
- Colon, unspecified - Malignant neoplasms (725)
Population without health insurance coverage in 2000: 10%
Children under 18 without health insurance coverage in 2000: 8%
Short term general hospital admissions per 100,000 population in 2004: 7,125
Short term general hospital beds per 100,000 population in 2004: 120
Emergency room visits per 100,000 population in 2004: 23,094
General practice office based MDs per 100,000 population in 2005: 1,424
Medical specialist MDs per 100,000 population in 2005: 541
Dentists per 100,000 population in 1998: 7
Total births per 100,000 population, July 2005 - July 2006 : 63
Total deaths per 100,000 population, July 2005 - July 2006: 72
Limited-service eating places per 100,000 population in 2005 : 16
Beer, wine & liquor stores per 100,000 population in 2005: 1
Homicides per 1,000,000 population from 2000 to 2006: 14.5. This is less than state average.
Suicides per 1,000,000 population from 2000 to 2006: 71.5. This is less than state average.
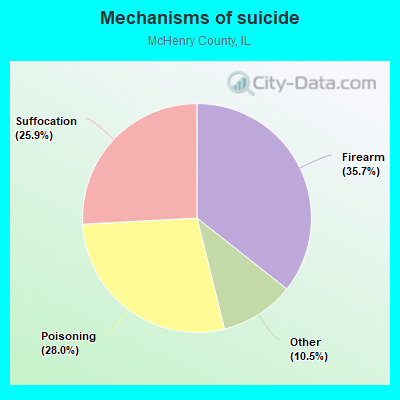
- Firearm - 25.5
- Poisoning - 20.0
- Suffocation - 18.5
- Other - 7.5
Household type by relationship:
Households: 311,747- Male householders: 58,880 (12,679 living alone), Female householders: 59,407 (16,246 living alone)
65,986 spouses (65,743 opposite-sex spouses), 7,781 unmarried partners, (7,518 opposite-sex unmarried partners), 98,665 children (94,813 natural, 1,223 adopted, 2,629 stepchildren), 3,486 grandchildren, 2,093 brothers or sisters, 3,991 parents, 282 foster children, 3,865 other relatives, 5,503 non-relatives
- In group quarters: 1,808
Size of family households: 33,313 2-persons, 17,849 3-persons, 19,873 4-persons, 7,551 5-persons, 2,306 6-persons, 1,595 7-or-more-persons.
Size of nonfamily households: 28,925 1-person, 5,941 2-persons, 525 3-persons, 364 4-persons, 45 7-or-more-persons.
51,985 married couples with children.
12,272 single-parent households (2,884 men, 9,388 women).
84.9% of residents of McHenry speak English at home.
9.4% of residents speak Spanish at home (66% speak English very well, 19% speak English well, 12% speak English not well, 3% don't speak English at all).
3.6% of residents speak other Indo-European language at home (71% speak English very well, 17% speak English well, 9% speak English not well, 2% don't speak English at all).
1.5% of residents speak Asian or Pacific Island language at home (68% speak English very well, 22% speak English well, 7% speak English not well, 3% don't speak English at all).
0.3% of residents speak other language at home (94% speak English very well, 6% speak English well).
In fiscal year 2004:
Federal Government expenditure: $750,571,000 ($2,532 per capita)
Department of Defense expenditure: $25,004,000
Federal direct payments to individuals for retirement and disability: $455,171,000
Federal other direct payments to individuals: $161,219,000
Federal direct payments not to individuals: $9,996,000
Federal grants: $63,624,000
Federal procurement contracts: $23,285,000 ($13,390,000 Department of Defense)
Federal salaries and wages: $37,276,000 ($318,000 Department of Defense)
Federal Government direct loans: $1,104,000
Federal guaranteed/insured loans: $352,340,000
Federal Government insurance: $235,677,000
Population change from April 1, 2000 to July 1, 2005:
Births: 21,433| Here: | 71 per 1000 residents |
| State: | 75 per 1000 residents |
Deaths: 8,440
| Here: | 28 per 1000 residents |
| State: | 43 per 1000 residents |
Net international migration: +4,168
| Here: | +14 per 1000 residents |
| State: | +26 per 1000 residents |
Net internal migration: +25,326
| Here: | |
| State: |
Total withdrawal of fresh water for public supply: 20.66 millions of gallons per day (all from ground)
| Here: | 7.2 |
| State: | 6.4 |
| Here: | 4.2 |
| State: | 4.1 |
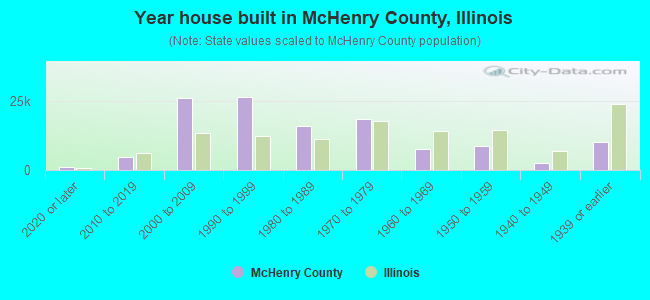
- Year house built in McHenry County, Illinois
- 9122020 or later
- 4,6572010 to 2019
- 26,0642000 to 2009
- 26,3271990 to 1999
- 15,9761980 to 1989
- 18,4071970 to 1979
- 7,4501960 to 1969
- 8,8111950 to 1959
- 2,5701940 to 1949
- 10,2761939 or earlier
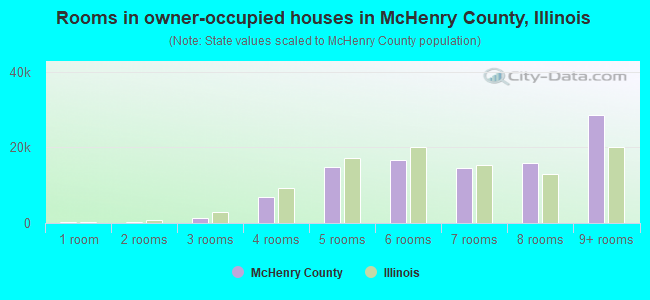
- Rooms in owner-occupied houses in McHenry County, Illinois
- 3131 room
- 1552 rooms
- 1,2063 rooms
- 6,8584 rooms
- 14,7765 rooms
- 16,5416 rooms
- 14,6147 rooms
- 15,8488 rooms
- 28,5269+ rooms
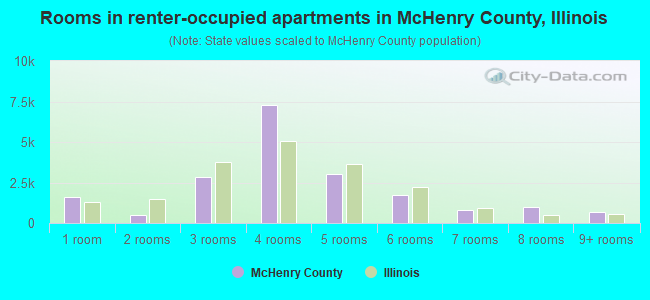
- Rooms in renter-occupied apartments in McHenry County, Illinois
- 1,6161 room
- 4792 rooms
- 2,8533 rooms
- 7,2944 rooms
- 3,0365 rooms
- 1,7306 rooms
- 7877 rooms
- 9708 rooms
- 6859+ rooms
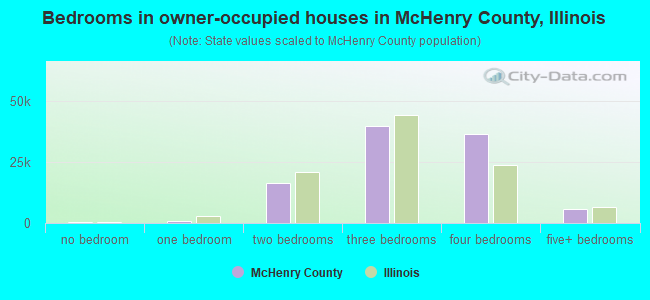
- Bedrooms in owner-occupied houses in McHenry County, Illinois
- 313no bedroom
- 7371 bedroom
- 16,3272 bedrooms
- 39,4663 bedrooms
- 36,2724 bedrooms
- 5,7225+ bedrooms
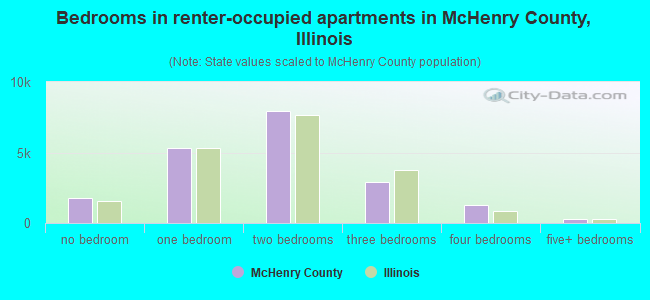
- Bedrooms in renter-occupied apartments in McHenry County, Illinois
- 1,740no bedroom
- 5,3321 bedroom
- 7,9422 bedrooms
- 2,8963 bedrooms
- 1,2714 bedrooms
- 2695+ bedrooms
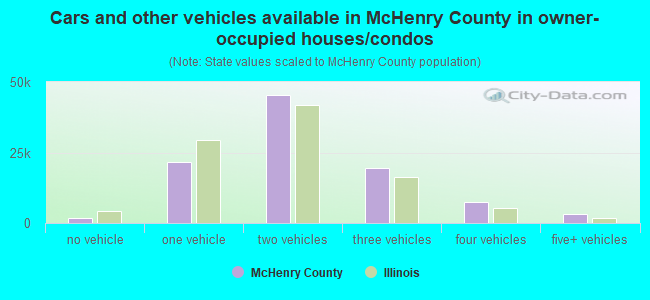
- Cars and other vehicles available in McHenry County in owner-occupied houses/condos
- 1,799no vehicle
- 21,7371 vehicle
- 45,4372 vehicles
- 19,4893 vehicles
- 7,3034 vehicles
- 3,0725+ vehicles
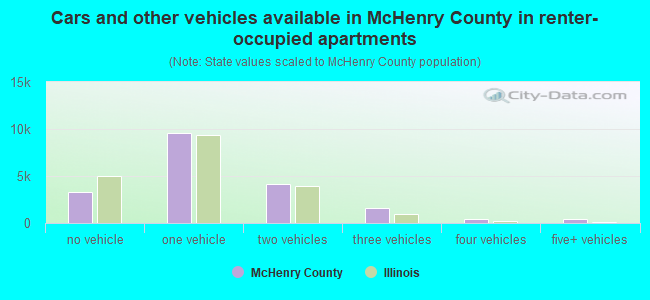
- Cars and other vehicles available in McHenry County in renter-occupied apartments
- 3,340no vehicle
- 9,6101 vehicle
- 4,1232 vehicles
- 1,5903 vehicles
- 4064 vehicles
- 3815+ vehicles
91.6% of McHenry County residents lived in the same house 1 years ago.
Out of people who lived in different houses, 31% lived in this county.
Out of people who lived in different counties, 82% lived in Illinois.
| McHenry County: | 91.6% |
| State average: | 88.3% |
Place of birth for U.S.-born residents:
- This state: 230,624
- Other state: 48,340
- Northeast: 7,532
- Midwest: 25,508
- South: 7,563
- West: 7,737
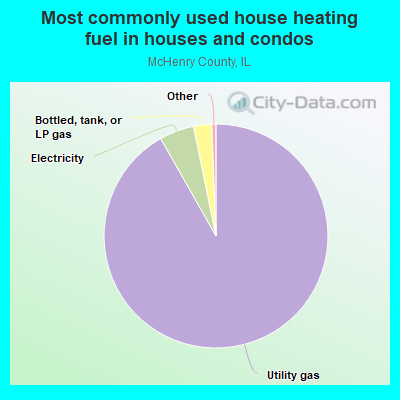
- 91.8%Utility gas
- 5.0%Electricity
- 2.6%Bottled, tank, or LP gas
- 0.2%Wood
- 0.1%Solar energy
- 0.1%Other fuel
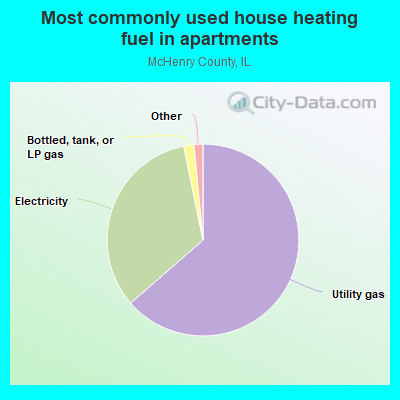
- 63.6%Utility gas
- 33.2%Electricity
- 1.7%Bottled, tank, or LP gas
- 0.8%No fuel used
- 0.3%Other fuel
- 0.3%Wood
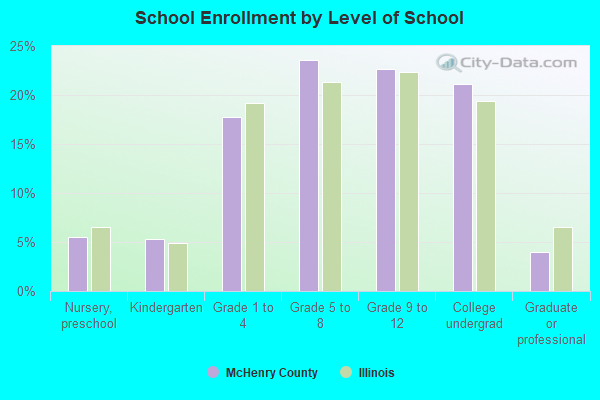
Private vs. public school enrollment:
| Here: | 6.2% |
| Illinois: | 13.3% |
| Here: | 1.1% |
| Illinois: | 9.9% |
| Here: | 18.9% |
| Illinois: | 27.4% |
McHenry County government finances - Expenditure in 2018:
- Charges - Other: $42,107,000
Other: $36,921,000
- Construction - Regular Highways: $12,209,000
Regular Highways: $3,892,000
Central Staff Services: $723,000
General - Other: $529,000
- Current Operations - Health - Other: $30,834,000
Health - Other: $29,320,000
Central Staff Services: $29,002,000
Police Protection: $28,152,000
General - Other: $27,329,000
Central Staff Services: $26,858,000
Police Protection: $25,518,000
Correctional Institutions: $21,849,000
Regular Highways: $17,234,000
General - Other: $17,141,000
Correctional Institutions: $16,994,000
Regular Highways: $14,950,000
Judicial and Legal Services: $13,959,000
Judicial and Legal Services: $10,168,000
Public Welfare - Other: $4,434,000
Public Welfare - Other: $4,094,000
Financial Administration: $1,683,000
Financial Administration: $1,525,000
- Federal Intergovernmental - Health and Hospitals: $7,775,000
Public Welfare: $3,864,000
Health and Hospitals: $2,544,000
Other: $2,342,000
Housing and Community Development: $1,918,000
Public Welfare: $893,000
Highways: $68,000
- General - Interest on Debt: $5,883,000
Interest on Debt: $885,000
- Intergovernmental to Local - Other - General - Other: $7,225,000
Other - General - Other: $2,216,000
- Long Term Debt - Beginning Outstanding - Unspecified Public Purpose: $97,556,000
Outstanding Unspecified Public Purpose: $83,593,000
Retired Unspecified Public Purpose: $35,548,000
Retired Unspecified Public Purpose: $27,220,000
Issue, Unspecified Public Purpose: $24,250,000
Issue, Unspecified Public Purpose: $21,584,000
Beginning Outstanding - Unspecified Public Purpose: $17,024,000
Outstanding Unspecified Public Purpose: $14,054,000
Beginning Outstanding - Public Debt for Private Purpose: $6,237,000
Outstanding Nonguaranteed - Industrial Revenue: $5,668,000
Beginning Outstanding - Public Debt for Private Purpose: $5,100,000
Outstanding Nonguaranteed - Industrial Revenue: $4,531,000
Retired Nonguaranteed - Public Debt for Private Purpose: $569,000
Retired Nonguaranteed - Public Debt for Private Purpose: $569,000
- Miscellaneous - Interest Earnings: $5,996,000
Interest Earnings: $1,916,000
General Revenue - Other: $1,484,000
General Revenue - Other: $1,146,000
Fines and Forfeits: $1,108,000
Fines and Forfeits: $973,000
- Other Capital Outlay - Central Staff Services: $9,604,000
Central Staff Services: $5,529,000
Regular Highways: $1,308,000
Regular Highways: $1,028,000
Housing and Community Development: $943,000
Police Protection: $467,000
Police Protection: $226,000
General - Other: $85,000
Public Welfare - Other: $18,000
- Other Funds - Cash and Securities: $204,279,000
Cash and Securities: $190,715,000
- Sinking Funds - Cash and Securities: $5,668,000
Cash and Securities: $4,531,000
- State Intergovernmental - General Local Government Support: $31,682,000
General Local Government Support: $27,346,000
Highways: $10,931,000
Highways: $8,564,000
Other: $2,174,000
Other: $1,691,000
Public Welfare: $378,000
Health and Hospitals: $292,000
- Tax - Property: $98,732,000
Property: $89,176,000
Other Selective Sales: $2,773,000
Other Selective Sales: $2,575,000
Other License: $1,339,000
Other License: $1,216,000
- Total Salaries and Wages: $66,401,000
: $64,918,000
McHenry County government finances - Revenue in 2018:
- Charges - Other: $42,107,000
Other: $36,921,000
- Construction - Regular Highways: $12,209,000
Regular Highways: $3,892,000
Central Staff Services: $723,000
General - Other: $529,000
- Current Operations - Health - Other: $30,834,000
Health - Other: $29,320,000
Central Staff Services: $29,002,000
Police Protection: $28,152,000
General - Other: $27,329,000
Central Staff Services: $26,858,000
Police Protection: $25,518,000
Correctional Institutions: $21,849,000
Regular Highways: $17,234,000
General - Other: $17,141,000
Correctional Institutions: $16,994,000
Regular Highways: $14,950,000
Judicial and Legal Services: $13,959,000
Judicial and Legal Services: $10,168,000
Public Welfare - Other: $4,434,000
Public Welfare - Other: $4,094,000
Financial Administration: $1,683,000
Financial Administration: $1,525,000
- Federal Intergovernmental - Health and Hospitals: $7,775,000
Public Welfare: $3,864,000
Health and Hospitals: $2,544,000
Other: $2,342,000
Housing and Community Development: $1,918,000
Public Welfare: $893,000
Highways: $68,000
- General - Interest on Debt: $5,883,000
Interest on Debt: $885,000
- Intergovernmental to Local - Other - General - Other: $7,225,000
Other - General - Other: $2,216,000
- Long Term Debt - Beginning Outstanding - Unspecified Public Purpose: $97,556,000
Outstanding Unspecified Public Purpose: $83,593,000
Retired Unspecified Public Purpose: $35,548,000
Retired Unspecified Public Purpose: $27,220,000
Issue, Unspecified Public Purpose: $24,250,000
Issue, Unspecified Public Purpose: $21,584,000
Beginning Outstanding - Unspecified Public Purpose: $17,024,000
Outstanding Unspecified Public Purpose: $14,054,000
Beginning Outstanding - Public Debt for Private Purpose: $6,237,000
Outstanding Nonguaranteed - Industrial Revenue: $5,668,000
Beginning Outstanding - Public Debt for Private Purpose: $5,100,000
Outstanding Nonguaranteed - Industrial Revenue: $4,531,000
Retired Nonguaranteed - Public Debt for Private Purpose: $569,000
Retired Nonguaranteed - Public Debt for Private Purpose: $569,000
- Miscellaneous - Interest Earnings: $5,996,000
Interest Earnings: $1,916,000
General Revenue - Other: $1,484,000
General Revenue - Other: $1,146,000
Fines and Forfeits: $1,108,000
Fines and Forfeits: $973,000
- Other Capital Outlay - Central Staff Services: $9,604,000
Central Staff Services: $5,529,000
Regular Highways: $1,308,000
Regular Highways: $1,028,000
Housing and Community Development: $943,000
Police Protection: $467,000
Police Protection: $226,000
General - Other: $85,000
Public Welfare - Other: $18,000
- Other Funds - Cash and Securities: $204,279,000
Cash and Securities: $190,715,000
- Sinking Funds - Cash and Securities: $5,668,000
Cash and Securities: $4,531,000
- State Intergovernmental - General Local Government Support: $31,682,000
General Local Government Support: $27,346,000
Highways: $10,931,000
Highways: $8,564,000
Other: $2,174,000
Other: $1,691,000
Public Welfare: $378,000
Health and Hospitals: $292,000
- Tax - Property: $98,732,000
Property: $89,176,000
Other Selective Sales: $2,773,000
Other Selective Sales: $2,575,000
Other License: $1,339,000
Other License: $1,216,000
- Total Salaries and Wages: $66,401,000
: $64,918,000
McHenry County government finances - Debt in 2018:
- Charges - Other: $42,107,000
Other: $36,921,000
- Construction - Regular Highways: $12,209,000
Regular Highways: $3,892,000
Central Staff Services: $723,000
General - Other: $529,000
- Current Operations - Health - Other: $30,834,000
Health - Other: $29,320,000
Central Staff Services: $29,002,000
Police Protection: $28,152,000
General - Other: $27,329,000
Central Staff Services: $26,858,000
Police Protection: $25,518,000
Correctional Institutions: $21,849,000
Regular Highways: $17,234,000
General - Other: $17,141,000
Correctional Institutions: $16,994,000
Regular Highways: $14,950,000
Judicial and Legal Services: $13,959,000
Judicial and Legal Services: $10,168,000
Public Welfare - Other: $4,434,000
Public Welfare - Other: $4,094,000
Financial Administration: $1,683,000
Financial Administration: $1,525,000
- Federal Intergovernmental - Health and Hospitals: $7,775,000
Public Welfare: $3,864,000
Health and Hospitals: $2,544,000
Other: $2,342,000
Housing and Community Development: $1,918,000
Public Welfare: $893,000
Highways: $68,000
- General - Interest on Debt: $5,883,000
Interest on Debt: $885,000
- Intergovernmental to Local - Other - General - Other: $7,225,000
Other - General - Other: $2,216,000
- Long Term Debt - Beginning Outstanding - Unspecified Public Purpose: $97,556,000
Outstanding Unspecified Public Purpose: $83,593,000
Retired Unspecified Public Purpose: $35,548,000
Retired Unspecified Public Purpose: $27,220,000
Issue, Unspecified Public Purpose: $24,250,000
Issue, Unspecified Public Purpose: $21,584,000
Beginning Outstanding - Unspecified Public Purpose: $17,024,000
Outstanding Unspecified Public Purpose: $14,054,000
Beginning Outstanding - Public Debt for Private Purpose: $6,237,000
Outstanding Nonguaranteed - Industrial Revenue: $5,668,000
Beginning Outstanding - Public Debt for Private Purpose: $5,100,000
Outstanding Nonguaranteed - Industrial Revenue: $4,531,000
Retired Nonguaranteed - Public Debt for Private Purpose: $569,000
Retired Nonguaranteed - Public Debt for Private Purpose: $569,000
- Miscellaneous - Interest Earnings: $5,996,000
Interest Earnings: $1,916,000
General Revenue - Other: $1,484,000
General Revenue - Other: $1,146,000
Fines and Forfeits: $1,108,000
Fines and Forfeits: $973,000
- Other Capital Outlay - Central Staff Services: $9,604,000
Central Staff Services: $5,529,000
Regular Highways: $1,308,000
Regular Highways: $1,028,000
Housing and Community Development: $943,000
Police Protection: $467,000
Police Protection: $226,000
General - Other: $85,000
Public Welfare - Other: $18,000
- Other Funds - Cash and Securities: $204,279,000
Cash and Securities: $190,715,000
- Sinking Funds - Cash and Securities: $5,668,000
Cash and Securities: $4,531,000
- State Intergovernmental - General Local Government Support: $31,682,000
General Local Government Support: $27,346,000
Highways: $10,931,000
Highways: $8,564,000
Other: $2,174,000
Other: $1,691,000
Public Welfare: $378,000
Health and Hospitals: $292,000
- Tax - Property: $98,732,000
Property: $89,176,000
Other Selective Sales: $2,773,000
Other Selective Sales: $2,575,000
Other License: $1,339,000
Other License: $1,216,000
- Total Salaries and Wages: $66,401,000
: $64,918,000
McHenry County government finances - Cash and Securities in 2018:
- Charges - Other: $42,107,000
Other: $36,921,000
- Construction - Regular Highways: $12,209,000
Regular Highways: $3,892,000
Central Staff Services: $723,000
General - Other: $529,000
- Current Operations - Health - Other: $30,834,000
Health - Other: $29,320,000
Central Staff Services: $29,002,000
Police Protection: $28,152,000
General - Other: $27,329,000
Central Staff Services: $26,858,000
Police Protection: $25,518,000
Correctional Institutions: $21,849,000
Regular Highways: $17,234,000
General - Other: $17,141,000
Correctional Institutions: $16,994,000
Regular Highways: $14,950,000
Judicial and Legal Services: $13,959,000
Judicial and Legal Services: $10,168,000
Public Welfare - Other: $4,434,000
Public Welfare - Other: $4,094,000
Financial Administration: $1,683,000
Financial Administration: $1,525,000
- Federal Intergovernmental - Health and Hospitals: $7,775,000
Public Welfare: $3,864,000
Health and Hospitals: $2,544,000
Other: $2,342,000
Housing and Community Development: $1,918,000
Public Welfare: $893,000
Highways: $68,000
- General - Interest on Debt: $5,883,000
Interest on Debt: $885,000
- Intergovernmental to Local - Other - General - Other: $7,225,000
Other - General - Other: $2,216,000
- Long Term Debt - Beginning Outstanding - Unspecified Public Purpose: $97,556,000
Outstanding Unspecified Public Purpose: $83,593,000
Retired Unspecified Public Purpose: $35,548,000
Retired Unspecified Public Purpose: $27,220,000
Issue, Unspecified Public Purpose: $24,250,000
Issue, Unspecified Public Purpose: $21,584,000
Beginning Outstanding - Unspecified Public Purpose: $17,024,000
Outstanding Unspecified Public Purpose: $14,054,000
Beginning Outstanding - Public Debt for Private Purpose: $6,237,000
Outstanding Nonguaranteed - Industrial Revenue: $5,668,000
Beginning Outstanding - Public Debt for Private Purpose: $5,100,000
Outstanding Nonguaranteed - Industrial Revenue: $4,531,000
Retired Nonguaranteed - Public Debt for Private Purpose: $569,000
Retired Nonguaranteed - Public Debt for Private Purpose: $569,000
- Miscellaneous - Interest Earnings: $5,996,000
Interest Earnings: $1,916,000
General Revenue - Other: $1,484,000
General Revenue - Other: $1,146,000
Fines and Forfeits: $1,108,000
Fines and Forfeits: $973,000
- Other Capital Outlay - Central Staff Services: $9,604,000
Central Staff Services: $5,529,000
Regular Highways: $1,308,000
Regular Highways: $1,028,000
Housing and Community Development: $943,000
Police Protection: $467,000
Police Protection: $226,000
General - Other: $85,000
Public Welfare - Other: $18,000
- Other Funds - Cash and Securities: $204,279,000
Cash and Securities: $190,715,000
- Sinking Funds - Cash and Securities: $5,668,000
Cash and Securities: $4,531,000
- State Intergovernmental - General Local Government Support: $31,682,000
General Local Government Support: $27,346,000
Highways: $10,931,000
Highways: $8,564,000
Other: $2,174,000
Other: $1,691,000
Public Welfare: $378,000
Health and Hospitals: $292,000
- Tax - Property: $98,732,000
Property: $89,176,000
Other Selective Sales: $2,773,000
Other Selective Sales: $2,575,000
Other License: $1,339,000
Other License: $1,216,000
- Total Salaries and Wages: $66,401,000
: $64,918,000
Supplemental Security Income (SSI) in 2006:
- Total number of recipients: 1,264
- Number of aged recipients: 187
- Number of blind and disabled recipients: 1,077
- Number of recipients under 18: 226
- Number of recipients between 18 and 64: 783
- Number of recipients older than 64: 255
- Number of recipients also receiving OASDI: 393
- Amount of payments (thousands of dollars): 542
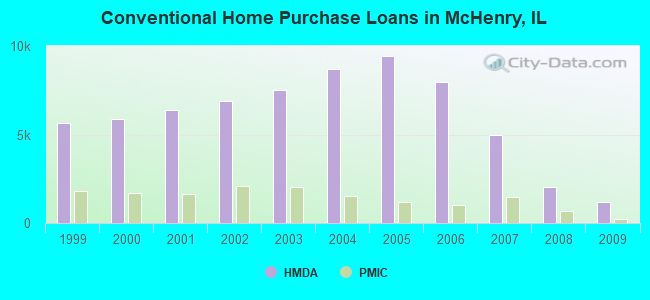
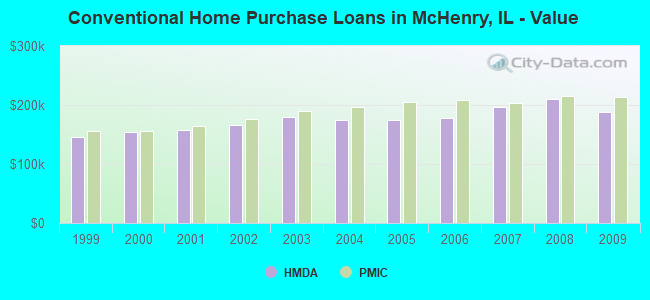
| Home Mortgage Disclosure Act Aggregated Statistics For Year 2009 (Based on 47 full tracts) | ||||||||||||||
| A) FHA, FSA/RHS & VA Home Purchase Loans | B) Conventional Home Purchase Loans | C) Refinancings | D) Home Improvement Loans | E) Loans on Dwellings For 5+ Families | F) Non-occupant Loans on < 5 Family Dwellings (A B C & D) | G) Loans On Manufactured Home Dwelling (A B C & D) | ||||||||
|---|---|---|---|---|---|---|---|---|---|---|---|---|---|---|
| Number | Average Value | Number | Average Value | Number | Average Value | Number | Average Value | Number | Average Value | Number | Average Value | Number | Average Value | |
| LOANS ORIGINATED | 1,341 | $181,609 | 1,204 | $187,960 | 10,611 | $201,741 | 250 | $116,640 | 23 | $1,131,217 | 501 | $179,405 | 29 | $185,966 |
| APPLICATIONS APPROVED, NOT ACCEPTED | 93 | $177,860 | 97 | $205,216 | 948 | $212,537 | 42 | $52,167 | 0 | $0 | 23 | $156,696 | 1 | $293,000 |
| APPLICATIONS DENIED | 210 | $179,443 | 197 | $177,274 | 2,944 | $221,472 | 148 | $70,223 | 0 | $0 | 129 | $197,155 | 8 | $71,500 |
| APPLICATIONS WITHDRAWN | 132 | $172,811 | 155 | $200,065 | 1,655 | $210,456 | 46 | $121,391 | 1 | $1,181,000 | 83 | $162,711 | 1 | $88,000 |
| FILES CLOSED FOR INCOMPLETENESS | 50 | $164,560 | 38 | $177,079 | 624 | $213,220 | 12 | $103,583 | 0 | $0 | 20 | $133,500 | 0 | $0 |
| Private Mortgage Insurance Companies Aggregated Statistics For Year 2009 (Based on 47 full tracts) | ||||||
| A) Conventional Home Purchase Loans | B) Refinancings | C) Non-occupant Loans on < 5 Family Dwellings (A & B) | ||||
|---|---|---|---|---|---|---|
| Number | Average Value | Number | Average Value | Number | Average Value | |
| LOANS ORIGINATED | 204 | $212,789 | 185 | $228,124 | 1 | $238,000 |
| APPLICATIONS APPROVED, NOT ACCEPTED | 95 | $235,947 | 136 | $222,478 | 4 | $138,000 |
| APPLICATIONS DENIED | 24 | $254,458 | 77 | $226,961 | 1 | $146,000 |
| APPLICATIONS WITHDRAWN | 12 | $231,417 | 46 | $214,261 | 0 | $0 |
| FILES CLOSED FOR INCOMPLETENESS | 8 | $193,125 | 14 | $2,039,786 | 1 | $119,000 |
| Most common first names in McHenry County, IL among deceased individuals | ||
| Name | Count | Lived (average) |
|---|---|---|
| John | 1,231 | 75.0 years |
| William | 951 | 75.2 years |
| Mary | 892 | 79.7 years |
| Robert | 845 | 71.5 years |
| George | 663 | 76.1 years |
| Joseph | 646 | 75.2 years |
| James | 633 | 70.5 years |
| Helen | 609 | 81.1 years |
| Charles | 564 | 75.4 years |
| Edward | 540 | 75.5 years |
| Most common last names in McHenry County, IL among deceased individuals | ||
| Last name | Count | Lived (average) |
|---|---|---|
| Johnson | 350 | 77.1 years |
| Smith | 290 | 77.7 years |
| Miller | 258 | 76.5 years |
| Anderson | 247 | 77.4 years |
| Nelson | 148 | 78.9 years |
| Freund | 123 | 79.5 years |
| Brown | 116 | 76.3 years |
| Peterson | 112 | 77.3 years |
| Carlson | 106 | 77.6 years |
| Davis | 101 | 75.1 years |
| Businesses in McHenry County, IL | ||||
| Name | Count | Name | Count | |
|---|---|---|---|---|
| 7-Eleven | 11 | Kohl's | 3 | |
| ALDI | 5 | La-Z-Boy | 3 | |
| AT&T | 4 | Lane Bryant | 3 | |
| Ace Hardware | 8 | Lane Furniture | 3 | |
| Advance Auto Parts | 5 | Little Caesars Pizza | 4 | |
| Aeropostale | 2 | Long John Silver's | 1 | |
| American Eagle Outfitters | 1 | Lowe's | 1 | |
| Ann Taylor | 2 | Marshalls | 1 | |
| Applebee's | 2 | MasterBrand Cabinets | 17 | |
| Arby's | 3 | Maurices | 3 | |
| Ashley Furniture | 1 | Mazda | 1 | |
| AutoZone | 6 | McDonald's | 14 | |
| BMW | 1 | Meijer | 2 | |
| Banana Republic | 1 | Men's Wearhouse | 3 | |
| Barnes & Noble | 1 | Menards | 2 | |
| Baskin-Robbins | 6 | Motherhood Maternity | 3 | |
| Bath & Body Works | 3 | New Balance | 1 | |
| Bed Bath & Beyond | 2 | New York & Co | 1 | |
| Blockbuster | 3 | Nike | 15 | |
| Brunswick Bowling & Billiards | 2 | Nissan | 1 | |
| Buffalo Wild Wings | 2 | Office Depot | 3 | |
| Burger King | 6 | OfficeMax | 3 | |
| Buybuy BABY | 1 | Old Navy | 2 | |
| CVS | 3 | Olive Garden | 1 | |
| Caribou Coffee | 1 | On The Border | 1 | |
| Chevrolet | 4 | Outback | 1 | |
| Chico's | 1 | Outback Steakhouse | 1 | |
| Chipotle | 3 | Pac Sun | 1 | |
| Chuck E. Cheese's | 1 | Panda Express | 2 | |
| Circle K | 3 | Panera Bread | 4 | |
| Clarks | 1 | Papa John's Pizza | 3 | |
| Cold Stone Creamery | 1 | Payless | 3 | |
| Coldwater Creek | 1 | Penske | 3 | |
| Comfort Inn | 1 | PetSmart | 3 | |
| Costco | 1 | Pier 1 Imports | 2 | |
| Cricket Wireless | 5 | Pizza Hut | 4 | |
| Curves | 2 | Plato's Closet | 1 | |
| Dairy Queen | 8 | Popeyes | 1 | |
| Days Inn | 1 | Pottery Barn | 1 | |
| Decora Cabinetry | 4 | Quiznos | 2 | |
| Discount Tire | 1 | RadioShack | 4 | |
| Domino's Pizza | 2 | Red Robin | 1 | |
| DressBarn | 4 | SAS Shoes | 3 | |
| Dressbarn | 4 | SONIC Drive-In | 1 | |
| Dunkin Donuts | 9 | Safeway | 3 | |
| Eddie Bauer | 1 | Sam's Club | 1 | |
| Express | 1 | Sears | 3 | |
| Famous Footwear | 3 | Sephora | 2 | |
| Fashion Bug | 1 | Shoe Carnival | 2 | |
| FedEx | 39 | Sprint Nextel | 8 | |
| Firestone Complete Auto Care | 3 | Staples | 1 | |
| GNC | 3 | Starbucks | 10 | |
| GameStop | 5 | Steak 'n Shake | 2 | |
| Gap | 2 | Subaru | 1 | |
| Goodwill | 5 | Super 8 | 4 | |
| Gymboree | 1 | T-Mobile | 17 | |
| H&R Block | 10 | T.G.I. Driday's | 1 | |
| Hilton | 1 | T.J.Maxx | 3 | |
| Hobby Lobby | 2 | Taco Bell | 8 | |
| Holiday Inn | 3 | Target | 3 | |
| Hollister Co. | 1 | The Athlete's Foot | 1 | |
| Home Depot | 3 | The Room Place | 2 | |
| Honda | 1 | Toyota | 1 | |
| Houlihan's | 1 | Toys"R"Us | 2 | |
| Hyundai | 1 | Trader Joe's | 1 | |
| IHOP | 2 | True Value | 2 | |
| IZOD | 1 | U-Haul | 17 | |
| J. Jill | 1 | UPS | 54 | |
| JCPenney | 2 | Vans | 1 | |
| Jamba Juice | 2 | Verizon Wireless | 4 | |
| Jewel-Osco | 8 | Victoria's Secret | 1 | |
| Jimmy John's | 1 | Vons | 3 | |
| JoS. A. Bank | 1 | Walgreens | 11 | |
| Jones New York | 2 | Walmart | 6 | |
| Justice | 2 | Wendy's | 6 | |
| KFC | 4 | White Castle | 1 | |
| Kincaid | 1 | YMCA | 2 | |
| Kmart | 2 | |||
McHenry County on our top lists:
- #6 on the list of "Top 101 counties with the largest decrease in the number of births per 1000 residents 2000-2006 to 2007-2013 (pop 50,000+)"
- #10 on the list of "Top 101 counties with the lowest number of infant deaths per 1000 residents 2007-2013 (pop. 50,000+)"
- #10 on the list of "Top 101 counties with the largest decrease in the number of infant deaths per 1000 residents 2000-2006 to 2007-2013 (pop. 50,000+)"
- #30 on the list of "Top 101 counties with the lowest percentage of residents relocating to foreign countries in 2011"
- #36 on the list of "Top 101 counties with the largest number of people moving out compared to moving in (pop. 50,000+)"
- #48 on the list of "Top 101 counties with the largest number of children under 18 without health insurance coverage in 2000 (pop. 50,000+)"
- #66 on the list of "Top 101 counties with the lowest percentage of residents relocating from foreign countries between 2010 and 2011"
- #78 on the list of "Top 101 counties with the lowest percentage of residents relocating to foreign countries in 2011 (pop. 50,000+)"