Nottoway County, Virginia (VA)
County owner-occupied free and clear houses and condos in 2010: 1,635
County owner-occupied houses and condos in 2000: 4,017
Renter-occupied apartments: 1,925 (it was 1,647 in 2000)
| % of renters here: | 29% |
| State: | 33% |
Land area: 315 sq. mi.
Water area: 1.4 sq. mi.
Population density: 50 people per square mile (average).
Industries providing employment: Educational, health and social services (29.4%), Arts, entertainment, recreation, accommodation and food services (12.0%), Retail trade (10.4%).
Type of workers:
- Private wage or salary: 73%
- Government: 20%
- Self-employed, not incorporated: 7%
- Unpaid family work: 0%
- OSM Map
- General Map
- Google Map
- MSN Map


- 8,32453.4%White Non-Hispanic Alone
- 5,91837.9%Black Non-Hispanic Alone
- 8195.2%Hispanic or Latino
- 4062.6%Two or more races
- 850.5%Asian alone
- 470.3%Some other race alone
- 30.02%American Indian and Alaska Native alone

| Median resident age: | 41.6 years |
| Virginia median age: | 39.0 years |
| Males: 8,354 | |
| Females: 7,391 |

 | Country living near Richmond (5 replies) |
| Moving to Richmond Area and Would Like Advice Please (16 replies) |
| Recommended areas near Ft. Lee? (7 replies) |
| Info on Farmville...small farms, country life in Va? (10 replies) |
| Blackstone, Virginia (2 replies) |
| Do most people in Lynchburg and Roanoke have southern accents? (14 replies) |
| Nottoway County: | 2.0 people |
| Virginia: | 3 people |
Estimated median household income in 2022: $61,382 ($30,866 in 1999)
| This county: | $61,382 |
| Virginia: | $85,873 |
Median contract rent in 2022 for apartments: $663 (lower quartile is $473, upper quartile is $790)
| This county: | $663 |
| State: | $1270 |
Estimated median house or condo value in 2022: $182,420 (it was $72,300 in 2000)
| Nottoway: | $182,420 |
| Virginia: | $365,700 |
Median monthly housing costs for homes and condos with a mortgage: $1,233
Median monthly housing costs for units without a mortgage: $368
Institutionalized population: 1,821
Crime in 2021 (reported by the sheriff's office or county police, not the county total):
- Murders: 0
- Rapes: 1
- Robberies: 1
- Assaults: 18
- Burglaries: 23
- Thefts: 50
- Auto thefts: 9
Crime in 2020 (reported by the sheriff's office or county police, not the county total):
- Murders: 2
- Rapes: 2
- Robberies: 1
- Assaults: 17
- Burglaries: 22
- Thefts: 58
- Auto thefts: 5

Single-family new house construction building permits:
- 2022: 44 buildings, average cost: $214,700
- 2021: 30 buildings, average cost: $182,600
- 2020: 46 buildings, average cost: $148,800
- 2019: 29 buildings, average cost: $203,000
- 2018: 34 buildings, average cost: $125,400
- 2017: 30 buildings, average cost: $143,600
- 2016: 26 buildings, average cost: $149,600
- 2015: 33 buildings, average cost: $116,600
- 2014: 27 buildings, average cost: $144,200
- 2013: 26 buildings, average cost: $166,600
- 2012: 27 buildings, average cost: $108,700
- 2011: 22 buildings, average cost: $108,700
- 2010: 45 buildings, average cost: $98,900
- 2009: 45 buildings, average cost: $102,000
- 2008: 81 buildings, average cost: $113,800
- 2007: 51 buildings, average cost: $151,600
- 2006: 63 buildings, average cost: $141,400
- 2005: 74 buildings, average cost: $127,200
- 2004: 76 buildings, average cost: $112,800
- 2003: 55 buildings, average cost: $122,200
- 2002: 70 buildings, average cost: $90,400
- 2001: 60 buildings, average cost: $100,600
- 2000: 51 buildings, average cost: $95,000
- 1999: 54 buildings, average cost: $101,600
- 1998: 34 buildings, average cost: $143,300
- 1997: 62 buildings, average cost: $70,300


Median real estate property taxes paid for housing units with mortgages in 2022: $840 (0.4%)
Median real estate property taxes paid for housing units with no mortgage in 2022: $750 (0.4%)


| Nottoway County: | 20.2% |
| Virginia: | 10.6% |
Median age of residents in 2022: 41.6 years old
(Males: 41.4 years old, Females: 42.0 years old)
(Median age for: White residents: 45.0 years old, Black residents: 38.1 years old, Asian residents: 29.3 years old, Hispanic or Latino residents: 40.1 years old, Other race residents: 39.9 years old)
Fair market rent in 2006 for a 1-bedroom apartment in Nottoway County is $434 a month.
Fair market rent for a 2-bedroom apartment is $483 a month.
Fair market rent for a 3-bedroom apartment is $686 a month.
Cities in this county include: Blackstone, Crewe, Burkeville, Nottoway Court House.
Neighboring counties: Fresno County, California  , Campbell County , Carter County, Missouri , Taos County, New Mexico , Halifax County
  , Montgomery County , Virginia Beach city
  .
.
| Here: | 2.7% |
| Virginia: | 2.7% |


Current college students: 226
People 25 years of age or older with a high school degree or higher: 83.8%
People 25 years of age or older with a bachelor's degree or higher: 16.1%
Number of foreign born residents: 393 (45.6% naturalized citizens)
| Nottoway County: | 2.5% |
| Whole state: | 12.7% |

- Year of entry for the foreign-born population
- 1472010 or later
- 842000 to 2009
- 121990 to 1999
- 261980 to 1989
- 91970 to 1979
- 46Before 1970
Mean travel time to work (commute): minutes
Percentage of county residents living and working in this county: 100.9%


Housing units in structures:
- One, detached: 5,515
- One, attached: 122
- Two: 81
- 3 or 4: 114
- 5 to 9: 122
- 10 to 19: 60
- 20 to 49: 45
- 50 or more: 5
- Mobile homes: 671
Housing units in Nottoway County with a mortgage: 2,240 (126 second mortgage, 0 home equity loan, 99 both second mortgage and home equity loan)
Houses without a mortgage: 40
| Here: | 4.8% with mortgage |
| State: | 97.2% with mortgage |
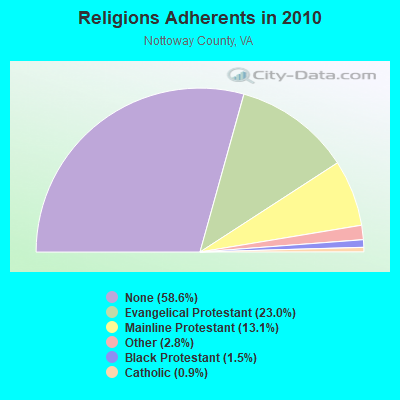
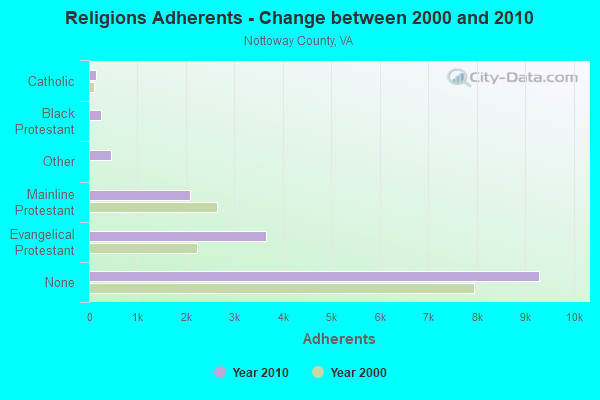
Religion statistics for Nottoway County
| Religion | Adherents | Congregations |
|---|---|---|
| Evangelical Protestant | 3,653 | 23 |
| Mainline Protestant | 2,083 | 14 |
| Other | 447 | 3 |
| Black Protestant | 238 | 3 |
| Catholic | 140 | 1 |
| None | 9,292 | - |
Source: Clifford Grammich, Kirk Hadaway, Richard Houseal, Dale E.Jones, Alexei Krindatch, Richie Stanley and Richard H.Taylor. 2012. 2010 U.S.Religion Census: Religious Congregations & Membership Study. Association of Statisticians of American Religious Bodies. Jones, Dale E., et al. 2002. Congregations and Membership in the United States 2000. Nashville, TN: Glenmary Research Center.
Food Environment Statistics:
| Nottoway County: | 1.27 / 10,000 pop. |
| State: | 2.03 / 10,000 pop. |
| Here: | 0.64 / 10,000 pop. |
| Virginia: | 0.17 / 10,000 pop. |
| Nottoway County: | 9.55 / 10,000 pop. |
| Virginia: | 4.03 / 10,000 pop. |
| This county: | 8.28 / 10,000 pop. |
| State: | 7.65 / 10,000 pop. |
| Nottoway County: | 11.6% |
| Virginia: | 9.3% |
| Nottoway County: | 30.0% |
| State: | 26.7% |
| Here: | 16.5% |
| State: | 18.6% |
Agriculture in Nottoway County:
Average size of farms: 175 acresAverage value of agricultural products sold per farm: $67,343
Average value of crops sold per acre for harvested cropland: $131.79
The value of nursery, greenhouse, floriculture, and sod as a percentage of the total market value of agricultural products sold: 0.85%
The value of livestock, poultry, and their products as a percentage of the total market value of agricultural products sold: 90.92%
Average total farm production expenses per farm: $47,149
Harvested cropland as a percentage of land in farms: 26.49%
Average market value of all machinery and equipment per farm: $33,097
The percentage of farms operated by a family or individual: 92.40%
Average age of principal farm operators: 58 years
Average number of cattle and calves per 100 acres of all land in farms: 22.84
Milk cows as a percentage of all cattle and calves: 7.96%
Corn for grain: 514 harvested acres
Soybeans for beans: 730 harvested acres
Land in orchards: 42 acres
Earthquake activity:
Nottoway County-area historical earthquake activity is significantly above Virginia state average. It is 50% smaller than the overall U.S. average.On 8/23/2011 at 17:51:04, a magnitude 5.8 (5.8 MW, Depth: 3.7 mi, Class: Moderate, Intensity: VI - VII) earthquake occurred 54.5 miles away from Nottoway County center
On 12/9/2003 at 20:59:14, a magnitude 4.5 (4.5 MB, 4.5 LG, Class: Light, Intensity: IV - V) earthquake occurred 32.9 miles away from the county center
On 12/9/2003 at 20:59:18, a magnitude 4.5 (4.5 ML, Depth: 6.2 mi) earthquake occurred 44.6 miles away from the county center
On 8/9/2020 at 12:07:37, a magnitude 5.1 (5.1 MW, Depth: 4.7 mi) earthquake occurred 173.5 miles away from the county center
On 8/25/2011 at 05:07:52, a magnitude 4.5 (4.5 ML, Depth: 4.2 mi) earthquake occurred 56.8 miles away from Nottoway County center
On 8/24/2011 at 00:04:36, a magnitude 4.2 (4.2 ML) earthquake occurred 54.7 miles away from the county center
Magnitude types: regional Lg-wave magnitude (LG), body-wave magnitude (MB), local magnitude (ML), moment magnitude (MW)
Most recent natural disasters:
- Virginia Covid-19 Pandemic, Incident Period: January 20, 2020, Major Disaster (Presidential) Declared DR-4512-VA: April 2, 2020, FEMA Id: 4512, Natural disaster type: Other
- Virginia Tropical Storm Michael, Incident Period: October 9, 2018 - October 16, 2018, FEMA Id: 4411, Natural disaster type: Tropical Storm
- Virginia Hurricane Florence, Incident Period: September 8, 2018 - September 21, 2018, FEMA Id: 4401, Natural disaster type: Hurricane
- Virginia Hurricane Sandy, Incident Period: October 26, 2012 to November 01, 2012, Emergency Declared EM-3359: October 29, 2012, FEMA Id: 3359, Natural disaster type: Hurricane
- Virginia Severe Storms and Straight-line Winds, Incident Period: June 29, 2012 to July 01, 2012, Major Disaster (Presidential) Declared DR-4072: July 27, 2012, FEMA Id: 4072, Natural disaster type: Storm, Wind
- Virginia Hurricane Irene, Incident Period: August 26, 2011 to August 28, 2011, Major Disaster (Presidential) Declared DR-4024: September 03, 2011, FEMA Id: 4024, Natural disaster type: Hurricane
- Virginia Hurricane Katrina Evacuation, Incident Period: August 29, 2005 to October 01, 2005, Emergency Declared EM-3240: September 12, 2005, FEMA Id: 3240, Natural disaster type: Hurricane
- Virginia Hurricane Isabel, Incident Period: September 18, 2003 to October 01, 2003, Major Disaster (Presidential) Declared DR-1491: September 18, 2003, FEMA Id: 1491, Natural disaster type: Hurricane
- Virginia Winter Storm, Incident Period: January 25, 2000 to January 30, 2000, Major Disaster (Presidential) Declared DR-1318: February 28, 2000, FEMA Id: 1318, Natural disaster type: Winter Storm
- Virginia Hurricane Fran, Incident Period: September 05, 1996 to September 23, 1996, Major Disaster (Presidential) Declared DR-1135: September 06, 1996, FEMA Id: 1135, Natural disaster type: Hurricane
- 7 other natural disasters have been reported since 1953.
The number of natural disasters in Nottoway County (17) is near the US average (15).
Major Disasters (Presidential) Declared: 10
Emergencies Declared: 5
Causes of natural disasters: Hurricanes: 6, Storms: 3, Droughts: 2, Floods: 2, Tropical Storms: 2, Winter Storms: 2, Blizzard: 1, Ice Storm: 1, Wind: 1, Other: 1 (Note: some incidents may be assigned to more than one category).

Means of transportation to work:
- Drove a car alone: 5,600 (77.2%)
- Carpooled: 549 (7.6%)
- Bus: 27 (0.4%)
- Taxicab, motorcycle, or other means: 277 (3.8%)
- Walked: 48 (0.7%)
- Worked at home: 622 (8.6%)


- Health care and social assistance (37%)
- Educational services (12%)
- Accommodation and food services (11%)
- Public administration (9%)
- Retail trade (8%)
- Professional, scientific, and technical services (8%)
- Finance and insurance (5%)

- Health care and social assistance (36%)
- Educational services (11%)
- Accommodation and food services (10%)
- Public administration (8%)
- Retail trade (8%)
- Professional, scientific, and technical services (7%)
- Finance and insurance (5%)

- Transportation occupations (12%)
- Management occupations (11%)
- Installation, maintenance, and repair occupations (10%)
- Construction and extraction occupations (9%)
- Personal care and service occupations (7%)
- Food preparation and serving related occupations (6%)
- Sales and related occupations (5%)

- Office and administrative support occupations (17%)
- Management occupations (11%)
- Sales and related occupations (10%)
- Healthcare support occupations (9%)
- Food preparation and serving related occupations (8%)
- Educational instruction, and library occupations (8%)
- Health diagnosing and treating practitioners and other technical occupations (7%)

- Mexico (34%)
- El Salvador (26%)
- Nepal (15%)
- India (9%)
- China, excluding Hong Kong and Taiwan (3%)
- Cuba (3%)
- Sudan (3%)

- American (35%)
- English (6%)
- African (3%)
- German (2%)
- Irish (2%)
- European (1%)
- Scottish (1%)


People in group quarters in Nottoway County, Virginia in 2010:
- 1,371 people in state prisons
- 291 people in mental (psychiatric) hospitals and psychiatric units in other hospitals
- 159 people in nursing facilities/skilled-nursing facilities
- 13 people in other noninstitutional facilities
- 2 people in workers' group living quarters and job corps centers
People in group quarters in Nottoway County, Virginia in 2000:
- 1,291 people in state prisons
- 173 people in nursing homes
- 131 people in mental (psychiatric) hospitals or wards
- 51 people in other noninstitutional group quarters
- 10 people in homes for the mentally retarded
7.75% of this county's 2021 resident taxpayers lived in other counties in 2020 ($31,730 average adjusted gross income)
| Here: | 7.75% |
| Virginia average: | 10.16% |
10 or fewer of this county's residents moved from foreign countries.
6.69% relocated from other counties in Virginia ($27,858 average AGI)
1.07% relocated from other states ($3,873 average AGI)
Nottoway County: 1.07% Virginia average: 3.91%

Top counties from which taxpayers relocated into this county between 2020 and 2021:
| from Chesterfield County, VA | |
| from Prince Edward County, VA | |
| from Amelia County, VA | |
| from Lunenburg County, VA |
7.00% of this county's 2020 resident taxpayers moved to other counties in 2021 ($39,614 average adjusted gross income)
| Here: | 7.00% |
| Virginia average: | 10.20% |
10 or fewer of this county's residents moved to foreign countries.
5.89% relocated to other counties in Virginia ($34,043 average AGI)
1.11% relocated to other states ($5,571 average AGI)
Nottoway County: 1.11% Virginia average: 3.98%

Top counties to which taxpayers relocated from this county between 2020 and 2021:
| to Lunenburg County, VA | |
| to Prince Edward County, VA | |
| to Chesterfield County, VA |
Births per 1000 population from 1990 to 1999: 11.9
Births per 1000 population from 2000 to 2006: 11.3

Deaths per 1000 population from 1990 to 1999: 14.1
Deaths per 1000 population from 2000 to 2009: 12.5
Deaths per 1000 population from 2010 to 2020: 13.2

Infant deaths per 1000 live births from 1990 to 1999: 11.9
Infant deaths per 1000 live births from 2000 to 2006: 8.6

Persons under 19 years old without health insurance coverage in 2018: 7.2%


Persons enrolled in hospital insurance and/or supplemental medical insurance (Medicare) in July 1, 2007: 3,212 (2,633 aged, 579 disabled)
Children under 18 without health insurance coverage in 2007: 289 (8%)


Most common underlying causes of death in Nottoway County, Virginia in 1999 - 2019:
- Atherosclerotic heart disease (194)
- Bronchus or lung, unspecified - Malignant neoplasms (192)
- Acute myocardial infarction, unspecified (146)
- Chronic obstructive pulmonary disease, unspecified (73)
- Other forms of acute ischaemic heart disease (69)
- Stroke, not specified as haemorrhage or infarction (57)
- Alzheimer disease, unspecified (47)
- Atherosclerotic cardiovascular disease, so described (23)
- Pneumonia, unspecified (23)
- Unspecified dementia (16)
Population without health insurance coverage in 2000: 15%
Children under 18 without health insurance coverage in 2000: 12%
Medical specialist MDs per 100,000 population in 2005: 1,157
Dentists per 100,000 population in 1998: 13
Total births per 100,000 population, July 2005 - July 2006 : 40
Total deaths per 100,000 population, July 2005 - July 2006: 64
Limited-service eating places per 100,000 population in 2005 : 13
Crimes per 100,000 population in 1996: 1
Household type by relationship:
Households: 15,745- Male householders: 2,300 (600 living alone), Female householders: 3,270 (1,144 living alone)
2,306 spouses (2,305 opposite-sex spouses), 386 unmarried partners, (373 opposite-sex unmarried partners), 3,877 children (3,722 natural, 90 adopted, 64 stepchildren), 545 grandchildren, 107 brothers or sisters, 74 parents, 0 foster children, 123 other relatives, 350 non-relatives
- In group quarters: 2,368
Size of family households: 1,734 2-persons, 719 3-persons, 580 4-persons, 373 5-persons, 200 6-persons, 15 7-or-more-persons.
Size of nonfamily households: 1,746 1-person, 191 2-persons, 4 3-persons.
1,643 married couples with children.
905 single-parent households (194 men, 711 women).
94.9% of residents of Nottoway speak English at home.
4.3% of residents speak Spanish at home (55% speak English very well, 37% speak English well, 8% speak English not well).
0.3% of residents speak other Indo-European language at home (64% speak English very well, 36% speak English well).
0.1% of residents speak Asian or Pacific Island language at home (87% speak English very well, 7% speak English well, 7% speak English not well).
In fiscal year 2004:
Federal Government expenditure: $197,637,000 ($12,649 per capita)
Department of Defense expenditure: $108,325,000
Federal direct payments to individuals for retirement and disability: $52,560,000
Federal other direct payments to individuals: $21,676,000
Federal direct payments not to individuals: $469,000
Federal grants: $61,703,000
Federal procurement contracts: $29,172,000 ($28,542,000 Department of Defense)
Federal salaries and wages: $32,057,000 ($29,676,000 Department of Defense)
Federal Government direct loans: $330,000
Federal guaranteed/insured loans: $6,128,000
Federal Government insurance: $1,086,000
Population change from April 1, 2000 to July 1, 2005:
Births: 952| Here: | 61 per 1000 residents |
| State: | 70 per 1000 residents |
Deaths: 1,120
| Here: | 72 per 1000 residents |
| State: | 40 per 1000 residents |
Net international migration: +115
| Here: | +7 per 1000 residents |
| State: | +18 per 1000 residents |
Net internal migration: -88
| Here: | |
| State: |

Total withdrawal of fresh water for public supply: 0.58 millions of gallons per day (9% from ground, 91% from surface)
| Here: | 6.2 |
| State: | 7.0 |
| Here: | 5.2 |
| State: | 4.3 |

- Year house built in Nottoway County, Virginia
- 702020 or later
- 3482010 to 2019
- 8092000 to 2009
- 7781990 to 1999
- 6281980 to 1989
- 7441970 to 1979
- 7431960 to 1969
- 8051950 to 1959
- 5101940 to 1949
- 1,2151939 or earlier

- Rooms in owner-occupied houses in Nottoway County, Virginia
- 21 room
- 02 rooms
- 333 rooms
- 1744 rooms
- 9445 rooms
- 1,1246 rooms
- 5817 rooms
- 5138 rooms
- 6019+ rooms

- Rooms in renter-occupied apartments in Nottoway County, Virginia
- 81 room
- 82 rooms
- 1433 rooms
- 3954 rooms
- 2745 rooms
- 3576 rooms
- 1987 rooms
- 1298 rooms
- 329+ rooms

- Bedrooms in owner-occupied houses in Nottoway County, Virginia
- 3no bedroom
- 601 bedroom
- 6642 bedrooms
- 2,3023 bedrooms
- 7864 bedrooms
- 1715+ bedrooms

- Bedrooms in renter-occupied apartments in Nottoway County, Virginia
- 8no bedroom
- 1641 bedroom
- 5812 bedrooms
- 6523 bedrooms
- 1464 bedrooms
- 25+ bedrooms

- Cars and other vehicles available in Nottoway County in owner-occupied houses/condos
- 282no vehicle
- 6581 vehicle
- 1,4192 vehicles
- 1,0693 vehicles
- 3244 vehicles
- 2385+ vehicles

- Cars and other vehicles available in Nottoway County in renter-occupied apartments
- 129no vehicle
- 8601 vehicle
- 3072 vehicles
- 1683 vehicles
- 724 vehicles
- 435+ vehicles
93.8% of Nottoway County residents lived in the same house 1 years ago.
Out of people who lived in different houses, 21% lived in this county.
Out of people who lived in different counties, 94% lived in Virginia.
| Nottoway County: | 93.8% |
| State average: | 86.6% |
Place of birth for U.S.-born residents:
- This state: 12,069
- Other state: 3,070
- Northeast: 837
- Midwest: 361
- South: 1,644
- West: 220


- 55.6%Electricity
- 16.9%Bottled, tank, or LP gas
- 15.5%Fuel oil, kerosene, etc.
- 10.6%Wood
- 0.6%No fuel used
- 0.4%Utility gas
- 0.2%Solar energy
- 0.1%Coal or coke

- 69.4%Electricity
- 16.2%Fuel oil, kerosene, etc.
- 11.1%Bottled, tank, or LP gas
- 2.2%Wood
- 0.5%Utility gas
- 0.4%Other fuel
- 0.3%No fuel used
Private vs. public school enrollment:
| Here: | 23.4% |
| Virginia: | 13.2% |
| Here: | 13.9% |
| Virginia: | 10.2% |
| Here: | 3.5% |
| Virginia: | 18.7% |


Nottoway County government finances - Expenditure in 2017:
- Assistance and Subsidies - Public Welfare, Federal Categorical Assistance Programs: $2,032,000
- Charges - Solid Waste Management: $422,000
Elementary and Secondary Education School Lunch: $285,000
Elementary and Secondary Education School Tuition and Transportation: $3,000
- Current Operations - Elementary and Secondary Education: $22,035,000
Police Protection: $1,080,000
Solid Waste Management: $735,000
Central Staff Services: $633,000
Financial Administration: $523,000
Correctional Institutions: $493,000
Judicial and Legal Services: $439,000
Libraries: $256,000
Health - Other: $231,000
General Public Buildings: $214,000
Local Fire Protection: $186,000
Protective Inspection and Regulation - Other: $94,000
Transit Utilities: $8,000
- Federal Intergovernmental - Education: $92,000
- General - Interest on Debt: $129,000
- Intergovernmental to Local - Other - Elementary and Secondary Education: $347,000
- Local Intergovernmental - Public Welfare: $906,000
Education: $416,000
- Long Term Debt - Beginning Outstanding - Unspecified Public Purpose: $3,215,000
Outstanding Unspecified Public Purpose: $2,761,000
Retired Unspecified Public Purpose: $454,000
- Miscellaneous - Rents: $609,000
General Revenue - Other: $94,000
Interest Earnings: $32,000
Fines and Forfeits: $11,000
- Other Capital Outlay - Elementary and Secondary Education: $415,000
- Other Funds - Cash and Securities: $14,257,000
- State Intergovernmental - Education: $17,956,000
- Tax - Property: $8,333,000
General Sales and Gross Receipts: $3,456,000
Public Utilities Sales: $176,000
Occupation and Business License - Other: $168,000
Motor Vehicle License: $115,000
- Total Salaries and Wages: $14,008,000
Nottoway County government finances - Revenue in 2017:
- Assistance and Subsidies - Public Welfare, Federal Categorical Assistance Programs: $2,032,000
- Charges - Solid Waste Management: $422,000
Elementary and Secondary Education School Lunch: $285,000
Elementary and Secondary Education School Tuition and Transportation: $3,000
- Current Operations - Elementary and Secondary Education: $22,035,000
Police Protection: $1,080,000
Solid Waste Management: $735,000
Central Staff Services: $633,000
Financial Administration: $523,000
Correctional Institutions: $493,000
Judicial and Legal Services: $439,000
Libraries: $256,000
Health - Other: $231,000
General Public Buildings: $214,000
Local Fire Protection: $186,000
Protective Inspection and Regulation - Other: $94,000
Transit Utilities: $8,000
- Federal Intergovernmental - Education: $92,000
- General - Interest on Debt: $129,000
- Intergovernmental to Local - Other - Elementary and Secondary Education: $347,000
- Local Intergovernmental - Public Welfare: $906,000
Education: $416,000
- Long Term Debt - Beginning Outstanding - Unspecified Public Purpose: $3,215,000
Outstanding Unspecified Public Purpose: $2,761,000
Retired Unspecified Public Purpose: $454,000
- Miscellaneous - Rents: $609,000
General Revenue - Other: $94,000
Interest Earnings: $32,000
Fines and Forfeits: $11,000
- Other Capital Outlay - Elementary and Secondary Education: $415,000
- Other Funds - Cash and Securities: $14,257,000
- State Intergovernmental - Education: $17,956,000
- Tax - Property: $8,333,000
General Sales and Gross Receipts: $3,456,000
Public Utilities Sales: $176,000
Occupation and Business License - Other: $168,000
Motor Vehicle License: $115,000
- Total Salaries and Wages: $14,008,000
Nottoway County government finances - Debt in 2017:
- Assistance and Subsidies - Public Welfare, Federal Categorical Assistance Programs: $2,032,000
- Charges - Solid Waste Management: $422,000
Elementary and Secondary Education School Lunch: $285,000
Elementary and Secondary Education School Tuition and Transportation: $3,000
- Current Operations - Elementary and Secondary Education: $22,035,000
Police Protection: $1,080,000
Solid Waste Management: $735,000
Central Staff Services: $633,000
Financial Administration: $523,000
Correctional Institutions: $493,000
Judicial and Legal Services: $439,000
Libraries: $256,000
Health - Other: $231,000
General Public Buildings: $214,000
Local Fire Protection: $186,000
Protective Inspection and Regulation - Other: $94,000
Transit Utilities: $8,000
- Federal Intergovernmental - Education: $92,000
- General - Interest on Debt: $129,000
- Intergovernmental to Local - Other - Elementary and Secondary Education: $347,000
- Local Intergovernmental - Public Welfare: $906,000
Education: $416,000
- Long Term Debt - Beginning Outstanding - Unspecified Public Purpose: $3,215,000
Outstanding Unspecified Public Purpose: $2,761,000
Retired Unspecified Public Purpose: $454,000
- Miscellaneous - Rents: $609,000
General Revenue - Other: $94,000
Interest Earnings: $32,000
Fines and Forfeits: $11,000
- Other Capital Outlay - Elementary and Secondary Education: $415,000
- Other Funds - Cash and Securities: $14,257,000
- State Intergovernmental - Education: $17,956,000
- Tax - Property: $8,333,000
General Sales and Gross Receipts: $3,456,000
Public Utilities Sales: $176,000
Occupation and Business License - Other: $168,000
Motor Vehicle License: $115,000
- Total Salaries and Wages: $14,008,000
Nottoway County government finances - Cash and Securities in 2017:
- Assistance and Subsidies - Public Welfare, Federal Categorical Assistance Programs: $2,032,000
- Charges - Solid Waste Management: $422,000
Elementary and Secondary Education School Lunch: $285,000
Elementary and Secondary Education School Tuition and Transportation: $3,000
- Current Operations - Elementary and Secondary Education: $22,035,000
Police Protection: $1,080,000
Solid Waste Management: $735,000
Central Staff Services: $633,000
Financial Administration: $523,000
Correctional Institutions: $493,000
Judicial and Legal Services: $439,000
Libraries: $256,000
Health - Other: $231,000
General Public Buildings: $214,000
Local Fire Protection: $186,000
Protective Inspection and Regulation - Other: $94,000
Transit Utilities: $8,000
- Federal Intergovernmental - Education: $92,000
- General - Interest on Debt: $129,000
- Intergovernmental to Local - Other - Elementary and Secondary Education: $347,000
- Local Intergovernmental - Public Welfare: $906,000
Education: $416,000
- Long Term Debt - Beginning Outstanding - Unspecified Public Purpose: $3,215,000
Outstanding Unspecified Public Purpose: $2,761,000
Retired Unspecified Public Purpose: $454,000
- Miscellaneous - Rents: $609,000
General Revenue - Other: $94,000
Interest Earnings: $32,000
Fines and Forfeits: $11,000
- Other Capital Outlay - Elementary and Secondary Education: $415,000
- Other Funds - Cash and Securities: $14,257,000
- State Intergovernmental - Education: $17,956,000
- Tax - Property: $8,333,000
General Sales and Gross Receipts: $3,456,000
Public Utilities Sales: $176,000
Occupation and Business License - Other: $168,000
Motor Vehicle License: $115,000
- Total Salaries and Wages: $14,008,000
Supplemental Security Income (SSI) in 2006:
- Total number of recipients: 564
- Number of aged recipients: 97
- Number of blind and disabled recipients: 467
- Number of recipients under 18: 91
- Number of recipients between 18 and 64: 300
- Number of recipients older than 64: 173
- Number of recipients also receiving OASDI: 241
- Amount of payments (thousands of dollars): 222
| Most common first names in Nottoway County, VA among deceased individuals | ||
| Name | Count | Lived (average) |
|---|---|---|
| James | 237 | 71.7 years |
| Mary | 194 | 81.0 years |
| John | 184 | 76.2 years |
| William | 181 | 73.1 years |
| Robert | 151 | 72.1 years |
| George | 108 | 75.6 years |
| Charles | 82 | 72.8 years |
| Willie | 71 | 78.1 years |
| Thomas | 65 | 72.3 years |
| Annie | 64 | 82.6 years |
| Most common last names in Nottoway County, VA among deceased individuals | ||
| Last name | Count | Lived (average) |
|---|---|---|
| Jones | 145 | 76.3 years |
| Johnson | 101 | 74.3 years |
| Williams | 80 | 74.5 years |
| Jackson | 63 | 77.7 years |
| Fowlkes | 62 | 74.9 years |
| Jennings | 59 | 75.2 years |
| Fitzgerald | 55 | 74.1 years |
| Tucker | 54 | 75.8 years |
| Wilson | 52 | 73.6 years |
| Robertson | 52 | 77.3 years |
| Businesses in Nottoway County, VA | ||||
| Name | Count | Name | Count | |
|---|---|---|---|---|
| Advance Auto Parts | 1 | McDonald's | 1 | |
| Arby's | 1 | Nike | 2 | |
| Comfort Inn | 1 | Pizza Hut | 1 | |
| Goodwill | 3 | RadioShack | 1 | |
| H&R Block | 1 | Subway | 2 | |
| Hardee's | 2 | U-Haul | 2 | |
| Kincaid | 1 | UPS | 2 | |
| La-Z-Boy | 1 | Walmart | 1 | |
| Lane Furniture | 2 | Wendy's | 1 | |
| Long John Silver's | 1 | |||