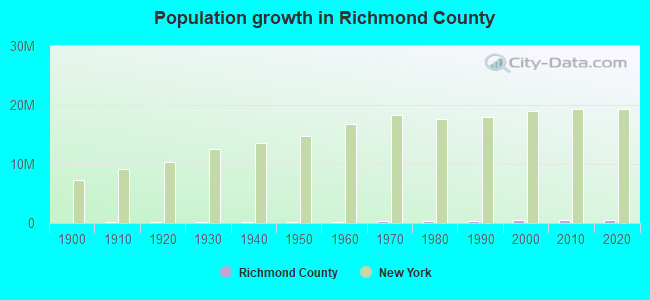
Richmond County, New York (NY)
County owner-occupied free and clear houses and condos in 2010: 26,501
County owner-occupied houses and condos in 2000: 99,732
Renter-occupied apartments: 59,381 (it was 56,609 in 2000)
| % of renters here: | 36% |
| State: | 47% |
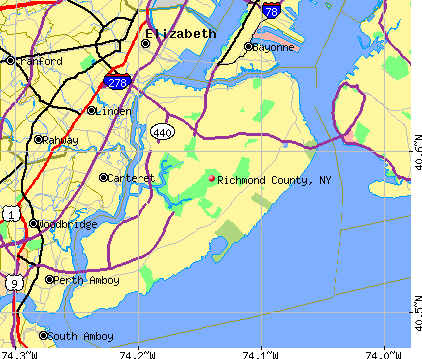
Land area: 58 sq. mi.
Water area: 44.0 sq. mi.
Population density: 8398 people per square mile (very high).
Industries providing employment: Educational, health and social services (33.1%), Professional, scientific, management, administrative, and waste management services (10.2%), Retail trade (10.2%).
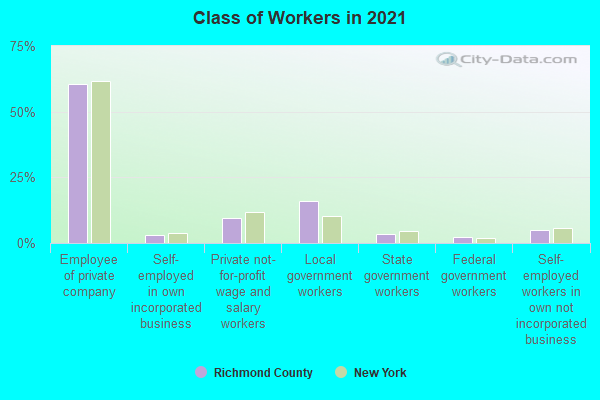
Type of workers:
- Private wage or salary: 75%
- Government: 21%
- Self-employed, not incorporated: 4%
- Unpaid family work: 0%
- OSM Map
- General Map
- Google Map
- MSN Map

- 273,56055.7%White Non-Hispanic Alone
- 92,53018.8%Hispanic or Latino
- 63,89813.0%Asian alone
- 44,2639.0%Black Non-Hispanic Alone
- 10,5732.2%Two or more races
- 5,3401.1%Some other race alone
- 9280.2%American Indian and Alaska Native alone
- 410.01%Native Hawaiian and Other
Pacific Islander alone

| Median resident age: | 40.8 years |
| New York median age: | 40.0 years |
| Males: 241,330 | |
| Females: 249,803 |


| Richmond County: | 2.0 people |
| New York: | 3 people |
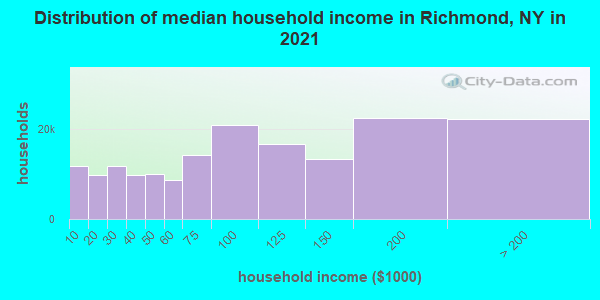
Estimated median household income in 2022: $93,164 ($55,039 in 1999)
| This county: | $93,164 |
| New York: | $79,557 |
Median contract rent in 2022 for apartments: $1,516 (lower quartile is $1,007, upper quartile is $1,904)
| This county: | $1516 |
| State: | $1354 |
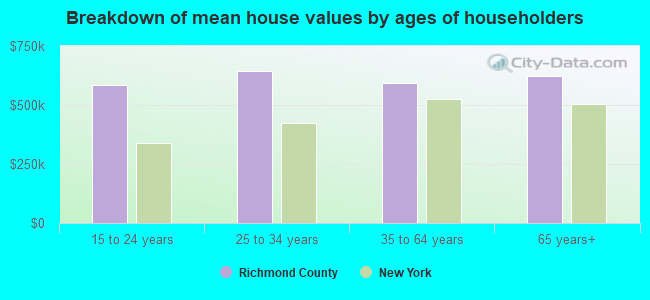
Estimated median house or condo value in 2022: $632,900 (it was $216,600 in 2000)
| Richmond: | $632,900 |
| New York: | $400,400 |
Mean price in 2022:
Median monthly housing costs for homes and condos with a mortgage: $2,674Detached houses: $774,052
Here: $774,052 State: $476,719 Townhouses or other attached units: $568,384
Here: $568,384 State: $699,270 In 2-unit structures: $616,275
Here: $616,275 State: $713,077 In 3-to-4-unit structures: $375,751
Here: $375,751 State: $764,568 In 5-or-more-unit structures: $447,753
Here: $447,753 State: $912,009 Mobile homes: $302,917
Here: $302,917 State: $88,925
Median monthly housing costs for units without a mortgage: $971
Institutionalized population: 3,862
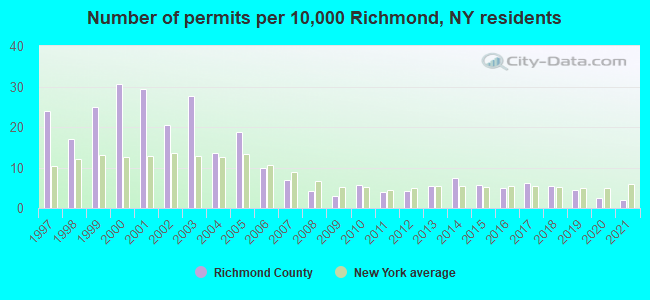
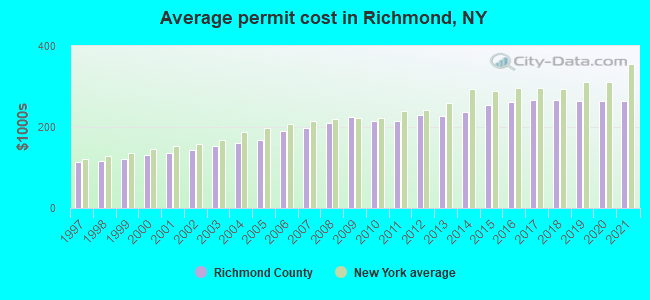
Single-family new house construction building permits:
- 2022: 19 buildings, average cost: $279,700
- 2021: 86 buildings, average cost: $262,700
- 2020: 106 buildings, average cost: $264,900
- 2019: 200 buildings, average cost: $264,200
- 2018: 241 buildings, average cost: $266,400
- 2017: 275 buildings, average cost: $265,900
- 2016: 216 buildings, average cost: $261,100
- 2015: 247 buildings, average cost: $255,200
- 2014: 326 buildings, average cost: $236,200
- 2013: 241 buildings, average cost: $225,800
- 2012: 191 buildings, average cost: $229,200
- 2011: 179 buildings, average cost: $215,500
- 2010: 251 buildings, average cost: $216,400
- 2009: 130 buildings, average cost: $224,000
- 2008: 185 buildings, average cost: $211,400
- 2007: 310 buildings, average cost: $196,600
- 2006: 437 buildings, average cost: $190,800
- 2005: 829 buildings, average cost: $169,400
- 2004: 604 buildings, average cost: $160,700
- 2003: 1222 buildings, average cost: $151,900
- 2002: 913 buildings, average cost: $144,400
- 2001: 1306 buildings, average cost: $137,400
- 2000: 1361 buildings, average cost: $129,600
- 1999: 1102 buildings, average cost: $120,500
- 1998: 761 buildings, average cost: $116,400
- 1997: 1063 buildings, average cost: $112,500
Median real estate property taxes paid for housing units with mortgages in 2022: $5,599 (0.9%)
Median real estate property taxes paid for housing units with no mortgage in 2022: $5,694 (0.9%)


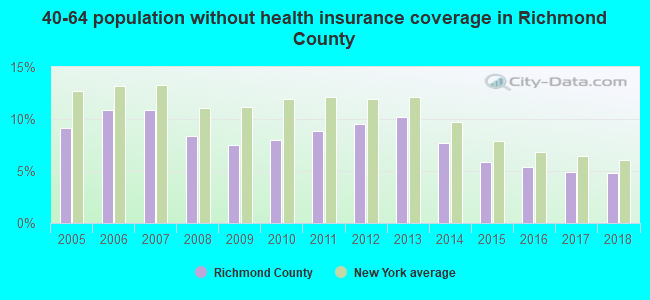
| Richmond County: | 11.0% |
| New York: | 14.3% |
Median age of residents in 2022: 40.8 years old
(Males: 39.2 years old, Females: 42.4 years old)
(Median age for: White residents: 46.2 years old, Black residents: 34.8 years old, American Indian residents: 33.8 years old, Asian residents: 41.3 years old, Hispanic or Latino residents: 32.6 years old, Other race residents: 31.6 years old)
Area name: New York-Monmouth-Ocean, NY-NJ HUD Metro FMR Area
Fair market rent in 2006 for a 1-bedroom apartment in Richmond County is $1003 a month.
Fair market rent for a 2-bedroom apartment is $1133 a month.
Fair market rent for a 3-bedroom apartment is $1406 a month.
Cities in this county include: Staten Island.
2023 air pollution in Richmond County:
Ozone (1-hour): 0.033 ppm (standard limit: 0.12 ppm). Near U.S. average.
Particulate Matter (PM2.5) Annual: 8.4 µg/m3(standard limit: 15.0 µg/m3). Near U.S. average.
Neighboring counties: Des Moines County, Iowa  , Hardin County, Ohio , Hancock County, Illinois , Perry County, Pennsylvania , Montgomery County, Indiana , Somerset County, Pennsylvania , Richardson County, Nebraska .
| Here: | 4.6% |
| New York: | 4.4% |
Current college students: 28,243
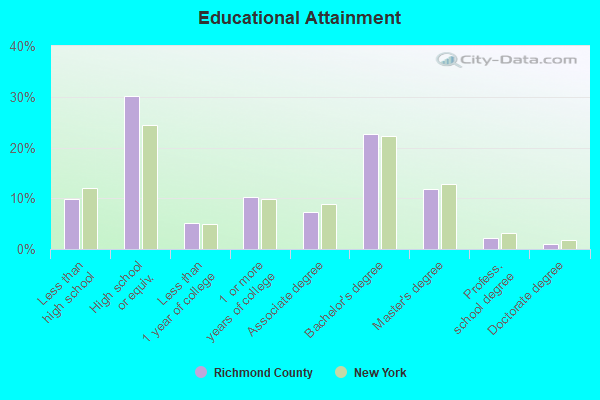
People 25 years of age or older with a high school degree or higher: 88.6%
People 25 years of age or older with a bachelor's degree or higher: 34.0%
Number of foreign born residents: 127,780 (68.9% naturalized citizens)
| Richmond County: | 26.0% |
| Whole state: | 22.7% |
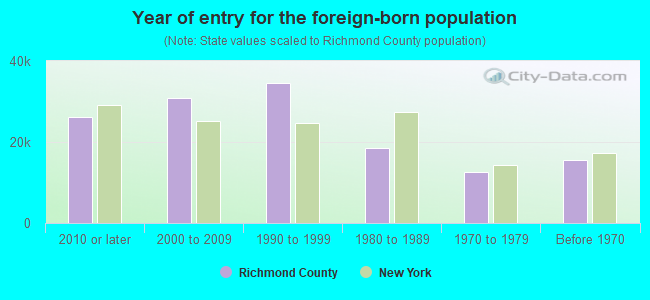
- Year of entry for the foreign-born population
- 32,7272010 or later
- 29,8882000 to 2009
- 34,0031990 to 1999
- 18,4021980 to 1989
- 12,6241970 to 1979
- 15,551Before 1970
Mean travel time to work (commute): * minutes
Percentage of county residents living and working in this county: 93.8%
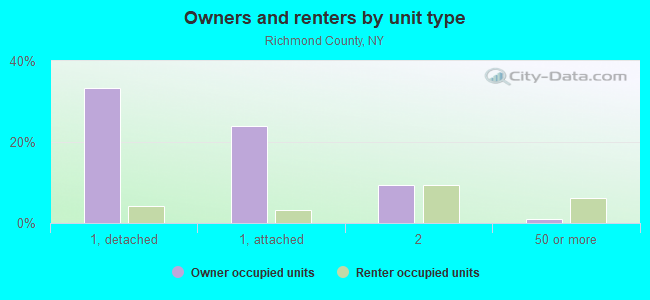
Housing units in structures:
- One, detached: 65,328
- One, attached: 46,743
- Two: 40,386
- 3 or 4: 6,898
- 5 to 9: 4,588
- 10 to 19: 2,976
- 20 to 49: 3,038
- 50 or more: 14,046
- Mobile homes: 494
Housing units in Richmond County with a mortgage: 74,516 (6,533 second mortgage, 118 home equity loan, 5,396 both second mortgage and home equity loan)
Houses without a mortgage: 2,568
| Here: | 97.4% with mortgage |
| State: | 95.5% with mortgage |
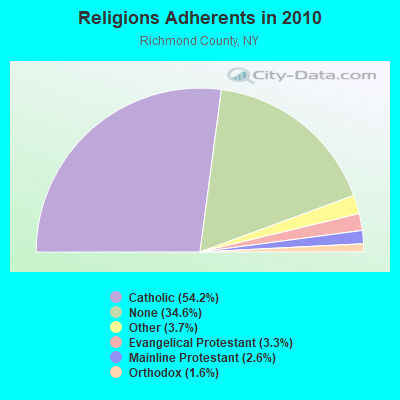
Religion statistics for Richmond County
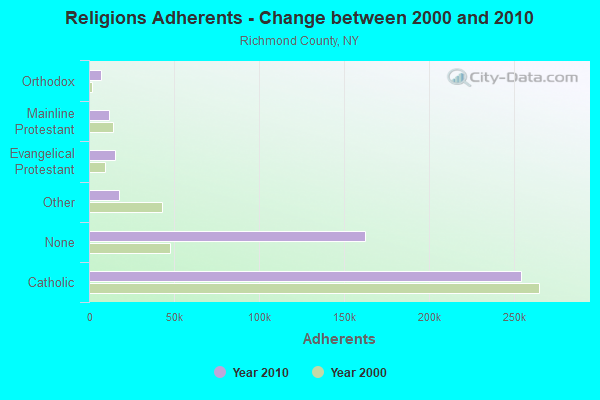
| Religion | Adherents | Congregations |
|---|---|---|
| Catholic | 254,170 | 41 |
| Other | 17,563 | 29 |
| Evangelical Protestant | 15,270 | 66 |
| Mainline Protestant | 12,037 | 46 |
| Orthodox | 7,311 | 9 |
| Black Protestant | 331 | 8 |
| None | 162,048 | - |
Source: Clifford Grammich, Kirk Hadaway, Richard Houseal, Dale E.Jones, Alexei Krindatch, Richie Stanley and Richard H.Taylor. 2012. 2010 U.S.Religion Census: Religious Congregations & Membership Study. Association of Statisticians of American Religious Bodies. Jones, Dale E., et al. 2002. Congregations and Membership in the United States 2000. Nashville, TN: Glenmary Research Center.
Food Environment Statistics:
| Richmond County: | 3.44 / 10,000 pop. |
| State: | 4.13 / 10,000 pop. |
| Here: | 0.04 / 10,000 pop. |
| New York: | 0.06 / 10,000 pop. |
| This county: | 1.12 / 10,000 pop. |
| New York: | 0.92 / 10,000 pop. |
| Richmond County: | 0.46 / 10,000 pop. |
| New York: | 1.68 / 10,000 pop. |
| This county: | 5.34 / 10,000 pop. |
| State: | 8.82 / 10,000 pop. |
| Richmond County: | 8.7% |
| New York: | 8.2% |
| Richmond County: | 24.5% |
| State: | 23.8% |
| Here: | 17.2% |
| State: | 15.6% |
Agriculture in Richmond County:
Average size of farms: 3 acresAverage value of agricultural products sold per farm: $107,511
Average total farm production expenses per farm: $42,872
Average market value of all machinery and equipment per farm: $40,508
The percentage of farms operated by a family or individual: 56.25%
Average age of principal farm operators: 60 years
Earthquake activity:
Richmond County-area historical earthquake activity is significantly above New York state average. It is 69% smaller than the overall U.S. average.On 8/23/2011 at 17:51:04, a magnitude 5.8 (5.8 MW, Depth: 3.7 mi, Class: Moderate, Intensity: VI - VII) earthquake occurred 274.7 miles away from Richmond County center
On 10/7/1983 at 10:18:46, a magnitude 5.3 (5.1 MB, 5.3 LG, 5.1 ML) earthquake occurred 233.4 miles away from the county center
On 1/16/1994 at 01:49:16, a magnitude 4.6 (4.6 MB, 4.6 LG, Depth: 3.1 mi, Class: Light, Intensity: IV - V) earthquake occurred 101.3 miles away from the county center
On 4/20/2002 at 10:50:47, a magnitude 5.3 (5.3 ML, Depth: 3.0 mi) earthquake occurred 272.8 miles away from the county center
On 4/20/2002 at 10:50:47, a magnitude 5.2 (5.2 MB, 4.2 MS, 5.2 MW, 5.0 MW) earthquake occurred 270.9 miles away from Richmond County center
On 1/16/1994 at 00:42:43, a magnitude 4.2 (4.2 MB, 4.0 LG, Depth: 3.1 mi) earthquake occurred 99.8 miles away from the county center
Magnitude types: regional Lg-wave magnitude (LG), body-wave magnitude (MB), local magnitude (ML), surface-wave magnitude (MS), moment magnitude (MW)
Most recent natural disasters:
- New York Tropical Storm Isaias, Incident Period: August 4, 2020, FEMA Id: 4567, Natural disaster type: Tropical Storm
- New York Covid-19 Pandemic, Incident Period: January 20, 2020, Major Disaster (Presidential) Declared DR-4480-NY: March 20, 2020, FEMA Id: 4480, Natural disaster type: Other
- New York Hurricane Sandy, Incident Period: October 27, 2012 to November 09, 2012, Emergency Declared EM-3351: October 28, 2012, FEMA Id: 3351, Natural disaster type: Hurricane
- New York Hurricane Sandy, Incident Period: October 27, 2012 to November 09, 2012, Major Disaster (Presidential) Declared DR-4085: October 30, 2012, FEMA Id: 4085, Natural disaster type: Hurricane
- New York Hurricane Irene, Incident Period: August 26, 2011 to September 05, 2011, Major Disaster (Presidential) Declared DR-4020: August 31, 2011, FEMA Id: 4020, Natural disaster type: Hurricane
- New York Hurricane Irene, Incident Period: August 25, 2011 to September 05, 2011, Emergency Declared EM-3328: August 26, 2011, FEMA Id: 3328, Natural disaster type: Hurricane
- New York Severe Storms, Tornadoes, and Straight-line Winds, Incident Period: September 16, 2010, Major Disaster (Presidential) Declared DR-1943: October 14, 2010, FEMA Id: 1943, Natural disaster type: Storm, Tornado, Wind
- New York Severe Storms and Flooding, Incident Period: March 13, 2010 to March 31, 2010, Major Disaster (Presidential) Declared DR-1899: April 16, 2010, FEMA Id: 1899, Natural disaster type: Storm, Flood
- New York Severe Storms and Inland and Coastal Flooding, Incident Period: April 14, 2007 to April 18, 2007, Major Disaster (Presidential) Declared DR-1692: April 24, 2007, FEMA Id: 1692, Natural disaster type: Storm, Flood
- New York Hurricane Katrina Evacuation, Incident Period: August 29, 2005 to October 01, 2005, Emergency Declared EM-3262: September 30, 2005, FEMA Id: 3262, Natural disaster type: Hurricane
- 9 other natural disasters have been reported since 1953.
The number of natural disasters in Richmond County (19) is greater than the US average (15).
Major Disasters (Presidential) Declared: 11
Emergencies Declared: 7
Causes of natural disasters: Hurricanes: 5, Storms: 5, Floods: 4, Blizzards: 2, Power Outage: 1, Snowstorm: 1, Tornado: 1, Tropical Storm: 1, Water Shortage: 1, Wind: 1, Other: 3 (Note: some incidents may be assigned to more than one category).
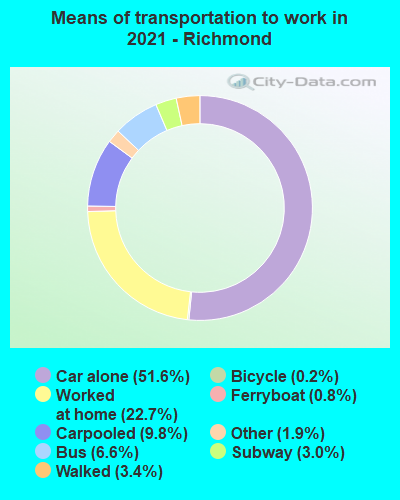
Means of transportation to work:
- Drove a car alone: 85,400 (57.1%)
- Carpooled: 15,026 (10.1%)
- Bus: 11,528 (7.7%)
- Subway or elevated rail: 3,641 (2.4%)
- Long-distance train or commuter rail: 229 (0.2%)
- Ferryboat: 937 (0.6%)
- Taxicab, motorcycle, or other means: 3,250 (2.2%)
- Bicycle: 362 (0.2%)
- Walked: 5,802 (3.9%)
- Worked at home: 23,286 (15.6%)
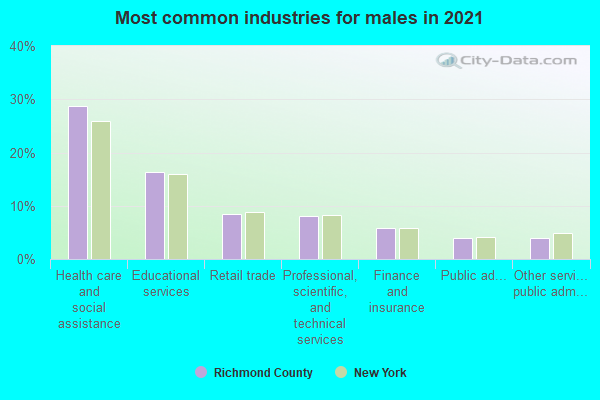
- Health care and social assistance (28%)
- Educational services (18%)
- Retail trade (9%)
- Professional, scientific, and technical services (7%)
- Other services, except public administration (5%)
- Finance and insurance (5%)
- Transportation and warehousing (3%)
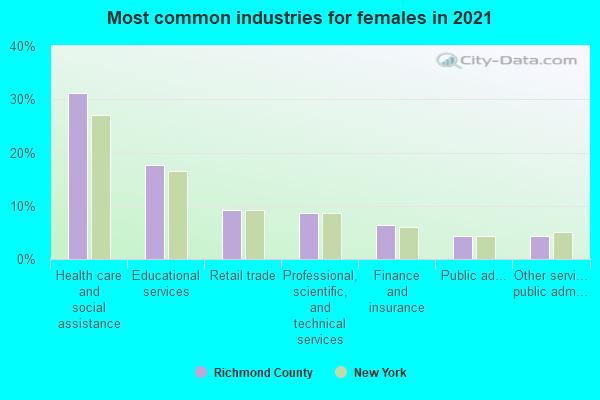
- Health care and social assistance (31%)
- Educational services (20%)
- Retail trade (10%)
- Professional, scientific, and technical services (7%)
- Other services, except public administration (5%)
- Finance and insurance (5%)
- Transportation and warehousing (3%)
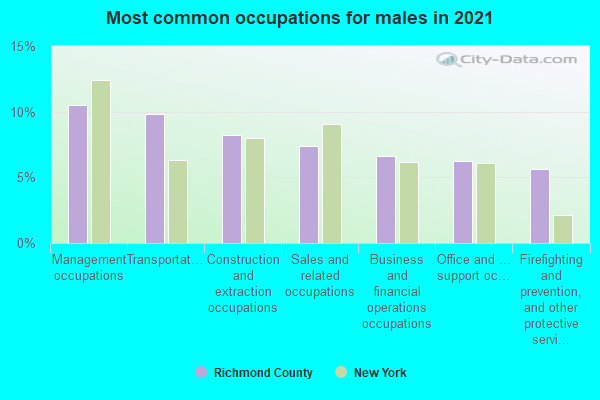
- Transportation occupations (11%)
- Office and administrative support occupations (9%)
- Sales and related occupations (9%)
- Construction and extraction occupations (8%)
- Management occupations (7%)
- Business and financial operations occupations (6%)
- Installation, maintenance, and repair occupations (5%)
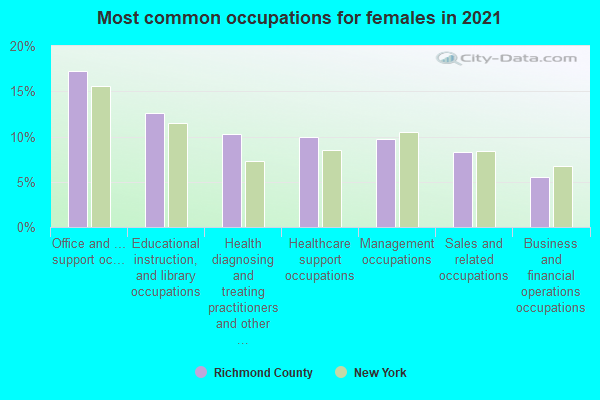
- Office and administrative support occupations (16%)
- Educational instruction, and library occupations (15%)
- Management occupations (9%)
- Healthcare support occupations (9%)
- Sales and related occupations (9%)
- Health diagnosing and treating practitioners and other technical occupations (8%)
- Business and financial operations occupations (6%)
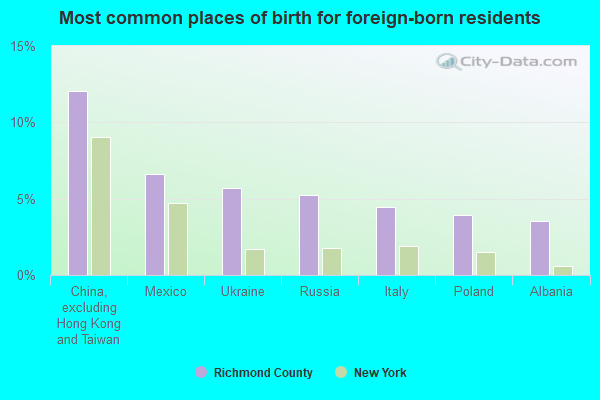
- China, excluding Hong Kong and Taiwan (15%)
- Mexico (6%)
- Ukraine (6%)
- Italy (5%)
- Egypt (4%)
- Russia (4%)
- Other Eastern Europe (3%)
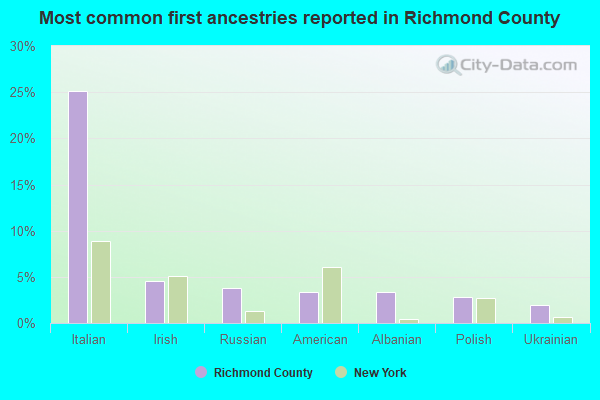
- Italian (25%)
- Irish (4%)
- American (3%)
- Russian (3%)
- Egyptian (3%)
- Albanian (3%)
- Polish (2%)
People in group quarters in Richmond County, New York in 2010:
- 2,705 people in nursing facilities/skilled-nursing facilities
- 1,457 people in college/university student housing
- 975 people in group homes intended for adults
- 918 people in state prisons
- 818 people in residential treatment centers for adults
- 414 people in other noninstitutional facilities
- 259 people in emergency and transitional shelters (with sleeping facilities) for people experiencing homelessness
- 114 people in group homes for juveniles (non-correctional)
- 86 people in residential treatment centers for juveniles (non-correctional)
- 47 people in military barracks and dormitories (nondisciplinary)
- 33 people in correctional facilities intended for juveniles
- 6 people in correctional residential facilities
- 5 people in workers' group living quarters and job corps centers
People in group quarters in Richmond County, New York in 2000:
- 3,300 people in nursing homes
- 1,124 people in other noninstitutional group quarters
- 1,048 people in college dormitories (includes college quarters off campus)
- 944 people in state prisons
- 750 people in homes for the mentally retarded
- 448 people in mental (psychiatric) hospitals or wards
- 371 people in other nonhousehold living situations
- 285 people in other group homes
- 227 people in hospitals or wards for drug/alcohol abuse
- 227 people in religious group quarters
- 166 people in homes for the mentally ill
- 131 people in military barracks, etc.
- 35 people in unknown juvenile institutions
- 32 people in homes or halfway houses for drug/alcohol abuse
- 30 people in schools, hospitals, or wards for the intellectually disabled
- 25 people in hospitals/wards and hospices for chronically ill
- 25 people in hospices or homes for chronically ill
- 25 people in homes for abused, dependent, and neglected children
- 18 people in crews of maritime vessels
4.47% of this county's 2021 resident taxpayers lived in other counties in 2020 ($58,429 average adjusted gross income)
| Here: | 4.47% |
| New York average: | 5.29% |
10 or fewer of this county's residents moved from foreign countries.
3.34% relocated from other counties in New York ($43,437 average AGI)
1.13% relocated from other states ($14,992 average AGI)
Richmond County: 1.13% New York average: 1.86%

Top counties from which taxpayers relocated into this county between 2020 and 2021:
| from Kings County, NY | |
| from Queens County, NY | |
| from New York County, NY | |
| from Bronx County, NY | |
| from Monmouth County, NJ | |
| from Middlesex County, NJ | |
| from Hudson County, NJ |
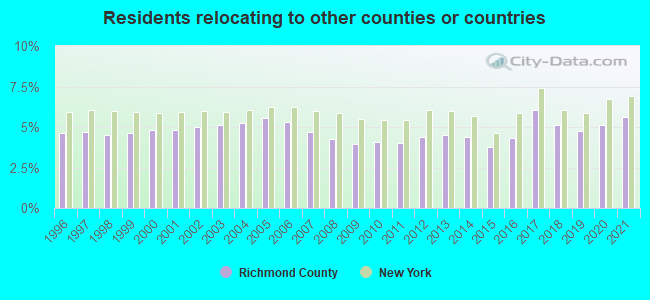
5.61% of this county's 2020 resident taxpayers moved to other counties in 2021 ($81,951 average adjusted gross income)
| Here: | 5.61% |
| New York average: | 6.93% |
0.01% of residents moved to foreign countries ($144 average AGI)
Richmond County: 0.01% New York average: 0.02%
1.74% relocated to other counties in New York ($18,648 average AGI)
3.86% relocated to other states ($63,159 average AGI)
Richmond County: 3.86% New York average: 3.55%
Top counties to which taxpayers relocated from this county between 2020 and 2021:
| to Kings County, NY | |
| to Monmouth County, NJ | |
| to Middlesex County, NJ | |
| to Queens County, NY | |
| to Ocean County, NJ | |
| to New York County, NY | |
| to Hudson County, NJ |
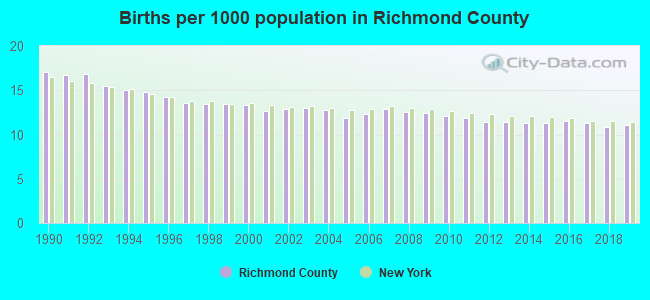
Births per 1000 population from 1990 to 1999: 15.0
Births per 1000 population from 2000 to 2009: 12.7
Births per 1000 population from 2010 to 2022: 9.6
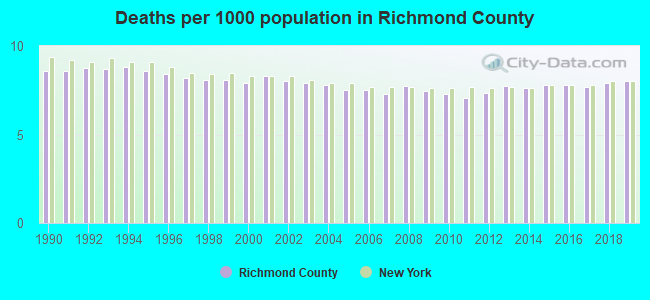
Deaths per 1000 population from 1990 to 1999: 8.5
Deaths per 1000 population from 2000 to 2009: 7.7
Deaths per 1000 population from 2010 to 2020: 7.9
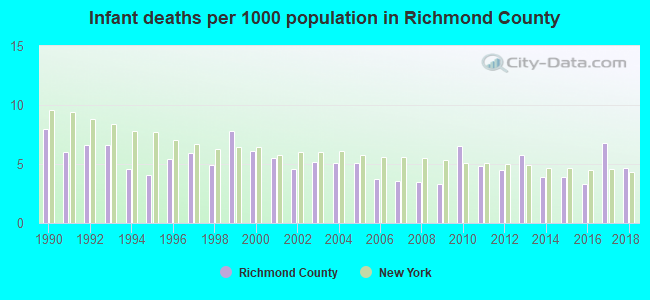
Infant deaths per 1000 live births from 1990 to 1999: 6.0
Infant deaths per 1000 live births from 2000 to 2009: 4.6
Infant deaths per 1000 live births from 2010 to 2021: 4.7
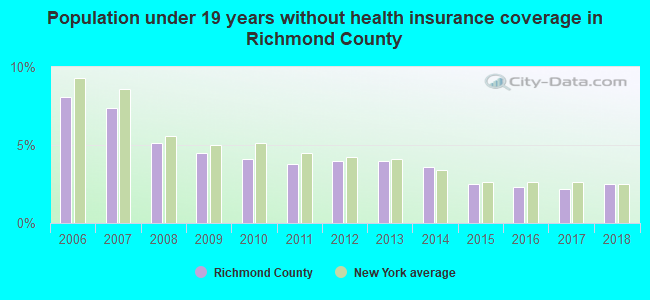
Persons under 19 years old without health insurance coverage in 2018: 2.5%

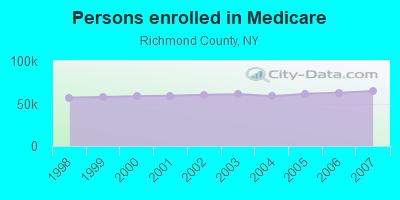
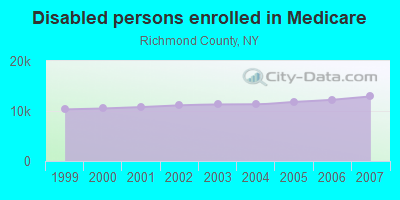
Persons enrolled in hospital insurance and/or supplemental medical insurance (Medicare) in July 1, 2007: 64,646 (51,722 aged, 12,924 disabled)
Children under 18 without health insurance coverage in 2007: 8,226 (7%)

Most common underlying causes of death in Richmond County, New York in 1999 - 2019:
- Atherosclerotic heart disease (18,968)
- Acute myocardial infarction, unspecified (5,948)
- Bronchus or lung, unspecified - Malignant neoplasms (4,822)
- Chronic obstructive pulmonary disease, unspecified (2,330)
- Atherosclerotic cardiovascular disease, so described (2,328)
- Pneumonia, unspecified (2,271)
- Colon, unspecified - Malignant neoplasms (1,588)
- Breast, unspecified - Malignant neoplasms (1,445)
- Unspecified diabetes mellitus, without complications (1,434)
- Pancreas, unspecified - Malignant neoplasms (1,292)
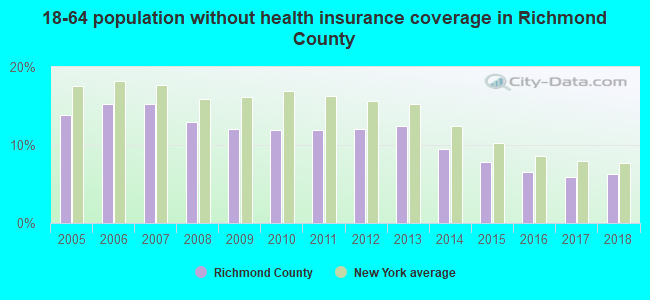
Population without health insurance coverage in 2000: 12%
Children under 18 without health insurance coverage in 2000: 7%
Short term general hospital admissions per 100,000 population in 2004: 15,115
Short term general hospital beds per 100,000 population in 2004: 270
Emergency room visits per 100,000 population in 2004: 39,447
General practice office based MDs per 100,000 population in 2005: 1,251
Medical specialist MDs per 100,000 population in 2005: 791
Dentists per 100,000 population in 1998: 7
Total births per 100,000 population, July 2005 - July 2006 : 66
Total deaths per 100,000 population, July 2005 - July 2006: 67
Limited-service eating places per 100,000 population in 2005 : 8
Beer, wine & liquor stores per 100,000 population in 2005: 1
EPA green book nonattainment status in 2004-2006: 1
Suicides per 1,000,000 population from 2000 to 2006: 57.2. This is less than state average.
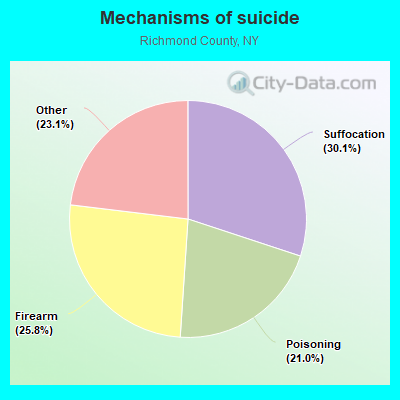
- Suffocation - 17.2
- Firearm - 14.8
- Poisoning - 12.0
- Other - 13.2
Household type by relationship:
Households: 491,133- Male householders: 81,243 (13,898 living alone), Female householders: 88,703 (24,600 living alone)
91,003 spouses (90,435 opposite-sex spouses), 9,591 unmarried partners, (9,167 opposite-sex unmarried partners), 161,861 children (155,848 natural, 1,025 adopted, 4,988 stepchildren), 10,213 grandchildren, 6,072 brothers or sisters, 14,531 parents, 0 foster children, 10,232 other relatives, 10,471 non-relatives
- In group quarters: 7,213
Size of family households: 41,044 2-persons, 28,235 3-persons, 28,789 4-persons, 16,109 5-persons, 7,655 6-persons, 2,835 7-or-more-persons.
Size of nonfamily households: 38,498 1-person, 5,929 2-persons, 548 3-persons, 61 4-persons, 206 6-persons, 37 7-or-more-persons.
72,160 married couples with children.
20,084 single-parent households (2,869 men, 17,215 women).
62.3% of residents of Richmond speak English at home.
10.5% of residents speak Spanish at home (66% speak English very well, 17% speak English well, 16% speak English not well, 1% don't speak English at all).
12.9% of residents speak other Indo-European language at home (67% speak English very well, 23% speak English well, 8% speak English not well, 2% don't speak English at all).
9.5% of residents speak Asian or Pacific Island language at home (41% speak English very well, 25% speak English well, 26% speak English not well, 9% don't speak English at all).
4.9% of residents speak other language at home (68% speak English very well, 23% speak English well, 6% speak English not well, 2% don't speak English at all).
In fiscal year 2004:
Federal Government expenditure: $0,000 ($0 per capita)
Department of Defense expenditure: $0,000
Federal direct payments to individuals for retirement and disability: $0,000
Federal other direct payments to individuals: $0,000
Federal direct payments not to individuals: $0,000
Federal grants: $0,000
Federal procurement contracts: $0,000 ($0,000 Department of Defense)
Federal salaries and wages: $0,000 ($0,000 Department of Defense)
Federal Government direct loans: $0,000
Federal guaranteed/insured loans: $0,000
Federal Government insurance: $0,000
Population change from April 1, 2000 to July 1, 2005:
Births: 30,709| Here: | 66 per 1000 residents |
| State: | 70 per 1000 residents |
Deaths: 18,575
| Here: | 40 per 1000 residents |
| State: | 42 per 1000 residents |
Net international migration: +10,538
| Here: | +23 per 1000 residents |
| State: | +35 per 1000 residents |
Net internal migration: -1,254
| Here: | |
| State: |
Total withdrawal of fresh water for public supply: 0.00 millions of gallons per day (all from surface)
| Here: | 6.1 |
| State: | 6.3 |
| Here: | 4.1 |
| State: | 3.8 |
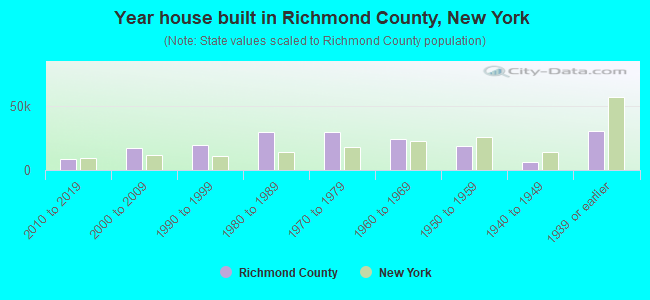
- Year house built in Richmond County, New York
- 6462020 or later
- 9,2152010 to 2019
- 14,2822000 to 2009
- 19,3941990 to 1999
- 28,1761980 to 1989
- 25,3931970 to 1979
- 28,0831960 to 1969
- 15,7881950 to 1959
- 7,4781940 to 1949
- 36,0421939 or earlier
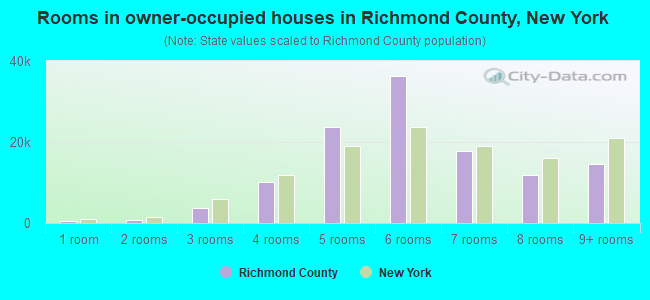
- Rooms in owner-occupied houses in Richmond County, New York
- 3501 room
- 1,2252 rooms
- 4,0033 rooms
- 11,7214 rooms
- 21,2545 rooms
- 34,9416 rooms
- 16,7327 rooms
- 12,7008 rooms
- 13,7749+ rooms
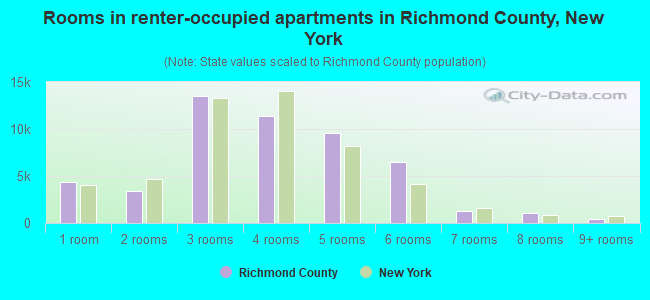
- Rooms in renter-occupied apartments in Richmond County, New York
- 4,3561 room
- 2,9022 rooms
- 11,6973 rooms
- 13,3434 rooms
- 10,9265 rooms
- 4,7966 rooms
- 2,5907 rooms
- 1,3298 rooms
- 1,3079+ rooms
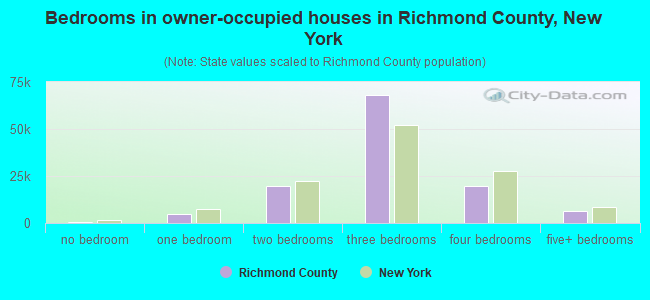
- Bedrooms in owner-occupied houses in Richmond County, New York
- 675no bedroom
- 3,6411 bedroom
- 18,9352 bedrooms
- 66,6943 bedrooms
- 20,3684 bedrooms
- 6,3875+ bedrooms
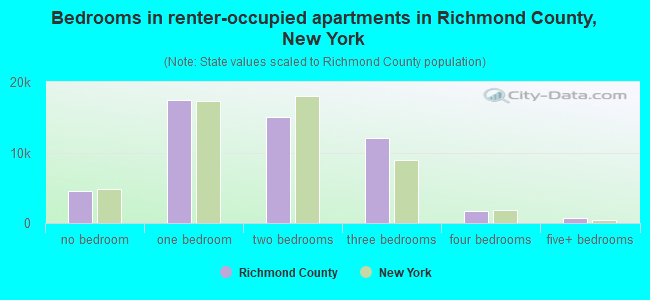
- Bedrooms in renter-occupied apartments in Richmond County, New York
- 4,767no bedroom
- 15,4731 bedroom
- 15,9212 bedrooms
- 14,0673 bedrooms
- 2,1334 bedrooms
- 8855+ bedrooms
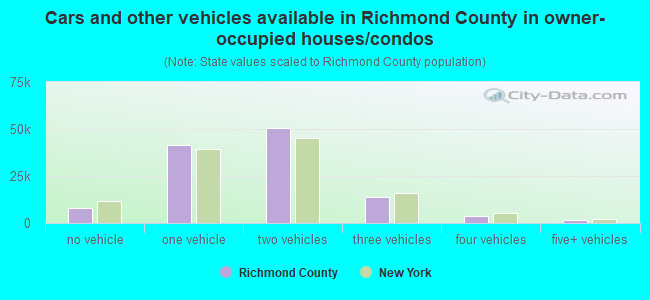
- Cars and other vehicles available in Richmond County in owner-occupied houses/condos
- 7,921no vehicle
- 41,2641 vehicle
- 48,1002 vehicles
- 13,5033 vehicles
- 4,7384 vehicles
- 1,1745+ vehicles
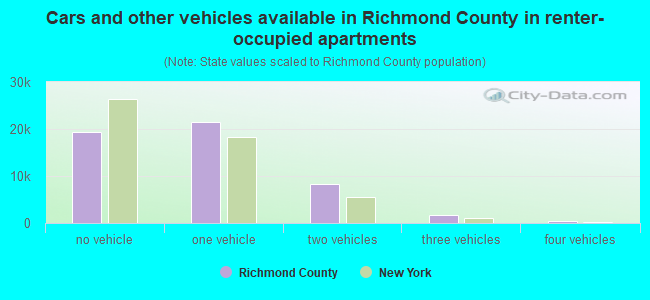
- Cars and other vehicles available in Richmond County in renter-occupied apartments
- 18,361no vehicle
- 24,2151 vehicle
- 9,5912 vehicles
- 9643 vehicles
- 1154 vehicles
- 05+ vehicles
94.2% of Richmond County residents lived in the same house 1 years ago.
Out of people who lived in different houses, 29% lived in this county.
Out of people who lived in different counties, 26% lived in New York.
| Richmond County: | 94.2% |
| State average: | 89.6% |
Place of birth for U.S.-born residents:
- This state: 328,412
- Other state: 22,666
- Northeast: 8,267
- Midwest: 4,156
- South: 8,451
- West: 1,792

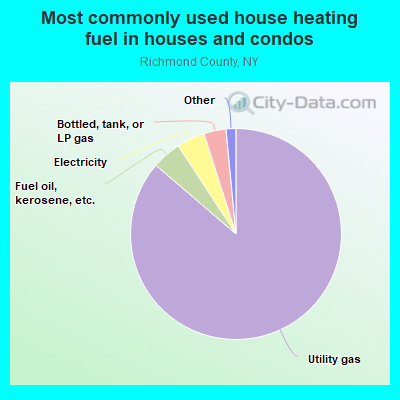
- 86.3%Utility gas
- 4.8%Fuel oil, kerosene, etc.
- 4.2%Electricity
- 2.9%Bottled, tank, or LP gas
- 1.0%Solar energy
- 0.5%No fuel used
- 0.2%Wood
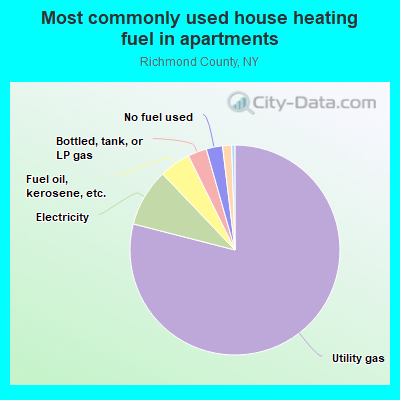
- 77.2%Utility gas
- 12.0%Electricity
- 5.1%Fuel oil, kerosene, etc.
- 2.8%No fuel used
- 1.8%Bottled, tank, or LP gas
- 0.5%Other fuel
- 0.4%Coal or coke
- 0.2%Solar energy
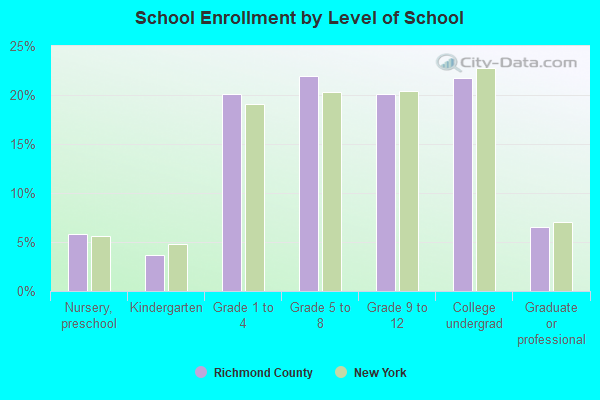
Private vs. public school enrollment:
| Here: | 17.4% |
| New York: | 15.6% |
| Here: | 22.7% |
| New York: | 15.0% |
| Here: | 26.0% |
| New York: | 39.2% |

Supplemental Security Income (SSI) in 2006:
- Total number of recipients: 12,682
- Number of aged recipients: 2,573
- Number of blind and disabled recipients: 10,109
- Number of recipients under 18: 1,432
- Number of recipients between 18 and 64: 7,008
- Number of recipients older than 64: 4,242
- Number of recipients also receiving OASDI: 3,893
- Amount of payments (thousands of dollars): 6,633
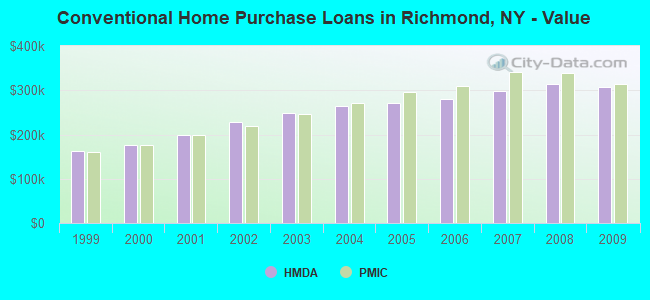
| Home Mortgage Disclosure Act Aggregated Statistics For Year 2009 (Based on 108 full tracts) | ||||||||||||||
| A) FHA, FSA/RHS & VA Home Purchase Loans | B) Conventional Home Purchase Loans | C) Refinancings | D) Home Improvement Loans | E) Loans on Dwellings For 5+ Families | F) Non-occupant Loans on < 5 Family Dwellings (A B C & D) | G) Loans On Manufactured Home Dwelling (A B C & D) | ||||||||
|---|---|---|---|---|---|---|---|---|---|---|---|---|---|---|
| Number | Average Value | Number | Average Value | Number | Average Value | Number | Average Value | Number | Average Value | Number | Average Value | Number | Average Value | |
| LOANS ORIGINATED | 740 | $341,481 | 1,900 | $306,674 | 3,813 | $272,195 | 246 | $153,089 | 22 | $412,955 | 167 | $238,653 | 8 | $401,750 |
| APPLICATIONS APPROVED, NOT ACCEPTED | 59 | $311,085 | 219 | $303,804 | 741 | $291,977 | 48 | $144,438 | 2 | $294,000 | 35 | $213,943 | 1 | $33,000 |
| APPLICATIONS DENIED | 195 | $334,523 | 471 | $300,259 | 2,993 | $320,236 | 366 | $96,393 | 7 | $296,286 | 213 | $233,146 | 3 | $42,667 |
| APPLICATIONS WITHDRAWN | 135 | $343,126 | 258 | $300,101 | 1,771 | $307,121 | 96 | $204,958 | 4 | $235,750 | 71 | $258,972 | 1 | $375,000 |
| FILES CLOSED FOR INCOMPLETENESS | 42 | $322,286 | 93 | $310,204 | 613 | $308,232 | 47 | $126,596 | 0 | $0 | 32 | $251,469 | 0 | $0 |
| Private Mortgage Insurance Companies Aggregated Statistics For Year 2009 (Based on 95 full tracts) | ||||||
| A) Conventional Home Purchase Loans | B) Refinancings | C) Non-occupant Loans on < 5 Family Dwellings (A & B) | ||||
|---|---|---|---|---|---|---|
| Number | Average Value | Number | Average Value | Number | Average Value | |
| LOANS ORIGINATED | 279 | $313,079 | 107 | $335,000 | 0 | $0 |
| APPLICATIONS APPROVED, NOT ACCEPTED | 103 | $326,699 | 59 | $355,051 | 1 | $280,000 |
| APPLICATIONS DENIED | 109 | $306,477 | 61 | $340,820 | 0 | $0 |
| APPLICATIONS WITHDRAWN | 48 | $199,375 | 17 | $311,353 | 0 | $0 |
| FILES CLOSED FOR INCOMPLETENESS | 18 | $263,722 | 9 | $311,667 | 0 | $0 |
Richmond County on our top lists:
- #28 on the list of "Top 101 counties with the lowest number of infant deaths per 1000 residents 2007-2013 (pop. 50,000+)"
- #34 on the list of "Top 101 counties with the largest decrease in the number of infant deaths per 1000 residents 2000-2006 to 2007-2013 (pop. 50,000+)"
- #38 on the list of "Top 101 counties with the lowest percentage of residents relocating from other counties between 2010 and 2011 (pop. 50,000+)"
- #39 on the list of "Top 101 counties with the most Orthodox adherents"
- #39 on the list of "Top 101 counties with the most Orthodox adherents (pop. 50,000+)"
- #49 on the list of "Top 101 counties with the lowest percentage of residents relocating to other counties in 2011 (pop. 50,000+)"
- #51 on the list of "Top 101 counties with the most Catholic adherents"
- #51 on the list of "Top 101 counties with the most Catholic adherents (pop. 50,000+)"
- #64 on the list of "Top 101 counties with the lowest percentage of residents relocating from other counties between 2010 and 2011"
- #66 on the list of "Top 101 counties with the most Orthodox congregations (pop. 50,000+)"
- #74 on the list of "Top 101 counties with the lowest percentage of residents relocating to other counties in 2011"
- #74 on the list of "Top 101 counties with the most Orthodox congregations"
- #87 on the list of "Top 101 counties with the most Catholic congregations"
- #87 on the list of "Top 101 counties with the most Catholic congregations (pop. 50,000+)"
- #96 on the list of "Top 101 counties with the lowest percentage of residents relocating from foreign countries between 2010 and 2011"