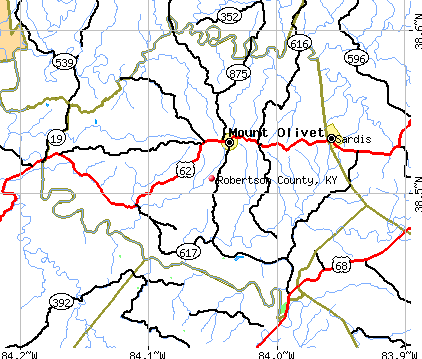
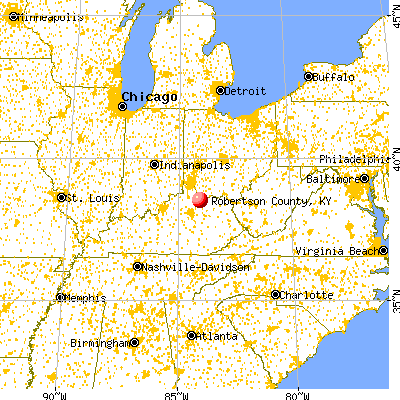
Robertson County, Kentucky (KY)
County owner-occupied free and clear houses and condos in 2010: 367
County owner-occupied houses and condos in 2000: 675
Renter-occupied apartments: 197 (it was 191 in 2000)
| % of renters here: | 22% |
| State: | 31% |
Land area: 100 sq. mi.
Water area: 0.0 sq. mi.
Population density: 22 people per square mile (low).
Industries providing employment: Educational, health and social services (23.9%), Manufacturing (17.7%), Construction (15.0%), Public administration (11.0%).
Type of workers:
- Private wage or salary: 62%
- Government: 25%
- Self-employed, not incorporated: 13%
- Unpaid family work: 0%
- OSM Map
- General Map
- Google Map
- MSN Map

- 2,10695.8%White Non-Hispanic Alone
- 462.1%Two or more races
- 401.8%Hispanic or Latino
- 60.3%Black Non-Hispanic Alone

| Median resident age: | 39.3 years |
| Kentucky median age: | 39.4 years |
| Males: 943 | |
| Females: 1,268 |

 | Black Bears back in Greater Louisville, first time since 1800s (10 replies) |
| Creepy Crawlies!! (65 replies) |
| Good Areas Northern Kentucky (12 replies) |
| Robertson County: | 2.0 people |
| Kentucky: | 2 people |
Estimated median household income in 2022: $53,045 ($30,581 in 1999)
| This county: | $53,045 |
| Kentucky: | $59,341 |
Median contract rent in 2022 for apartments: $348 (lower quartile is $303, upper quartile is $471)
| This county: | $348 |
| State: | $702 |
Estimated median house or condo value in 2022: $159,147 (it was $60,900 in 2000)
| Robertson: | $159,147 |
| Kentucky: | $196,300 |
Mean price in 2022:
Median monthly housing costs for homes and condos with a mortgage: $1,105Detached houses: $241,543
Here: $241,543 State: $256,452 Mobile homes: $204,425
Here: $204,425 State: $84,635
Median monthly housing costs for units without a mortgage: $369
Institutionalized population: 57
Crime in 2021 (reported by the sheriff's office or county police, not the county total):
- Murders: 0
- Rapes: 0
- Robberies: 0
- Assaults: 0
- Burglaries: 3
- Thefts: 1
- Auto thefts: 0
Crime in 2020 (reported by the sheriff's office or county police, not the county total):
- Murders: 0
- Rapes: 0
- Robberies: 0
- Assaults: 0
- Burglaries: 0
- Thefts: 8
- Auto thefts: 2
Median real estate property taxes paid for housing units with mortgages in 2022: $1,104 (0.5%)
Median real estate property taxes paid for housing units with no mortgage in 2022: $666 (0.6%)


| Robertson County: | 22.4% |
| Kentucky: | 16.5% |
Median age of residents in 2022: 39.3 years old
(Males: 46.4 years old, Females: 36.8 years old)
(Median age for: White residents: 39.3 years old, Black residents: 84.7 years old, Hispanic or Latino residents: 6.0 years old)
Fair market rent in 2006 for a 1-bedroom apartment in Robertson County is $365 a month.
Fair market rent for a 2-bedroom apartment is $450 a month.
Fair market rent for a 3-bedroom apartment is $562 a month.
Cities in this county include: Mount Olivet.
Neighboring counties: Bates County, Missouri  , Bracken County
  , Lawrence County, Illinois , Moniteau County, Missouri , Wabash County, Illinois , Stafford County, Kansas , White County, Illinois .
| Here: | 4.8% |
| Kentucky: | 3.8% |


Current college students: 81
People 25 years of age or older with a high school degree or higher: 84.2%
People 25 years of age or older with a bachelor's degree or higher: 12.2%
Number of foreign born residents: 3 (0.0% naturalized citizens)
| Robertson County: | 0.2% |
| Whole state: | 4.0% |

- Year of entry for the foreign-born population
- 52010 or later
- 02000 to 2009
- 01990 to 1999
- 41980 to 1989
- 01970 to 1979
- 0Before 1970
Mean travel time to work (commute): ! minutes
Percentage of county residents living and working in this county: 90.4%


Housing units in structures:
- One, detached: 784
- One, attached: 7
- Two: 1
- 3 or 4: 12
- 5 to 9: 10
- 10 to 19: 9
- 20 or more: 4
- Mobile homes: 214
- Boats, RVs, vans, etc.: 12
Housing units in Robertson County with a mortgage: 347 (20 second mortgage, 0 home equity loan, 5 both second mortgage and home equity loan)
Houses without a mortgage: 17
| Here: | 95.3% with mortgage |
| State: | 96.8% with mortgage |
Religion statistics for Robertson County
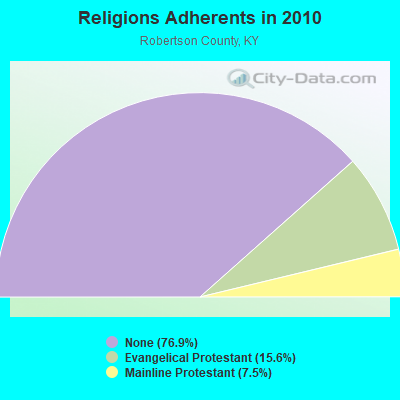
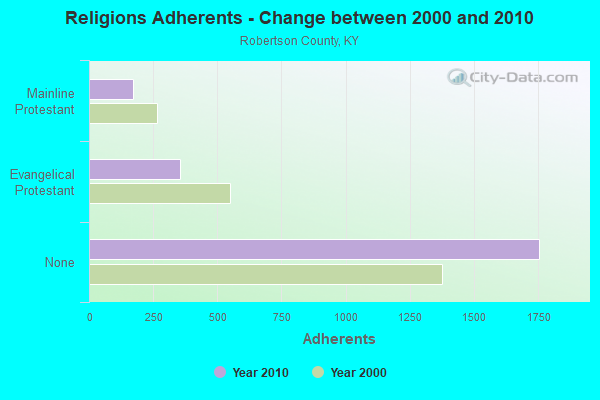
| Religion | Adherents | Congregations |
|---|---|---|
| Evangelical Protestant | 355 | 4 |
| Mainline Protestant | 172 | 3 |
| None | 1,755 | - |
Source: Clifford Grammich, Kirk Hadaway, Richard Houseal, Dale E.Jones, Alexei Krindatch, Richie Stanley and Richard H.Taylor. 2012. 2010 U.S.Religion Census: Religious Congregations & Membership Study. Association of Statisticians of American Religious Bodies. Jones, Dale E., et al. 2002. Congregations and Membership in the United States 2000. Nashville, TN: Glenmary Research Center.
Food Environment Statistics:
| Robertson County: | 4.58 / 10,000 pop. |
| State: | 2.19 / 10,000 pop. |
| Robertson County: | 10.9% |
| Kentucky: | 11.0% |
| Robertson County: | 31.5% |
| State: | 30.0% |
| Here: | 14.7% |
| State: | 15.9% |
Agriculture in Robertson County:
Average size of farms: 174 acresAverage value of agricultural products sold per farm: $10,065
Average value of crops sold per acre for harvested cropland: $179.26
The value of nursery, greenhouse, floriculture, and sod as a percentage of the total market value of agricultural products sold: 0.00%
The value of livestock, poultry, and their products as a percentage of the total market value of agricultural products sold: 36.73%
Average total farm production expenses per farm: $10,766
Harvested cropland as a percentage of land in farms: 20.38%
Irrigated harvested cropland as a percentage of land in farms: 0.82%
Average market value of all machinery and equipment per farm: $27,348
The percentage of farms operated by a family or individual: 90.28%
Average age of principal farm operators: 54 years
Average number of cattle and calves per 100 acres of all land in farms: 9.44
Milk cows as a percentage of all cattle and calves: 3.81%
Corn for grain: 50 harvested acres
All wheat for grain: 17 harvested acres
Land in orchards: 7 acres
Earthquake activity:
Robertson County-area historical earthquake activity is significantly above Kentucky state average. It is 49% greater than the overall U.S. average.On 7/27/1980 at 18:52:21, a magnitude 5.2 (5.1 MB, 4.7 MS, 5.0 UK, 5.2 UK, Class: Moderate, Intensity: VI - VII) earthquake occurred 21.8 miles away from Robertson County center
On 9/7/1988 at 02:28:09, a magnitude 4.6 (4.5 MB, 4.6 LG, Class: Light, Intensity: IV - V) earthquake occurred 27.0 miles away from the county center
On 4/18/2008 at 09:36:59, a magnitude 5.4 (5.1 MB, 4.8 MS, 5.4 MW, 5.2 MW) earthquake occurred 207.6 miles away from the county center
On 4/18/2008 at 09:36:59, a magnitude 5.2 (5.2 MW, Depth: 8.9 mi) earthquake occurred 207.7 miles away from the county center
On 8/23/2011 at 17:51:04, a magnitude 5.8 (5.8 MW, Depth: 3.7 mi) earthquake occurred 334.9 miles away from Robertson County center
On 6/10/1987 at 23:48:54, a magnitude 5.1 (4.9 MB, 4.4 MS, 4.6 MS, 5.1 LG) earthquake occurred 208.1 miles away from the county center
Magnitude types: regional Lg-wave magnitude (LG), body-wave magnitude (MB), surface-wave magnitude (MS), moment magnitude (MW)
Most recent natural disasters:
- Kentucky Covid-19 Pandemic, Incident Period: January 20, 2020, FEMA Id: 4497, Natural disaster type: Other
- Kentucky Severe Storms, Tornadoes, Straight-line Winds, Flooding, Landslides, and Mudslides, Incident Period: July 11, 2015 to July 20, 2015, Major Disaster (Presidential) Declared DR-4239: August 12, 2015, FEMA Id: 4239, Natural disaster type: Storm, Tornado, Mudslide, Landslide, Flood, Wind
- Kentucky Severe Winter Storm, Snowstorm, Flooding, Landslides, and Mudslides, Incident Period: March 03, 2015 to March 09, 2015, Major Disaster (Presidential) Declared DR-4218: May 12, 2015, FEMA Id: 4218, Natural disaster type: Snowstorm, Winter Storm, Mudslide, Landslide, Flood
- Kentucky Severe Storms, Tornadoes, and Flooding, Incident Period: April 12, 2011 to May 20, 2011, Major Disaster (Presidential) Declared DR-1976: May 04, 2011, FEMA Id: 1976, Natural disaster type: Storm, Tornado, Flood
- Kentucky Severe Storms, Flooding, Mudslides, and Tornadoes, Incident Period: May 01, 2010 to June 01, 2010, Major Disaster (Presidential) Declared DR-1912: May 11, 2010, FEMA Id: 1912, Natural disaster type: Storm, Tornado, Mudslide, Flood
- Kentucky Severe Winter Storm, Incident Period: January 27, 2009 to February 05, 2009, Emergency Declared EM-3302: January 28, 2009, FEMA Id: 3302, Natural disaster type: Winter Storm
- Kentucky Severe Winter Storm and Flooding, Incident Period: January 26, 2009 to February 13, 2009, Major Disaster (Presidential) Declared DR-1818: February 05, 2009, FEMA Id: 1818, Natural disaster type: Winter Storm, Flood
- Kentucky Hurricane Katrina Evacuation, Incident Period: August 29, 2005 to October 01, 2005, Emergency Declared EM-3231: September 10, 2005, FEMA Id: 3231, Natural disaster type: Hurricane
- Kentucky Severe Winter Storm and Record Snow, Incident Period: December 21, 2004 to December 23, 2004, Major Disaster (Presidential) Declared DR-1578: February 08, 2005, FEMA Id: 1578, Natural disaster type: Winter Storm, Snow
- Kentucky Severe Storms, Tornadoes, Flooding, and Mudslides, Incident Period: May 26, 2004 to June 18, 2004, Major Disaster (Presidential) Declared DR-1523: June 10, 2004, FEMA Id: 1523, Natural disaster type: Storm, Tornado, Mudslide, Flood
- 6 other natural disasters have been reported since 1953.
The number of natural disasters in Robertson County (16) is near the US average (15).
Major Disasters (Presidential) Declared: 12
Emergencies Declared: 3
Causes of natural disasters: Floods: 8, Winter Storms: 7, Storms: 6, Mudslides: 4, Tornadoes: 4, Landslides: 2, Blizzard: 1, Hurricane: 1, Snow: 1, Snowfall: 1, Snowstorm: 1, Wind: 1, Other: 1 (Note: some incidents may be assigned to more than one category).

Means of transportation to work:
- Drove a car alone: 348 (77.9%)
- Carpooled: 36 (8.1%)
- Walked: 16 (3.6%)
- Worked at home: 53 (11.9%)


- Educational services (21%)
- Public administration (19%)
- Health care and social assistance (19%)
- Construction (9%)
- Manufacturing (9%)
- Retail trade (9%)
- Accommodation and food services (7%)

- Educational services (18%)
- Public administration (16%)
- Health care and social assistance (16%)
- Construction (8%)
- Manufacturing (8%)
- Retail trade (8%)
- Accommodation and food services (6%)

- Management occupations (23%)
- Construction and extraction occupations (21%)
- Production occupations (15%)
- Material moving occupations (10%)
- Installation, maintenance, and repair occupations (8%)
- Transportation occupations (7%)
- Business and financial operations occupations (6%)

- Office and administrative support occupations (29%)
- Educational instruction, and library occupations (8%)
- Health diagnosing and treating practitioners and other technical occupations (8%)
- Sales and related occupations (8%)
- Healthcare support occupations (7%)
- Management occupations (6%)
- Personal care and service occupations (5%)

- Mexico (75%)
- Ireland (0%)
- Norway (0%)
- Sweden (0%)
- United Kingdom, excluding England and Scotland (0%)
- England (0%)
- Scotland (0%)

- American (42%)
- English (12%)
- German (11%)
- Irish (6%)
- Welsh (1%)
- European (1%)
- Lebanese (1%)


People in group quarters in Robertson County, Kentucky in 2000:
- 62 people in nursing homes
- 5 people in other nonhousehold living situations
- 3 people in other noninstitutional group quarters
6.71% of this county's 2021 resident taxpayers lived in other counties in 2020 ($36,771 average adjusted gross income)
| Here: | 6.71% |
| Kentucky average: | 7.04% |
10 or fewer of this county's residents moved from foreign countries.
6.71% relocated from other counties in Kentucky ($36,771 average AGI)
10 or fewer of this county's residents relocated from other states.

5.79% of this county's 2020 resident taxpayers moved to other counties in 2021 ($44,000 average adjusted gross income)
| Here: | 5.79% |
| Kentucky average: | 6.89% |
10 or fewer of this county's residents moved to foreign countries.
5.79% relocated to other counties in Kentucky ($44,000 average AGI)
10 or fewer of this county's residents relocated to other states.

Births per 1000 population from 1990 to 1999: 12.0
Births per 1000 population from 2000 to 2006: 9.9

Deaths per 1000 population from 1990 to 1999: 12.2
Deaths per 1000 population from 2000 to 2009: 13.1
Deaths per 1000 population from 2010 to 2020: 16.6

Infant deaths per 1000 live births from 1990 to 1999: 7.5

Persons under 19 years old without health insurance coverage in 2018: 4.6%


Persons enrolled in hospital insurance and/or supplemental medical insurance (Medicare) in July 1, 2007: 422 (321 aged, 101 disabled)
Children under 18 without health insurance coverage in 2007: 48 (10%)


Population without health insurance coverage in 2000: 13%
Children under 18 without health insurance coverage in 2000: 10%
Medical specialist MDs per 100,000 population in 2005: 1,009
Total births per 100,000 population, July 2005 - July 2006 : 45
Crimes per 100,000 population in 1996: 1
Household type by relationship:
Households: 2,211- Male householders: 408 (78 living alone), Female householders: 414 (107 living alone)
349 spouses (349 opposite-sex spouses), 131 unmarried partners, (131 opposite-sex unmarried partners), 589 children (435 natural, 37 adopted, 113 stepchildren), 85 grandchildren, 0 brothers or sisters, 6 parents, 0 foster children, 10 other relatives, 146 non-relatives
- In group quarters: 59
Size of family households: 198 2-persons, 170 3-persons, 84 4-persons, 62 5-persons, 32 6-persons, 8 7-or-more-persons.
Size of nonfamily households: 186 1-person, 58 2-persons, 24 7-or-more-persons.
210 married couples with children.
207 single-parent households (119 men, 88 women).
99.2% of residents of Robertson speak English at home.
0.8% of residents speak other Indo-European language at home (100% speak English well).
In fiscal year 2004:
Federal Government expenditure: $12,238,000 ($5,302 per capita)
Department of Defense expenditure: $192,000
Federal direct payments to individuals for retirement and disability: $5,282,000
Federal other direct payments to individuals: $3,065,000
Federal direct payments not to individuals: $181,000
Federal grants: $3,342,000
Federal procurement contracts: $66,000 ($0,000 Department of Defense)
Federal salaries and wages: $301,000 ($0,000 Department of Defense)
Federal Government direct loans: $15,000
Federal guaranteed/insured loans: $204,000
Federal Government insurance: $1,276,000
Population change from April 1, 2000 to July 1, 2005:
Births: 123| Here: | 54 per 1000 residents |
| State: | 69 per 1000 residents |
Deaths: 165
| Here: | 72 per 1000 residents |
| State: | 50 per 1000 residents |
Net international migration: -2
| Here: | |
| State: |
Net internal migration: +60
| Here: | +26 per 1000 residents |
| State: | +8 per 1000 residents |

Total withdrawal of fresh water for public supply: 0.00 millions of gallons per day (all from surface)
| Here: | 6.1 |
| State: | 6.4 |
| Here: | 5.5 |
| State: | 4.4 |

- Year house built in Robertson County, Kentucky
- 222020 or later
- 852010 to 2019
- 1172000 to 2009
- 1671990 to 1999
- 951980 to 1989
- 731970 to 1979
- 1461960 to 1969
- 421950 to 1959
- 301940 to 1949
- 2591939 or earlier

- Rooms in owner-occupied houses in Robertson County, Kentucky
- 01 room
- 72 rooms
- 203 rooms
- 634 rooms
- 1285 rooms
- 1426 rooms
- 1107 rooms
- 768 rooms
- 709+ rooms

- Rooms in renter-occupied apartments in Robertson County, Kentucky
- 01 room
- 02 rooms
- 193 rooms
- 374 rooms
- 465 rooms
- 726 rooms
- 157 rooms
- 78 rooms
- 99+ rooms

- Bedrooms in owner-occupied houses in Robertson County, Kentucky
- 0no bedroom
- 261 bedroom
- 1222 bedrooms
- 3503 bedrooms
- 1024 bedrooms
- 185+ bedrooms

- Bedrooms in renter-occupied apartments in Robertson County, Kentucky
- 0no bedroom
- 461 bedroom
- 422 bedrooms
- 1113 bedrooms
- 04 bedrooms
- 45+ bedrooms

- Cars and other vehicles available in Robertson County in owner-occupied houses/condos
- 0no vehicle
- 1581 vehicle
- 2782 vehicles
- 983 vehicles
- 514 vehicles
- 335+ vehicles

- Cars and other vehicles available in Robertson County in renter-occupied apartments
- 19no vehicle
- 871 vehicle
- 632 vehicles
- 273 vehicles
- 114 vehicles
- 05+ vehicles
79.2% of Robertson County residents lived in the same house 1 years ago.
Out of people who lived in different houses, 23% lived in this county.
Out of people who lived in different counties, 90% lived in Kentucky.
| Robertson County: | 79.2% |
| State average: | 87.2% |
Place of birth for U.S.-born residents:
- This state: 1,865
- Other state: 327
- Northeast: 56
- Midwest: 195
- South: 47
- West: 27


- 67.5%Electricity
- 16.1%Utility gas
- 8.8%Bottled, tank, or LP gas
- 5.1%Wood
- 1.7%Other fuel
- 0.8%Fuel oil, kerosene, etc.

- 51.5%Electricity
- 15.0%Bottled, tank, or LP gas
- 14.1%Wood
- 12.6%Utility gas
- 6.8%Fuel oil, kerosene, etc.
Private vs. public school enrollment:
| Here: | 4.1% |
| Kentucky: | 17.2% |
| Here: | 0.0% |
| Kentucky: | 15.2% |
| Here: | 9.1% |
| Kentucky: | 19.6% |


Robertson County government finances - Expenditure in 2017:
- Bond Funds - Cash and Securities: $1,068,000
- Charges - Regular Highways: $1,000
- Construction - General Public Buildings: $3,000
- Current Operations - General - Other: $407,000
Regular Highways: $344,000
Central Staff Services: $235,000
Police Protection: $161,000
Health - Other: $117,000
Judicial and Legal Services: $61,000
General Public Buildings: $39,000
Correctional Institutions: $36,000
Financial Administration: $21,000
Parks and Recreation: $12,000
Local Fire Protection: $8,000
Public Welfare - Other: $1,000
Natural Resources - Other: $1,000
- Federal Intergovernmental - Health and Hospitals: $4,000
- Intergovernmental to Local - Other - Correctional Institutions: $22,000
- Local Intergovernmental - Highways: $2,000
- Long Term Debt - Beginning Outstanding - Unspecified Public Purpose: $2,724,000
Outstanding Unspecified Public Purpose: $2,634,000
Beginning Outstanding - Public Debt for Private Purpose: $112,000
Outstanding Nonguaranteed - Industrial Revenue: $112,000
Retired Unspecified Public Purpose: $90,000
- Miscellaneous - General Revenue - Other: $95,000
Rents: $7,000
Interest Earnings: $6,000
Donations From Private Sources: $3,000
Sale of Property: $2,000
- Other Capital Outlay - Police Protection: $36,000
- Other Funds - Cash and Securities: $192,000
- Sinking Funds - Cash and Securities: $112,000
- State Intergovernmental - Highways: $652,000
Other: $476,000
- Tax - Individual Income: $134,000
Insurance Premiums Sales: $113,000
Property: $104,000
Public Utilities Sales: $39,000
Other Selective Sales: $12,000
Documentary and Stock Transfer: $10,000
Corporation License: $3,000
- Total Salaries and Wages: $540,000
Robertson County government finances - Revenue in 2017:
- Bond Funds - Cash and Securities: $1,068,000
- Charges - Regular Highways: $1,000
- Construction - General Public Buildings: $3,000
- Current Operations - General - Other: $407,000
Regular Highways: $344,000
Central Staff Services: $235,000
Police Protection: $161,000
Health - Other: $117,000
Judicial and Legal Services: $61,000
General Public Buildings: $39,000
Correctional Institutions: $36,000
Financial Administration: $21,000
Parks and Recreation: $12,000
Local Fire Protection: $8,000
Public Welfare - Other: $1,000
Natural Resources - Other: $1,000
- Federal Intergovernmental - Health and Hospitals: $4,000
- Intergovernmental to Local - Other - Correctional Institutions: $22,000
- Local Intergovernmental - Highways: $2,000
- Long Term Debt - Beginning Outstanding - Unspecified Public Purpose: $2,724,000
Outstanding Unspecified Public Purpose: $2,634,000
Beginning Outstanding - Public Debt for Private Purpose: $112,000
Outstanding Nonguaranteed - Industrial Revenue: $112,000
Retired Unspecified Public Purpose: $90,000
- Miscellaneous - General Revenue - Other: $95,000
Rents: $7,000
Interest Earnings: $6,000
Donations From Private Sources: $3,000
Sale of Property: $2,000
- Other Capital Outlay - Police Protection: $36,000
- Other Funds - Cash and Securities: $192,000
- Sinking Funds - Cash and Securities: $112,000
- State Intergovernmental - Highways: $652,000
Other: $476,000
- Tax - Individual Income: $134,000
Insurance Premiums Sales: $113,000
Property: $104,000
Public Utilities Sales: $39,000
Other Selective Sales: $12,000
Documentary and Stock Transfer: $10,000
Corporation License: $3,000
- Total Salaries and Wages: $540,000
Robertson County government finances - Debt in 2017:
- Bond Funds - Cash and Securities: $1,068,000
- Charges - Regular Highways: $1,000
- Construction - General Public Buildings: $3,000
- Current Operations - General - Other: $407,000
Regular Highways: $344,000
Central Staff Services: $235,000
Police Protection: $161,000
Health - Other: $117,000
Judicial and Legal Services: $61,000
General Public Buildings: $39,000
Correctional Institutions: $36,000
Financial Administration: $21,000
Parks and Recreation: $12,000
Local Fire Protection: $8,000
Public Welfare - Other: $1,000
Natural Resources - Other: $1,000
- Federal Intergovernmental - Health and Hospitals: $4,000
- Intergovernmental to Local - Other - Correctional Institutions: $22,000
- Local Intergovernmental - Highways: $2,000
- Long Term Debt - Beginning Outstanding - Unspecified Public Purpose: $2,724,000
Outstanding Unspecified Public Purpose: $2,634,000
Beginning Outstanding - Public Debt for Private Purpose: $112,000
Outstanding Nonguaranteed - Industrial Revenue: $112,000
Retired Unspecified Public Purpose: $90,000
- Miscellaneous - General Revenue - Other: $95,000
Rents: $7,000
Interest Earnings: $6,000
Donations From Private Sources: $3,000
Sale of Property: $2,000
- Other Capital Outlay - Police Protection: $36,000
- Other Funds - Cash and Securities: $192,000
- Sinking Funds - Cash and Securities: $112,000
- State Intergovernmental - Highways: $652,000
Other: $476,000
- Tax - Individual Income: $134,000
Insurance Premiums Sales: $113,000
Property: $104,000
Public Utilities Sales: $39,000
Other Selective Sales: $12,000
Documentary and Stock Transfer: $10,000
Corporation License: $3,000
- Total Salaries and Wages: $540,000
Robertson County government finances - Cash and Securities in 2017:
- Bond Funds - Cash and Securities: $1,068,000
- Charges - Regular Highways: $1,000
- Construction - General Public Buildings: $3,000
- Current Operations - General - Other: $407,000
Regular Highways: $344,000
Central Staff Services: $235,000
Police Protection: $161,000
Health - Other: $117,000
Judicial and Legal Services: $61,000
General Public Buildings: $39,000
Correctional Institutions: $36,000
Financial Administration: $21,000
Parks and Recreation: $12,000
Local Fire Protection: $8,000
Public Welfare - Other: $1,000
Natural Resources - Other: $1,000
- Federal Intergovernmental - Health and Hospitals: $4,000
- Intergovernmental to Local - Other - Correctional Institutions: $22,000
- Local Intergovernmental - Highways: $2,000
- Long Term Debt - Beginning Outstanding - Unspecified Public Purpose: $2,724,000
Outstanding Unspecified Public Purpose: $2,634,000
Beginning Outstanding - Public Debt for Private Purpose: $112,000
Outstanding Nonguaranteed - Industrial Revenue: $112,000
Retired Unspecified Public Purpose: $90,000
- Miscellaneous - General Revenue - Other: $95,000
Rents: $7,000
Interest Earnings: $6,000
Donations From Private Sources: $3,000
Sale of Property: $2,000
- Other Capital Outlay - Police Protection: $36,000
- Other Funds - Cash and Securities: $192,000
- Sinking Funds - Cash and Securities: $112,000
- State Intergovernmental - Highways: $652,000
Other: $476,000
- Tax - Individual Income: $134,000
Insurance Premiums Sales: $113,000
Property: $104,000
Public Utilities Sales: $39,000
Other Selective Sales: $12,000
Documentary and Stock Transfer: $10,000
Corporation License: $3,000
- Total Salaries and Wages: $540,000
Supplemental Security Income (SSI) in 2006:
- Total number of recipients: 119
- Number of aged recipients: 12
- Number of blind and disabled recipients: 107
- Number of recipients under 18: 21
- Number of recipients between 18 and 64: 74
- Number of recipients older than 64: 24
- Number of recipients also receiving OASDI: 46
- Amount of payments (thousands of dollars): 46
| Most common first names in Robertson County, KY among deceased individuals | ||
| Name | Count | Lived (average) |
|---|---|---|
| William | 30 | 74.7 years |
| James | 26 | 75.0 years |
| Mary | 21 | 83.4 years |
| John | 17 | 74.0 years |
| Robert | 12 | 72.0 years |
| Ruth | 11 | 74.6 years |
| Ruby | 10 | 74.8 years |
| Charles | 9 | 79.4 years |
| Anna | 9 | 85.1 years |
| George | 8 | 79.0 years |
| Most common last names in Robertson County, KY among deceased individuals | ||
| Last name | Count | Lived (average) |
|---|---|---|
| Linville | 43 | 76.0 years |
| Burns | 19 | 81.3 years |
| Curtis | 19 | 69.1 years |
| Moore | 16 | 72.1 years |
| Henson | 15 | 79.9 years |
| Mullikin | 14 | 75.4 years |
| Mastin | 14 | 74.8 years |
| Duncan | 11 | 83.5 years |
| Wells | 11 | 78.6 years |
| Sims | 10 | 79.4 years |
Robertson County on our top lists:
- #58 on the list of "Top 101 counties with the highest number of deaths per 1000 residents 2007-2013"