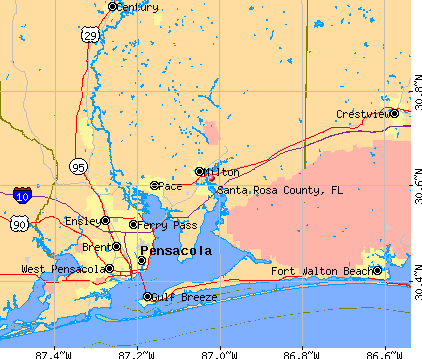
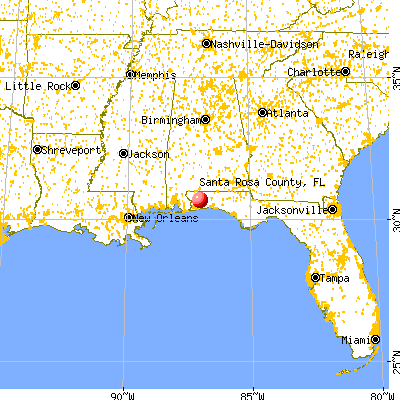
Santa Rosa County, Florida (FL)
County owner-occupied free and clear houses and condos in 2010: 12,504
County owner-occupied houses and condos in 2000: 35,198
Renter-occupied apartments: 13,457 (it was 8,595 in 2000)
| % of renters here: | 20% |
| State: | 33% |
Land area: 1017 sq. mi.
Water area: 156.6 sq. mi.
Population density: 195 people per square mile (high).
Industries providing employment: Educational, health and social services (20.7%), Professional, scientific, management, administrative, and waste management services (12.6%), Retail trade (11.2%), Arts, entertainment, recreation, accommodation and food services (10.7%).
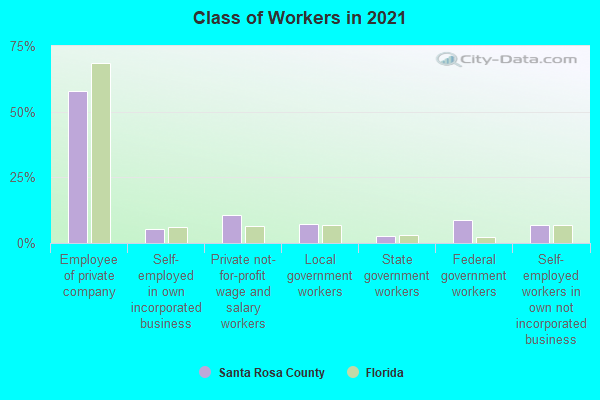
Type of workers:
- Private wage or salary: 73%
- Government: 22%
- Self-employed, not incorporated: 5%
- Unpaid family work: 0%
- OSM Map
- General Map
- Google Map
- MSN Map

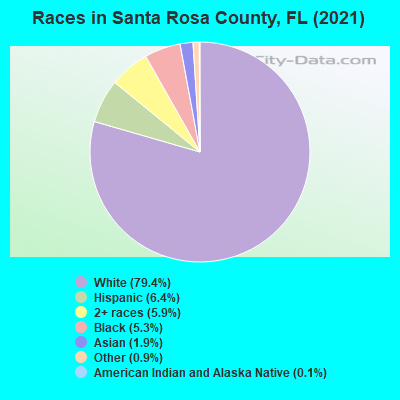
- 153,17777.3%White Non-Hispanic Alone
- 13,5626.8%Two or more races
- 13,0446.6%Hispanic or Latino
- 11,8706.0%Black Non-Hispanic Alone
- 4,1742.1%Asian alone
- 2,1861.1%Some other race alone
- 2550.1%American Indian and Alaska Native alone
| Median resident age: | 39.7 years |
| Florida median age: | 42.7 years |
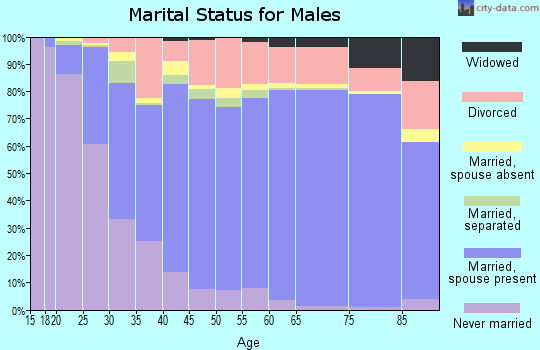
| Males: 102,329 | |
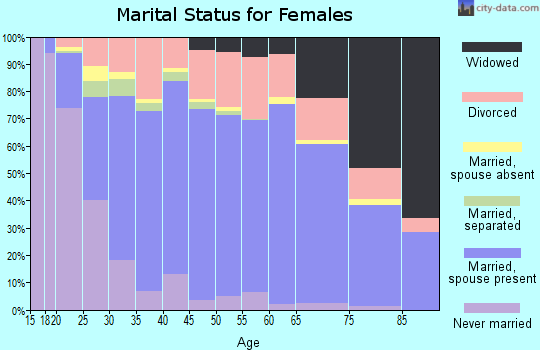
| Females: 95,939 |

 | Pensacola/Pace housing (0 replies) |
| Moving from NYC to Santa Rosa County in June (single/male/23) (3 replies) |
| Mixed race family moving south (27 replies) |
| Local Newspapers about Escambia, Santa Rosa or Okaloosa Counties (5 replies) |
| Neighborhoods in Pensacola (14 replies) |
| Navarre (3 replies) |
| Santa Rosa County: | 2.0 people |
| Florida: | 2 people |
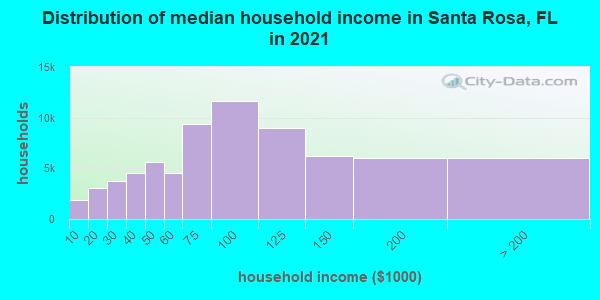
Estimated median household income in 2022: $83,672 ($41,881 in 1999)
| This county: | $83,672 |
| Florida: | $69,303 |
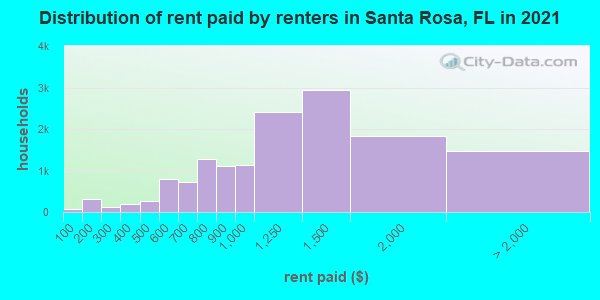
Median contract rent in 2022 for apartments: $1,201 (lower quartile is $734, upper quartile is $1,650)
| This county: | $1201 |
| State: | $1367 |
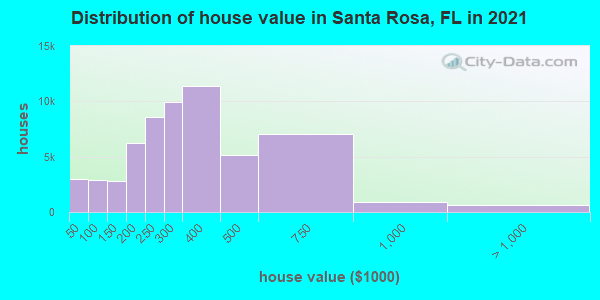
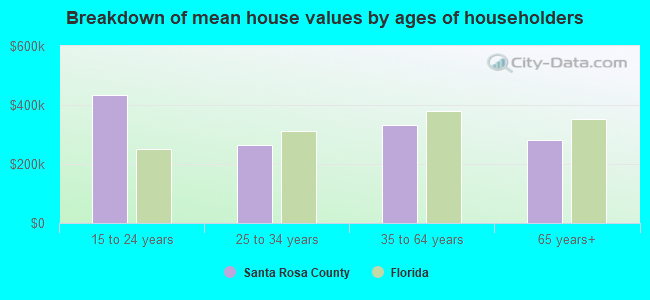
Estimated median house or condo value in 2022: $327,800 (it was $96,300 in 2000)
| Santa Rosa: | $327,800 |
| Florida: | $354,100 |
Mean price in 2022:
Median monthly housing costs for homes and condos with a mortgage: $1,761Detached houses: $335,185
Here: $335,185 State: $500,941 Townhouses or other attached units: $269,306
Here: $269,306 State: $370,869 In 2-unit structures: $431,941
Here: $431,941 State: $423,188 In 3-to-4-unit structures: $168,172
Here: $168,172 State: $309,944 In 5-or-more-unit structures: $512,257
Here: $512,257 State: $447,145 Mobile homes: $93,201
Here: $93,201 State: $113,202 Occupied boats, RVs, vans, etc.: $59,574
Here: $59,574 State: $73,933
Median monthly housing costs for units without a mortgage: $501
Institutionalized population: 3,944
Crime in 2020 (reported by the sheriff's office or county police, not the county total):
- Murders: 5
- Rapes: 43
- Robberies: 15
- Assaults: 158
- Burglaries: 267
- Thefts: 904
- Auto thefts: 105
Crime in 2019 (reported by the sheriff's office or county police, not the county total):
- Murders: 4
- Rapes: 54
- Robberies: 14
- Assaults: 137
- Burglaries: 276
- Thefts: 973
- Auto thefts: 111
Health of residents in Santa Rosa County based on CDC Behavioral Risk Factor Surveillance System Survey Questionnaires from 2013 to 2021:
General health status score of residents in this county from 1 (poor) to 5 (excellent) is 3.4. This is about average.67.2% of residents exercised in the past month. This is less than average.
49.4% of residents smoked 100+ cigarettes in their lives. This is about average.
48.7% of adult residents drank alcohol in the past 30 days. This is less than average.
63.8% of residents visited a dentist within the past year. This is less than average.
Average weight of males is 199 pounds. This is about average.
Average weight of females is 162 pounds. This is about average.
Health of residents in Santa Rosa County based on CDC Behavioral Risk Factor Surveillance System Survey Questionnaires from 2003 to 2012:
General health status score of residents in this county from 1 (poor) to 5 (excellent) is 3.4. This is about average.73.6% of residents exercised in the past month. This is about average.
49.7% of residents smoked 100+ cigarettes in their lives. This is about average.
100.0% of adult residents drank alcohol in the past 30 days. This is more than average.
65.9% of residents visited a dentist within the past year. This is less than average.
Average weight of males is 201 pounds. This is more than average.
Average weight of females is 162 pounds. This is about average.
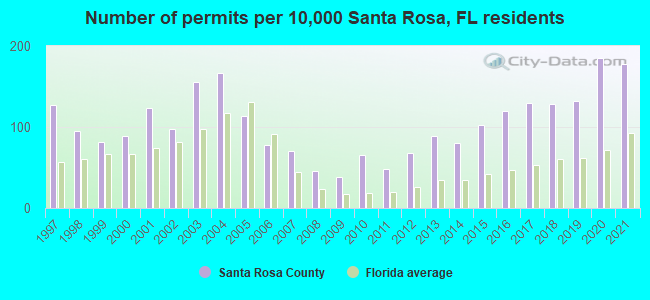
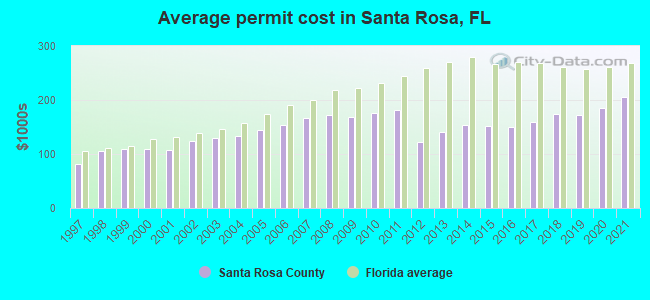
Single-family new house construction building permits:
- 2022: 1530 buildings, average cost: $251,200
- 2021: 2091 buildings, average cost: $204,900
- 2020: 2181 buildings, average cost: $185,600
- 2019: 1551 buildings, average cost: $172,400
- 2018: 1513 buildings, average cost: $173,500
- 2017: 1536 buildings, average cost: $159,500
- 2016: 1417 buildings, average cost: $150,100
- 2015: 1210 buildings, average cost: $151,800
- 2014: 943 buildings, average cost: $152,700
- 2013: 1045 buildings, average cost: $141,300
- 2012: 805 buildings, average cost: $121,500
- 2011: 567 buildings, average cost: $181,500
- 2010: 781 buildings, average cost: $176,300
- 2009: 448 buildings, average cost: $168,200
- 2008: 536 buildings, average cost: $173,400
- 2007: 830 buildings, average cost: $165,500
- 2006: 923 buildings, average cost: $154,000
- 2005: 1332 buildings, average cost: $144,300
- 2004: 1969 buildings, average cost: $132,900
- 2003: 1823 buildings, average cost: $129,500
- 2002: 1138 buildings, average cost: $124,900
- 2001: 1461 buildings, average cost: $106,700
- 2000: 1050 buildings, average cost: $108,600
- 1999: 965 buildings, average cost: $109,700
- 1998: 1116 buildings, average cost: $104,600
- 1997: 1491 buildings, average cost: $81,200
Median real estate property taxes paid for housing units with mortgages in 2022: $2,239 (0.6%)
Median real estate property taxes paid for housing units with no mortgage in 2022: $1,424 (0.5%)
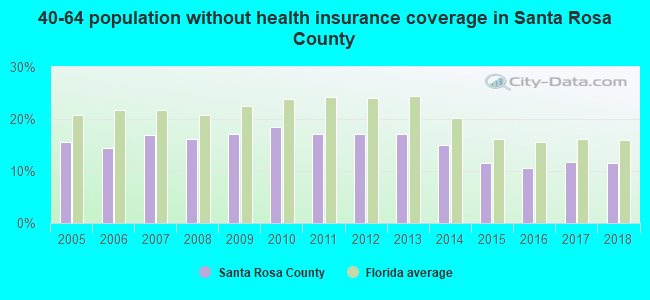
| Santa Rosa County: | 9.2% |
| Florida: | 12.7% |
Median age of residents in 2022: 39.7 years old
(Males: 37.7 years old, Females: 42.0 years old)
(Median age for: White residents: 42.3 years old, Black residents: 31.2 years old, American Indian residents: 57.9 years old, Asian residents: 40.0 years old, Hispanic or Latino residents: 32.6 years old, Other race residents: 34.5 years old)
Area name: Pensacola-Ferry Pass-Brent, FL MSA
Fair market rent in 2006 for a 1-bedroom apartment in Santa Rosa County is $522 a month.
Fair market rent for a 2-bedroom apartment is $579 a month.
Fair market rent for a 3-bedroom apartment is $839 a month.
Cities in this county include: Gulf Breeze-Harold, Navarre, East Milton, Pace, Milton, Gulf Breeze, Munson-McLellen, Pea Ridge, Tiger Point, Point Baker.
| Zip Code | City | Certified Residential Database | Mandatory Residential Database | Mandatory Non-Residential Database | |||
|---|---|---|---|---|---|---|---|
| Buildings Measured | Above 4 pCi/L (%) | Buildings Measured | Above 4 pCi/L (%) | Buildings Measured | Above 4 pCi/L (%) | ||
| 32530 | Bagdad | 2 | 0 | - | - | - | - |
| 32561 | Gulf Breeze | 18 | 0 | 1 | 0 | 1 | 0 |
| 32563 | Gulf Breeze | 38 | 0 | - | - | - | - |
| 32565 | Jay | 2 | 0 | 1 | 0 | 1 | 0 |
| 32566 | Navarre | 10 | 0 | 2 | 0 | 2 | 0 |
| 32570 | Milton | 5 | 0 | 9 | 0 | 9 | 0 |
| 32571 | Milton | 49 | 0 | 2 | 0 | 2 | 0 |
| 32583 | Milton | 3 | 0 | - | - | - | - |
2023 air pollution in Santa Rosa County:
Ozone (1-hour): 0.036 ppm (standard limit: 0.12 ppm). Near U.S. average.
Particulate Matter (PM2.5) Annual: 9.1 µg/m3(standard limit: 15.0 µg/m3). Near U.S. average.
Neighboring counties: Brewster County, Texas  , St. Helena Parish, Louisiana , Irwin County, Georgia
  , Lowndes County, Georgia
  , Trinity County, Texas .
| Here: | 2.9% |
| Florida: | 2.9% |
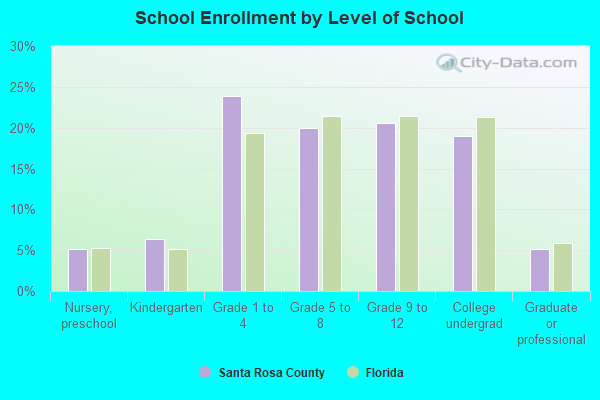
Current college students: 5,600
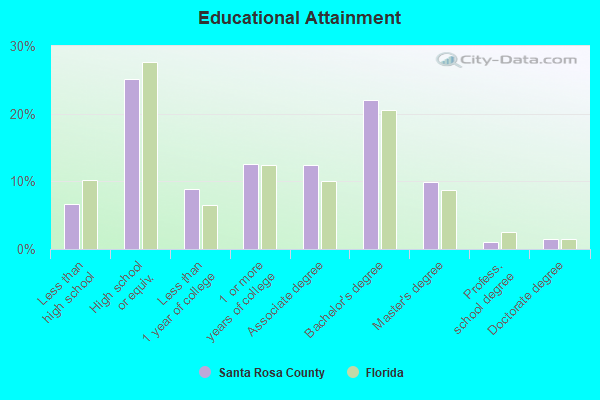
People 25 years of age or older with a high school degree or higher: 93.8%
People 25 years of age or older with a bachelor's degree or higher: 30.3%
Number of foreign born residents: 8,505 (61.5% naturalized citizens)
| Santa Rosa County: | 4.3% |
| Whole state: | 21.7% |
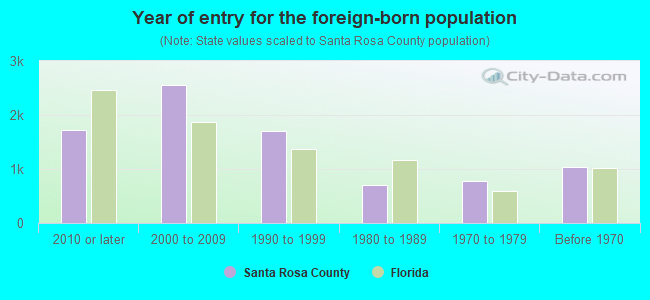
- Year of entry for the foreign-born population
- 2,6062010 or later
- 2,2072000 to 2009
- 1,6781990 to 1999
- 7021980 to 1989
- 7691970 to 1979
- 1,045Before 1970
Mean travel time to work (commute): minutes
Percentage of county residents living and working in this county: 96.8%
Housing units in structures:
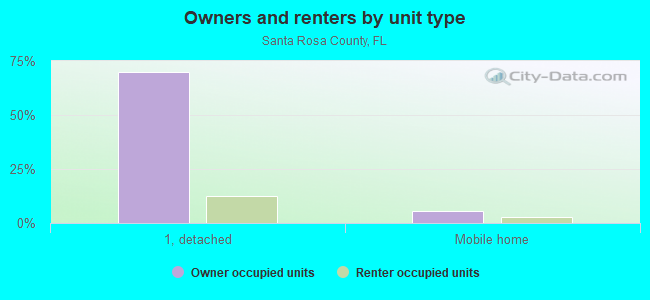
- One, detached: 63,361
- One, attached: 1,470
- Two: 522
- 3 or 4: 1,036
- 5 to 9: 2,325
- 10 to 19: 637
- 20 to 49: 1,283
- 50 or more: 2,419
- Mobile homes: 7,271
- Boats, RVs, vans, etc.: 43
Housing units in Santa Rosa County with a mortgage: 37,090 (1,884 second mortgage, 0 home equity loan, 1,537 both second mortgage and home equity loan)
Houses without a mortgage: 537
| Here: | 6.4% with mortgage |
| State: | 97.6% with mortgage |
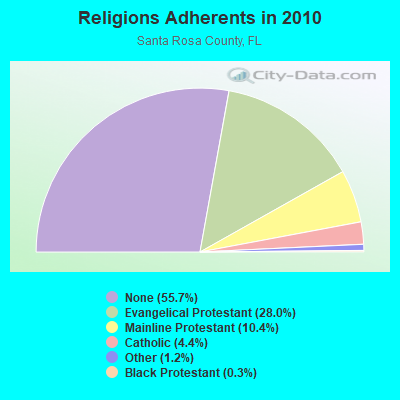
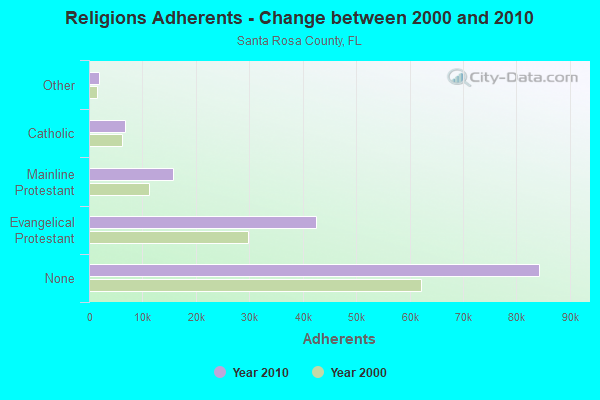
Religion statistics for Santa Rosa County
| Religion | Adherents | Congregations |
|---|---|---|
| Evangelical Protestant | 42,426 | 116 |
| Mainline Protestant | 15,731 | 23 |
| Catholic | 6,667 | 3 |
| Other | 1,807 | 11 |
| Black Protestant | 427 | 3 |
| None | 84,314 | - |
Source: Clifford Grammich, Kirk Hadaway, Richard Houseal, Dale E.Jones, Alexei Krindatch, Richie Stanley and Richard H.Taylor. 2012. 2010 U.S.Religion Census: Religious Congregations & Membership Study. Association of Statisticians of American Religious Bodies. Jones, Dale E., et al. 2002. Congregations and Membership in the United States 2000. Nashville, TN: Glenmary Research Center.
Food Environment Statistics:
| Santa Rosa County: | 1.08 / 10,000 pop. |
| State: | 2.04 / 10,000 pop. |
| Here: | 0.14 / 10,000 pop. |
| Florida: | 0.11 / 10,000 pop. |
| This county: | 0.47 / 10,000 pop. |
| Florida: | 1.28 / 10,000 pop. |
| Santa Rosa County: | 4.20 / 10,000 pop. |
| Florida: | 3.04 / 10,000 pop. |
| This county: | 4.33 / 10,000 pop. |
| State: | 7.45 / 10,000 pop. |
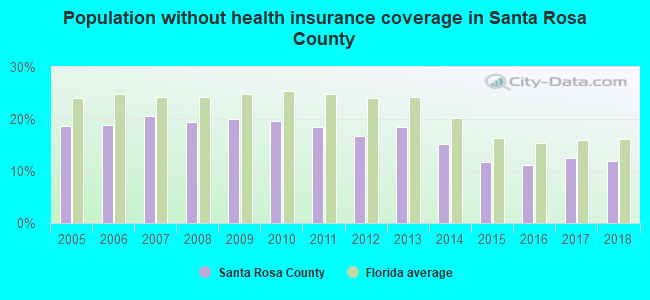
| Santa Rosa County: | 8.5% |
| Florida: | 9.2% |
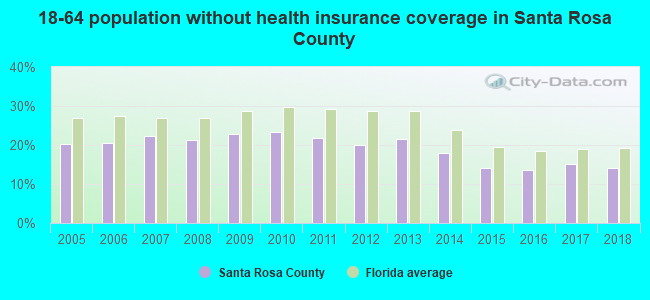
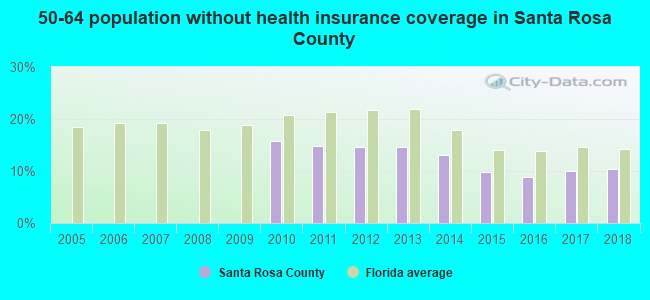
| Santa Rosa County: | 21.9% |
| State: | 23.7% |
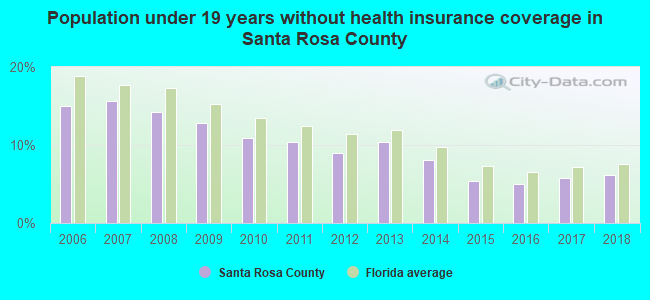
| Here: | 11.5% |
| State: | 14.0% |
Agriculture in Santa Rosa County:
Average size of farms: 166 acresAverage value of agricultural products sold per farm: $41,579
Average value of crops sold per acre for harvested cropland: $425.00
The value of nursery, greenhouse, floriculture, and sod as a percentage of the total market value of agricultural products sold: 23.06%
The value of livestock, poultry, and their products as a percentage of the total market value of agricultural products sold: 8.80%
Average total farm production expenses per farm: $42,776
Harvested cropland as a percentage of land in farms: 53.77%
Irrigated harvested cropland as a percentage of land in farms: 13.41%
Average market value of all machinery and equipment per farm: $53,635
The percentage of farms operated by a family or individual: 94.06%
Average age of principal farm operators: 56 years
Average number of cattle and calves per 100 acres of all land in farms: 7.52
Milk cows as a percentage of all cattle and calves: 0.30%
Corn for grain: 346 harvested acres
Upland cotton: 29366 harvested acres
Vegetables: 205 harvested acres
Land in orchards: 207 acres
Earthquake activity:
Santa Rosa County-area historical earthquake activity is significantly above Florida state average. It is 63% smaller than the overall U.S. average.On 10/24/1997 at 08:35:17, a magnitude 4.9 (4.8 MB, 4.2 MS, 4.9 LG, Depth: 6.2 mi, Class: Light, Intensity: IV - V) earthquake occurred 38.2 miles away from Santa Rosa County center
On 9/10/2006 at 14:56:08, a magnitude 5.9 (5.9 MB, 5.5 MS, 5.8 MW, Class: Moderate, Intensity: VI - VII) earthquake occurred 302.8 miles away from the county center
On 1/18/1999 at 07:00:53, a magnitude 4.8 (4.8 MB, 4.0 LG, Depth: 0.6 mi) earthquake occurred 193.5 miles away from the county center
On 9/3/2020 at 15:07:53, a magnitude 3.8 (3.8 MW, Depth: 2.5 mi, Class: Light, Intensity: II - III) earthquake occurred 29.9 miles away from the county center
On 11/7/2004 at 11:20:21, a magnitude 4.3 (4.3 MW, Depth: 3.1 mi) earthquake occurred 150.6 miles away from Santa Rosa County center
On 5/6/2018 at 16:47:09, a magnitude 4.6 (4.6 MB, Depth: 6.2 mi) earthquake occurred 214.4 miles away from the county center
Magnitude types: regional Lg-wave magnitude (LG), body-wave magnitude (MB), surface-wave magnitude (MS), moment magnitude (MW)
Most recent natural disasters:
- Florida Hurricane Sally, Incident Period: September 14, 2020 - September 28, 2020, FEMA Id: 4564, Natural disaster type: Hurricane
- Florida Covid-19 Pandemic, Incident Period: January 20, 2020, FEMA Id: 4486, Natural disaster type: Other
- Florida Hurricane Irma, Incident Period: September 4, 2017 - October 18, 2017, FEMA Id: 4337, Natural disaster type: Hurricane
- Florida Severe Storms, Tornadoes, Straight-line Winds, and Flooding, Incident Period: April 28, 2014 to May 06, 2014, Major Disaster (Presidential) Declared DR-4177: May 06, 2014, FEMA Id: 4177, Natural disaster type: Storm, Tornado, Flood, Wind
- Florida Hurricane Isaac, Incident Period: August 27, 2012 to August 29, 2012, Major Disaster (Presidential) Declared DR-4084: October 18, 2012, FEMA Id: 4084, Natural disaster type: Hurricane
- Florida Tropical Storm Debby, Incident Period: June 23, 2012 to July 26, 2012, Major Disaster (Presidential) Declared DR-4068: July 03, 2012, FEMA Id: 4068, Natural disaster type: Tropical Storm
- Florida Severe Storms, Flooding, Tornadoes, and Straight-line Winds, Incident Period: March 26, 2009 to May 05, 2009, Major Disaster (Presidential) Declared DR-1831: April 21, 2009, FEMA Id: 1831, Natural disaster type: Storm, Tornado, Flood, Wind
- Florida Hurricane Gustav, Incident Period: August 31, 2008 to September 07, 2008, Major Disaster (Presidential) Declared DR-1806: October 27, 2008, FEMA Id: 1806, Natural disaster type: Hurricane
- Florida Tropical Storm Fay, Incident Period: August 18, 2008 to September 12, 2008, Emergency Declared EM-3288: August 21, 2008, FEMA Id: 3288, Natural disaster type: Tropical Storm
- Florida Hurricane Katrina Evacuation, Incident Period: August 29, 2005 to October 01, 2005, Emergency Declared EM-3220: September 05, 2005, FEMA Id: 3220, Natural disaster type: Hurricane
- 17 other natural disasters have been reported since 1953.
The number of natural disasters in Santa Rosa County (27) is a lot greater than the US average (15).
Major Disasters (Presidential) Declared: 19
Emergencies Declared: 5
Causes of natural disasters: Hurricanes: 14, Floods: 7, Storms: 5, Tropical Storms: 5, Tornadoes: 3, Winds: 2, Fire: 1, Heavy Rain: 1, Other: 1 (Note: some incidents may be assigned to more than one category).
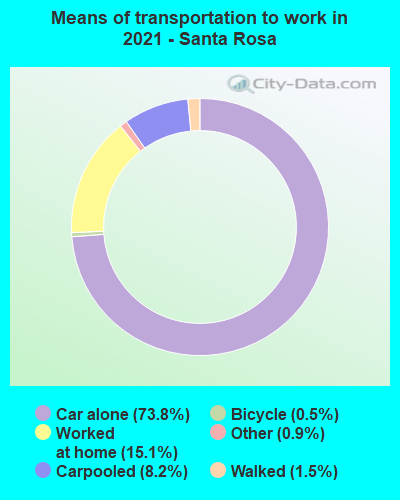
Means of transportation to work:
- Drove a car alone: 36,872 (67.6%)
- Carpooled: 4,010 (7.4%)
- Bus: 19 (0.0%)
- Taxicab, motorcycle, or other means: 700 (1.3%)
- Bicycle: 198 (0.4%)
- Walked: 894 (1.6%)
- Worked at home: 13,076 (24.0%)

- Health care and social assistance (16%)
- Retail trade (13%)
- Accommodation and food services (10%)
- Finance and insurance (9%)
- Educational services (8%)
- Public administration (6%)
- Professional, scientific, and technical services (5%)
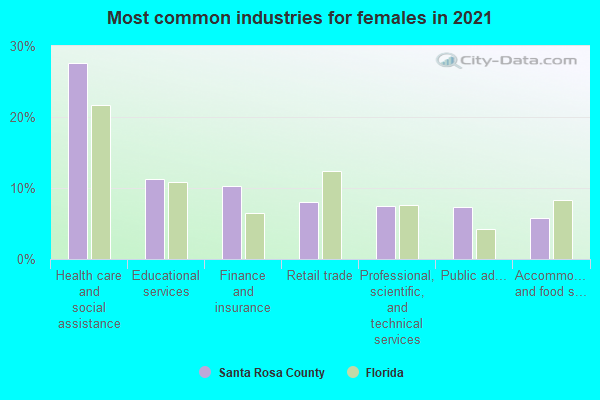
- Health care and social assistance (18%)
- Retail trade (15%)
- Accommodation and food services (11%)
- Finance and insurance (11%)
- Educational services (10%)
- Public administration (7%)
- Professional, scientific, and technical services (6%)
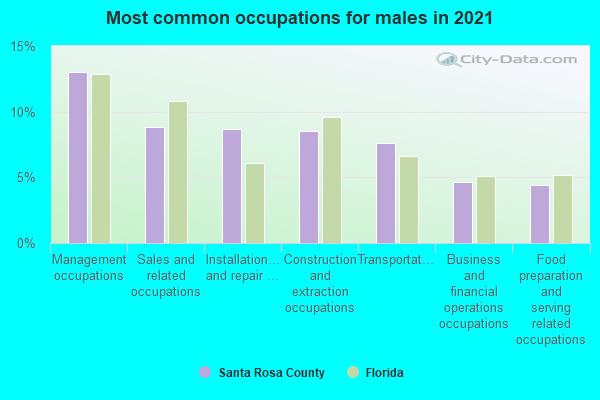
- Sales and related occupations (12%)
- Construction and extraction occupations (12%)
- Management occupations (11%)
- Transportation occupations (10%)
- Food preparation and serving related occupations (7%)
- Installation, maintenance, and repair occupations (7%)
- Business and financial operations occupations (7%)
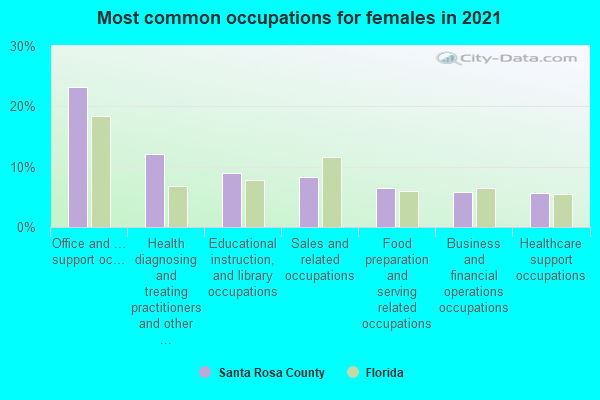
- Office and administrative support occupations (19%)
- Sales and related occupations (13%)
- Management occupations (12%)
- Food preparation and serving related occupations (8%)
- Educational instruction, and library occupations (7%)
- Business and financial operations occupations (6%)
- Health technologists and technicians (5%)
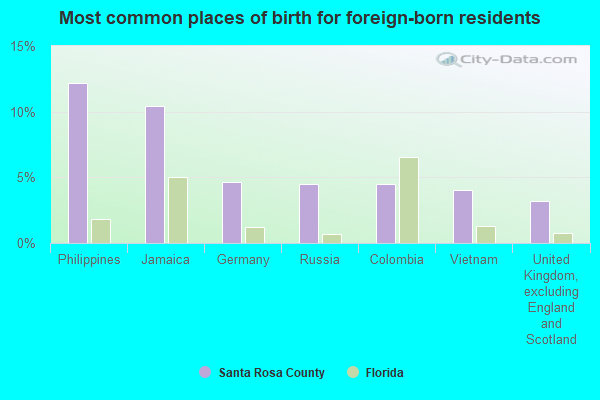
- Philippines (14%)
- Jamaica (12%)
- Colombia (5%)
- Germany (4%)
- Guyana (4%)
- Russia (4%)
- United Kingdom, excluding England and Scotland (4%)
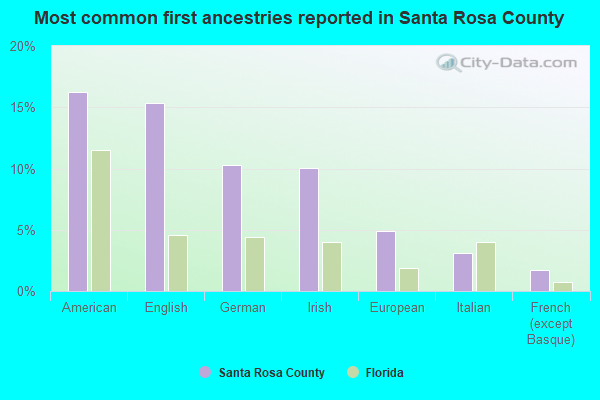
- English (15%)
- American (14%)
- German (11%)
- Irish (10%)
- European (5%)
- Italian (3%)
- Scottish (2%)
People in group quarters in Santa Rosa County, Florida in 2010:
- 2,923 people in state prisons
- 428 people in local jails and other municipal confinement facilities
- 374 people in nursing facilities/skilled-nursing facilities
- 134 people in correctional facilities intended for juveniles
- 103 people in other noninstitutional facilities
- 81 people in workers' group living quarters and job corps centers
- 79 people in mental (psychiatric) hospitals and psychiatric units in other hospitals
- 51 people in residential treatment centers for adults
- 37 people in group homes intended for adults
- 28 people in military barracks and dormitories (nondisciplinary)
- 6 people in group homes for juveniles (non-correctional)
People in group quarters in Santa Rosa County, Florida in 2000:
- 1,298 people in state prisons
- 363 people in nursing homes
- 341 people in local jails and other confinement facilities (including police lockups)
- 112 people in military barracks, etc.
- 102 people in other group homes
- 76 people in mental (psychiatric) hospitals or wards
- 68 people in residential treatment centers for emotionally disturbed children
- 53 people in other noninstitutional group quarters
- 43 people in other nonhousehold living situations
- 35 people in homes for the mentally retarded
- 23 people in homes or halfway houses for drug/alcohol abuse
- 20 people in hospitals/wards and hospices for chronically ill
- 20 people in other hospitals or wards for chronically ill
- 13 people in military transient quarters for temporary residents
- 5 people in homes for the physically handicapped
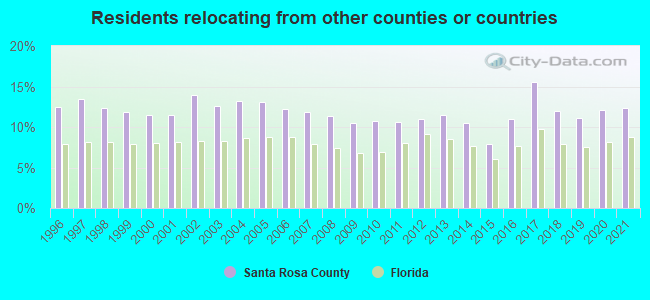
12.35% of this county's 2021 resident taxpayers lived in other counties in 2020 ($73,048 average adjusted gross income)
| Here: | 12.35% |
| Florida average: | 8.80% |
0.23% of residents moved from foreign countries ($1,307 average AGI)
Santa Rosa County: 0.23% Florida average: 0.05%
5.69% relocated from other counties in Florida ($26,718 average AGI)
6.43% relocated from other states ($45,023 average AGI)
Santa Rosa County: 6.43% Florida average: 4.38%
Top counties from which taxpayers relocated into this county between 2020 and 2021:
| from Escambia County, FL | |
| from Okaloosa County, FL | |
| from Leon County, FL | |
| from Duval County, FL | |
| from Baldwin County, AL | |
| from Orange County, FL | |
| from San Diego County, CA |
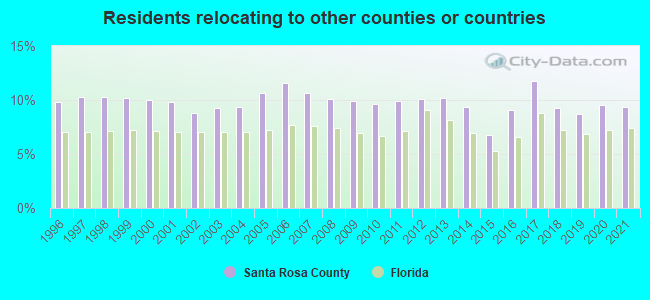
9.37% of this county's 2020 resident taxpayers moved to other counties in 2021 ($60,972 average adjusted gross income)
| Here: | 9.37% |
| Florida average: | 7.45% |
0.18% of residents moved to foreign countries ($1,353 average AGI)
Santa Rosa County: 0.18% Florida average: 0.04%
4.49% relocated to other counties in Florida ($27,648 average AGI)
4.70% relocated to other states ($31,971 average AGI)
Santa Rosa County: 4.70% Florida average: 2.97%
Top counties to which taxpayers relocated from this county between 2020 and 2021:
| to Escambia County, FL | |
| to Okaloosa County, FL | |
| to Leon County, FL | |
| to San Diego County, CA | |
| to Baldwin County, AL | |
| to Duval County, FL | |
| to Walton County, FL |
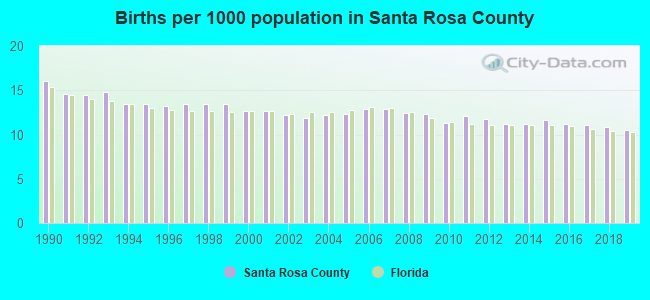
Births per 1000 population from 1990 to 1999: 14.0
Births per 1000 population from 2000 to 2009: 12.4
Births per 1000 population from 2010 to 2022: 9.4
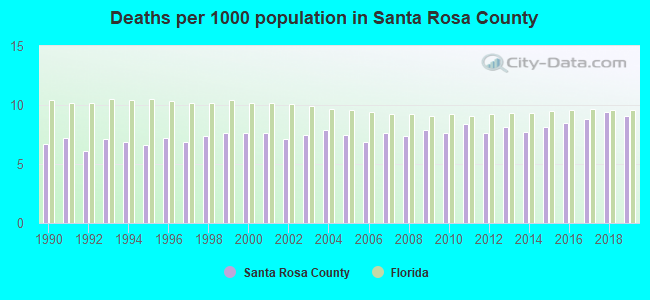
Deaths per 1000 population from 1990 to 1999: 7.0
Deaths per 1000 population from 2000 to 2009: 7.5
Deaths per 1000 population from 2010 to 2020: 8.5
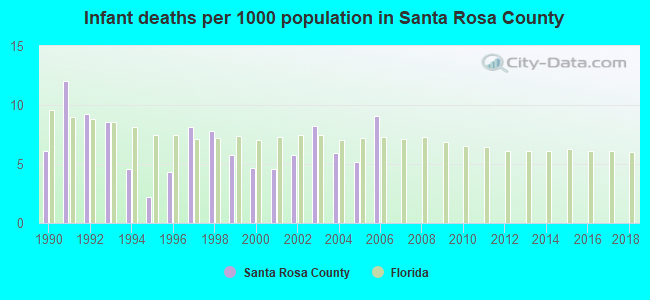
Infant deaths per 1000 live births from 1990 to 1999: 6.9
Infant deaths per 1000 live births from 2000 to 2006: 6.2
Persons under 19 years old without health insurance coverage in 2018: 6.1%
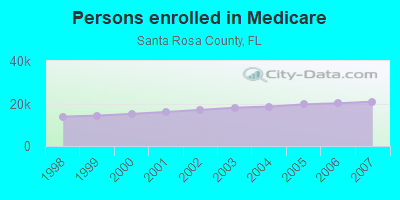
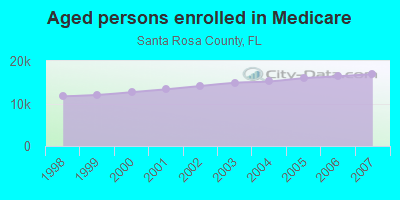
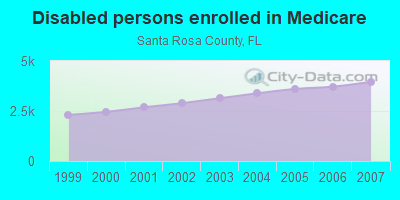
Persons enrolled in hospital insurance and/or supplemental medical insurance (Medicare) in July 1, 2007: 20,877 (16,918 aged, 3,959 disabled)
Children under 18 without health insurance coverage in 2007: 5,425 (15%)
Most common underlying causes of death in Santa Rosa County, Florida in 1999 - 2019:
- Bronchus or lung, unspecified - Malignant neoplasms (1,866)
- Chronic obstructive pulmonary disease, unspecified (1,455)
- Atherosclerotic heart disease (1,437)
- Acute myocardial infarction, unspecified (1,205)
- Alzheimer disease, unspecified (814)
- Unspecified dementia (721)
- Stroke, not specified as haemorrhage or infarction (548)
- Atherosclerotic cardiovascular disease, so described (469)
- Breast, unspecified - Malignant neoplasms (397)
- Congestive heart failure (397)
Population without health insurance coverage in 2000: 13%
Children under 18 without health insurance coverage in 2000: 10%
Short term general hospital admissions per 100,000 population in 2004: 5,959
Short term general hospital beds per 100,000 population in 2004: 139
Emergency room visits per 100,000 population in 2004: 38,738
General practice office based MDs per 100,000 population in 2005: 1,236
Medical specialist MDs per 100,000 population in 2005: 780
Dentists per 100,000 population in 1998: 1
Total births per 100,000 population, July 2005 - July 2006 : 20
Total deaths per 100,000 population, July 2005 - July 2006: 59
Limited-service eating places per 100,000 population in 2005 : 9
Homicides per 1,000,000 population from 2000 to 2006: 29.2. This is less than state average.
Suicides per 1,000,000 population from 2000 to 2006: 149.2. This is more than state average.
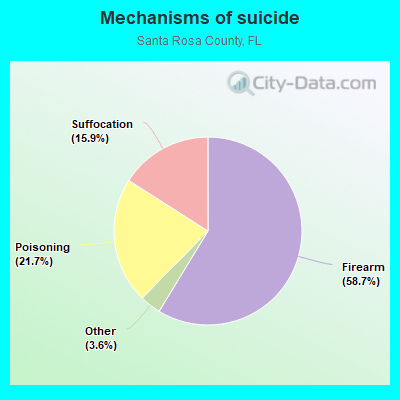
- Firearm - 87.6
- Poisoning - 32.4
- Suffocation - 23.8
- Other - 5.4
Household type by relationship:
Households: 198,268- Male householders: 39,890 (7,245 living alone), Female householders: 33,655 (9,753 living alone)
41,130 spouses (40,986 opposite-sex spouses), 4,628 unmarried partners, (4,380 opposite-sex unmarried partners), 58,019 children (49,873 natural, 1,177 adopted, 6,969 stepchildren), 2,928 grandchildren, 1,811 brothers or sisters, 2,911 parents, 51 foster children, 3,295 other relatives, 5,620 non-relatives
- In group quarters: 4,330
Size of family households: 21,215 2-persons, 11,496 3-persons, 10,146 4-persons, 4,894 5-persons, 3,212 6-persons, 1,093 7-or-more-persons.
Size of nonfamily households: 16,998 1-person, 3,762 2-persons, 588 3-persons, 46 4-persons, 95 5-persons.
31,435 married couples with children.
8,735 single-parent households (1,807 men, 6,928 women).
93.1% of residents of Santa Rosa speak English at home.
2.8% of residents speak Spanish at home (70% speak English very well, 16% speak English well, 13% speak English not well, 1% don't speak English at all).
1.6% of residents speak other Indo-European language at home (80% speak English very well, 10% speak English well, 7% speak English not well, 3% don't speak English at all).
1.3% of residents speak Asian or Pacific Island language at home (50% speak English very well, 36% speak English well, 10% speak English not well, 4% don't speak English at all).
0.6% of residents speak other language at home (100% speak English very well).
In fiscal year 2004:
Federal Government expenditure: $866,023,000 ($6,263 per capita)
Department of Defense expenditure: $312,838,000
Federal direct payments to individuals for retirement and disability: $486,157,000
Federal other direct payments to individuals: $100,032,000
Federal direct payments not to individuals: $7,379,000
Federal grants: $79,165,000
Federal procurement contracts: $95,536,000 ($90,931,000 Department of Defense)
Federal salaries and wages: $97,753,000 ($75,298,000 Department of Defense)
Federal Government direct loans: $3,934,000
Federal guaranteed/insured loans: $180,352,000
Federal Government insurance: $1,236,901,000
Population change from April 1, 2000 to July 1, 2005:
Births: 8,117| Here: | 57 per 1000 residents |
| State: | 63 per 1000 residents |
Deaths: 4,961
| Here: | 35 per 1000 residents |
| State: | 49 per 1000 residents |
Net international migration: +445
| Here: | +3 per 1000 residents |
| State: | +30 per 1000 residents |
Net internal migration: +22,026
| Here: | +154 per 1000 residents |
| State: | +59 per 1000 residents |
Total withdrawal of fresh water for public supply: 13.47 millions of gallons per day (all from ground)
| Here: | 6.4 |
| State: | 5.9 |
| Here: | 4.9 |
| State: | 4.2 |
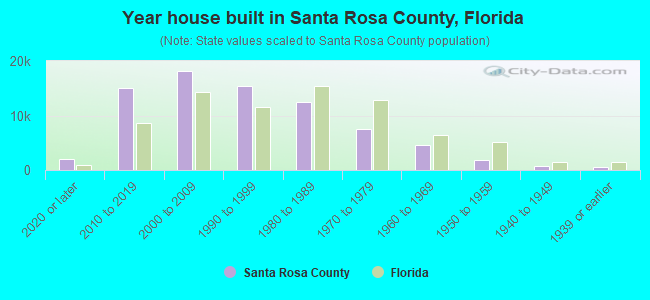
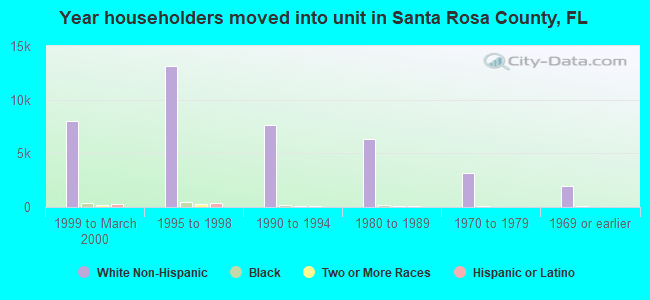
- Year house built in Santa Rosa County, Florida
- 4,7052020 or later
- 15,5492010 to 2019
- 17,3592000 to 2009
- 15,3341990 to 1999
- 10,9331980 to 1989
- 8,1911970 to 1979
- 4,9091960 to 1969
- 2,4821950 to 1959
- 3171940 to 1949
- 5881939 or earlier
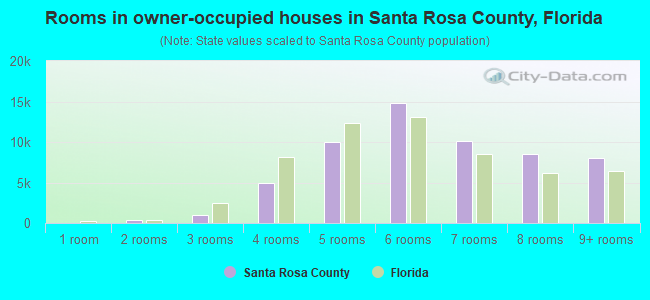
- Rooms in owner-occupied houses in Santa Rosa County, Florida
- 41 room
- 1602 rooms
- 1,1943 rooms
- 4,6154 rooms
- 11,3155 rooms
- 13,9766 rooms
- 11,6587 rooms
- 8,3128 rooms
- 7,2579+ rooms
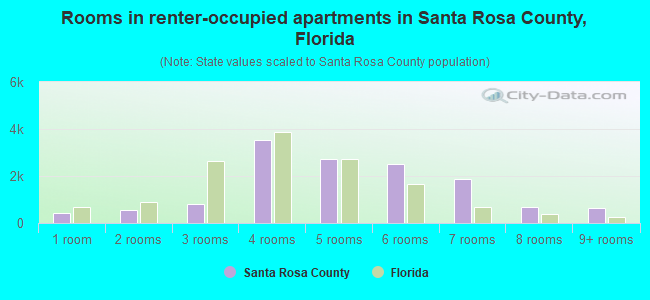
- Rooms in renter-occupied apartments in Santa Rosa County, Florida
- 1,2611 room
- 7432 rooms
- 1,1633 rooms
- 2,9534 rooms
- 3,1315 rooms
- 2,8666 rooms
- 9627 rooms
- 1,1628 rooms
- 8139+ rooms
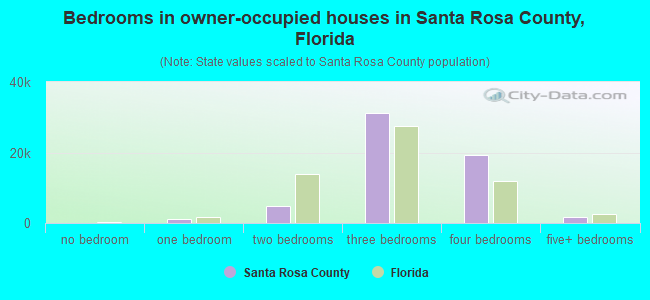
- Bedrooms in owner-occupied houses in Santa Rosa County, Florida
- 166no bedroom
- 3391 bedroom
- 4,7882 bedrooms
- 29,7573 bedrooms
- 20,4204 bedrooms
- 3,0215+ bedrooms
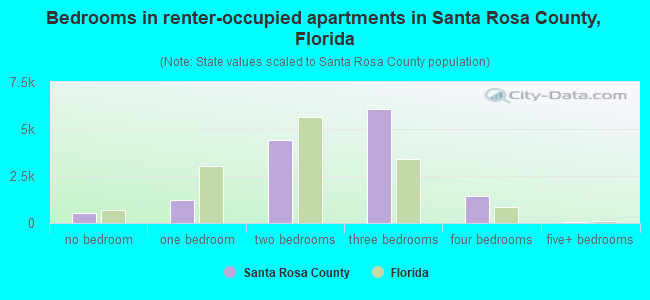
- Bedrooms in renter-occupied apartments in Santa Rosa County, Florida
- 1,261no bedroom
- 1,6291 bedroom
- 4,1112 bedrooms
- 6,1363 bedrooms
- 1,8014 bedrooms
- 1165+ bedrooms
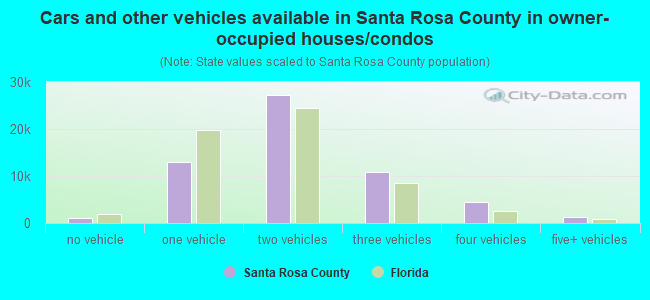
- Cars and other vehicles available in Santa Rosa County in owner-occupied houses/condos
- 913no vehicle
- 14,0241 vehicle
- 26,2772 vehicles
- 11,6983 vehicles
- 4,2234 vehicles
- 1,3565+ vehicles
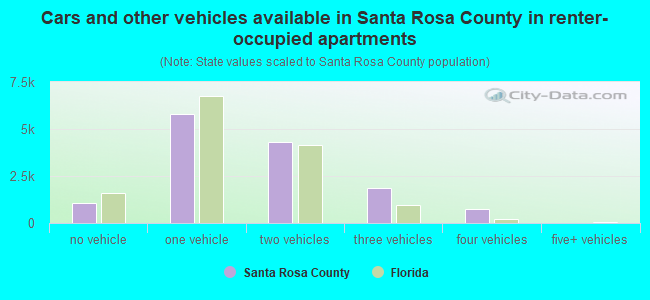
- Cars and other vehicles available in Santa Rosa County in renter-occupied apartments
- 2,580no vehicle
- 5,8911 vehicle
- 4,3862 vehicles
- 1,3323 vehicles
- 7134 vehicles
- 1525+ vehicles
82.7% of Santa Rosa County residents lived in the same house 1 years ago.
Out of people who lived in different houses, 28% lived in this county.
Out of people who lived in different counties, 44% lived in Florida.
| Santa Rosa County: | 82.7% |
| State average: | 86.3% |
Place of birth for U.S.-born residents:
- This state: 74,011
- Other state: 111,242
- Northeast: 17,054
- Midwest: 21,962
- South: 56,016
- West: 16,210
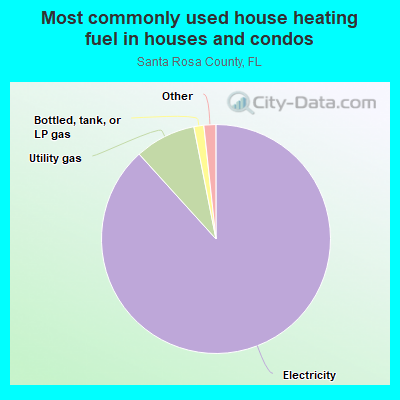
- 88.2%Electricity
- 8.6%Utility gas
- 1.2%Bottled, tank, or LP gas
- 0.7%Wood
- 0.7%Solar energy
- 0.6%No fuel used
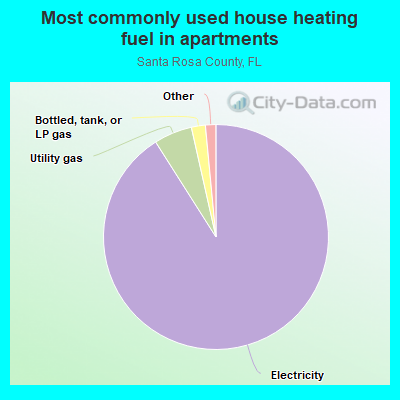
- 90.6%Electricity
- 5.5%Utility gas
- 1.7%Bottled, tank, or LP gas
- 1.1%Wood
- 1.0%No fuel used
Private vs. public school enrollment:
| Here: | 14.1% |
| Florida: | 15.8% |
| Here: | 11.2% |
| Florida: | 12.9% |
| Here: | 20.8% |
| Florida: | 23.6% |
Santa Rosa County government finances - Expenditure in 2018:
- Charges - Other: $14,690,000
Other: $14,047,000
Solid Waste Management: $11,323,000
Solid Waste Management: $9,394,000
Parks and Recreation: $534,000
Parks and Recreation: $482,000
Natural Resources - Other: $298,000
Regular Highways: $62,000
Regular Highways: $52,000
Natural Resources - Other: $43,000
- Construction - General - Other: $8,478,000
Regular Highways: $917,000
- Current Operations - Police Protection: $48,349,000
Police Protection: $37,511,000
General - Other: $16,249,000
Regular Highways: $16,189,000
Financial Administration: $14,668,000
Financial Administration: $14,310,000
Regular Highways: $14,301,000
General - Other: $7,382,000
Solid Waste Management: $6,825,000
Judicial and Legal Services: $6,246,000
Judicial and Legal Services: $5,920,000
Health - Other: $5,079,000
Health - Other: $4,889,000
Natural Resources - Other: $4,845,000
Solid Waste Management: $4,696,000
Local Fire Protection: $4,423,000
Central Staff Services: $3,634,000
Local Fire Protection: $3,500,000
Central Staff Services: $2,950,000
Protective Inspection and Regulation - Other: $2,473,000
Water Utilities: $2,439,000
Natural Resources - Other: $2,410,000
Libraries: $2,251,000
Sewerage: $2,194,000
Parks and Recreation: $2,081,000
Libraries: $1,960,000
Protective Inspection and Regulation - Other: $1,884,000
Air Transportation: $1,693,000
Correctional Institutions: $1,338,000
Housing and Community Development: $1,110,000
Correctional Institutions: $1,079,000
Parks and Recreation: $1,060,000
Housing and Community Development: $1,002,000
Air Transportation: $575,000
General Public Buildings: $490,000
General Public Buildings: $440,000
Electric Utilities: $366,000
Public Welfare - Other: $201,000
Public Welfare - Other: $159,000
Toll Highways: $83,000
Toll Highways: $19,000
- Federal Intergovernmental - Other: $7,988,000
Other: $1,463,000
Air Transportation: $1,080,000
Sewerage: $678,000
Highways: $114,000
Highways: $104,000
Sewerage: $5,000
General Local Government Support: $4,000
General Local Government Support: $4,000
- General - Interest on Debt: $144,000
Interest on Debt: $104,000
- Intergovernmental to State - Health - Other: $2,000,000
Health - Other: $2,000,000
- Local Intergovernmental - General Local Government Support: $305,000
General Local Government Support: $300,000
Other: $244,000
Other: $219,000
- Long Term Debt - Beginning Outstanding - Unspecified Public Purpose: $9,666,000
Outstanding Unspecified Public Purpose: $7,759,000
Beginning Outstanding - Unspecified Public Purpose: $6,898,000
Outstanding Unspecified Public Purpose: $4,004,000
Retired Unspecified Public Purpose: $1,586,000
Retired Unspecified Public Purpose: $1,382,000
Issue, Unspecified Public Purpose: $275,000
- Miscellaneous - Special Assessments: $6,210,000
Special Assessments: $4,644,000
General Revenue - Other: $4,471,000
General Revenue - Other: $3,104,000
Interest Earnings: $1,986,000
Rents: $1,648,000
Fines and Forfeits: $1,586,000
Fines and Forfeits: $1,573,000
Rents: $1,400,000
Donations From Private Sources: $1,202,000
Interest Earnings: $679,000
Sale of Property: $548,000
Sale of Property: $71,000
Donations From Private Sources: $10,000
- Other Capital Outlay - Natural Resources - Other: $7,593,000
Police Protection: $2,457,000
Police Protection: $1,526,000
Regular Highways: $1,068,000
General - Other: $954,000
Parks and Recreation: $685,000
Local Fire Protection: $373,000
Financial Administration: $369,000
Parks and Recreation: $271,000
Financial Administration: $125,000
Correctional Institutions: $75,000
Libraries: $67,000
Health - Other: $57,000
Natural Resources - Other: $53,000
General Public Building: $48,000
General Public Building: $45,000
Health - Other: $26,000
Central Staff Services: $22,000
Protective Inspection and Regulation - Other: $20,000
Judicial and Legal Services: $20,000
Libraries: $18,000
Judicial and Legal Services: $12,000
Central Staff Services: $1,000
- Other Funds - Cash and Securities: $108,845,000
Cash and Securities: $104,241,000
- Revenue - Water Utilities: $2,377,000
Water Utilities: $2,164,000
- State Intergovernmental - General Local Government Support: $13,307,000
General Local Government Support: $11,869,000
Highways: $3,934,000
Highways: $3,666,000
Other: $3,361,000
Other: $1,301,000
Public Welfare: $1,146,000
Sewerage: $459,000
Public Welfare: $425,000
Health and Hospitals: $223,000
Health and Hospitals: $223,000
Sewerage: $115,000
- Tax - Property: $56,285,000
Property: $49,696,000
General Sales and Gross Receipts: $11,319,000
Motor Fuels Sales: $8,103,000
Motor Fuels Sales: $7,659,000
Occupation and Business License - Other: $7,202,000
Occupation and Business License - Other: $6,756,000
Other Selective Sales: $3,924,000
Other License: $3,509,000
Other License: $3,032,000
Other Selective Sales: $2,742,000
Public Utilities Sales: $1,042,000
Public Utilities Sales: $994,000
Santa Rosa County government finances - Revenue in 2018:
- Charges - Other: $14,690,000
Other: $14,047,000
Solid Waste Management: $11,323,000
Solid Waste Management: $9,394,000
Parks and Recreation: $534,000
Parks and Recreation: $482,000
Natural Resources - Other: $298,000
Regular Highways: $62,000
Regular Highways: $52,000
Natural Resources - Other: $43,000
- Construction - General - Other: $8,478,000
Regular Highways: $917,000
- Current Operations - Police Protection: $48,349,000
Police Protection: $37,511,000
General - Other: $16,249,000
Regular Highways: $16,189,000
Financial Administration: $14,668,000
Financial Administration: $14,310,000
Regular Highways: $14,301,000
General - Other: $7,382,000
Solid Waste Management: $6,825,000
Judicial and Legal Services: $6,246,000
Judicial and Legal Services: $5,920,000
Health - Other: $5,079,000
Health - Other: $4,889,000
Natural Resources - Other: $4,845,000
Solid Waste Management: $4,696,000
Local Fire Protection: $4,423,000
Central Staff Services: $3,634,000
Local Fire Protection: $3,500,000
Central Staff Services: $2,950,000
Protective Inspection and Regulation - Other: $2,473,000
Water Utilities: $2,439,000
Natural Resources - Other: $2,410,000
Libraries: $2,251,000
Sewerage: $2,194,000
Parks and Recreation: $2,081,000
Libraries: $1,960,000
Protective Inspection and Regulation - Other: $1,884,000
Air Transportation: $1,693,000
Correctional Institutions: $1,338,000
Housing and Community Development: $1,110,000
Correctional Institutions: $1,079,000
Parks and Recreation: $1,060,000
Housing and Community Development: $1,002,000
Air Transportation: $575,000
General Public Buildings: $490,000
General Public Buildings: $440,000
Electric Utilities: $366,000
Public Welfare - Other: $201,000
Public Welfare - Other: $159,000
Toll Highways: $83,000
Toll Highways: $19,000
- Federal Intergovernmental - Other: $7,988,000
Other: $1,463,000
Air Transportation: $1,080,000
Sewerage: $678,000
Highways: $114,000
Highways: $104,000
Sewerage: $5,000
General Local Government Support: $4,000
General Local Government Support: $4,000
- General - Interest on Debt: $144,000
Interest on Debt: $104,000
- Intergovernmental to State - Health - Other: $2,000,000
Health - Other: $2,000,000
- Local Intergovernmental - General Local Government Support: $305,000
General Local Government Support: $300,000
Other: $244,000
Other: $219,000
- Long Term Debt - Beginning Outstanding - Unspecified Public Purpose: $9,666,000
Outstanding Unspecified Public Purpose: $7,759,000
Beginning Outstanding - Unspecified Public Purpose: $6,898,000
Outstanding Unspecified Public Purpose: $4,004,000
Retired Unspecified Public Purpose: $1,586,000
Retired Unspecified Public Purpose: $1,382,000
Issue, Unspecified Public Purpose: $275,000
- Miscellaneous - Special Assessments: $6,210,000
Special Assessments: $4,644,000
General Revenue - Other: $4,471,000
General Revenue - Other: $3,104,000
Interest Earnings: $1,986,000
Rents: $1,648,000
Fines and Forfeits: $1,586,000
Fines and Forfeits: $1,573,000
Rents: $1,400,000
Donations From Private Sources: $1,202,000
Interest Earnings: $679,000
Sale of Property: $548,000
Sale of Property: $71,000
Donations From Private Sources: $10,000
- Other Capital Outlay - Natural Resources - Other: $7,593,000
Police Protection: $2,457,000
Police Protection: $1,526,000
Regular Highways: $1,068,000
General - Other: $954,000
Parks and Recreation: $685,000
Local Fire Protection: $373,000
Financial Administration: $369,000
Parks and Recreation: $271,000
Financial Administration: $125,000
Correctional Institutions: $75,000
Libraries: $67,000
Health - Other: $57,000
Natural Resources - Other: $53,000
General Public Building: $48,000
General Public Building: $45,000
Health - Other: $26,000
Central Staff Services: $22,000
Protective Inspection and Regulation - Other: $20,000
Judicial and Legal Services: $20,000
Libraries: $18,000
Judicial and Legal Services: $12,000
Central Staff Services: $1,000
- Other Funds - Cash and Securities: $108,845,000
Cash and Securities: $104,241,000
- Revenue - Water Utilities: $2,377,000
Water Utilities: $2,164,000
- State Intergovernmental - General Local Government Support: $13,307,000
General Local Government Support: $11,869,000
Highways: $3,934,000
Highways: $3,666,000
Other: $3,361,000
Other: $1,301,000
Public Welfare: $1,146,000
Sewerage: $459,000
Public Welfare: $425,000
Health and Hospitals: $223,000
Health and Hospitals: $223,000
Sewerage: $115,000
- Tax - Property: $56,285,000
Property: $49,696,000
General Sales and Gross Receipts: $11,319,000
Motor Fuels Sales: $8,103,000
Motor Fuels Sales: $7,659,000
Occupation and Business License - Other: $7,202,000
Occupation and Business License - Other: $6,756,000
Other Selective Sales: $3,924,000
Other License: $3,509,000
Other License: $3,032,000
Other Selective Sales: $2,742,000
Public Utilities Sales: $1,042,000
Public Utilities Sales: $994,000
Santa Rosa County government finances - Debt in 2018:
- Charges - Other: $14,690,000
Other: $14,047,000
Solid Waste Management: $11,323,000
Solid Waste Management: $9,394,000
Parks and Recreation: $534,000
Parks and Recreation: $482,000
Natural Resources - Other: $298,000
Regular Highways: $62,000
Regular Highways: $52,000
Natural Resources - Other: $43,000
- Construction - General - Other: $8,478,000
Regular Highways: $917,000
- Current Operations - Police Protection: $48,349,000
Police Protection: $37,511,000
General - Other: $16,249,000
Regular Highways: $16,189,000
Financial Administration: $14,668,000
Financial Administration: $14,310,000
Regular Highways: $14,301,000
General - Other: $7,382,000
Solid Waste Management: $6,825,000
Judicial and Legal Services: $6,246,000
Judicial and Legal Services: $5,920,000
Health - Other: $5,079,000
Health - Other: $4,889,000
Natural Resources - Other: $4,845,000
Solid Waste Management: $4,696,000
Local Fire Protection: $4,423,000
Central Staff Services: $3,634,000
Local Fire Protection: $3,500,000
Central Staff Services: $2,950,000
Protective Inspection and Regulation - Other: $2,473,000
Water Utilities: $2,439,000
Natural Resources - Other: $2,410,000
Libraries: $2,251,000
Sewerage: $2,194,000
Parks and Recreation: $2,081,000
Libraries: $1,960,000
Protective Inspection and Regulation - Other: $1,884,000
Air Transportation: $1,693,000
Correctional Institutions: $1,338,000
Housing and Community Development: $1,110,000
Correctional Institutions: $1,079,000
Parks and Recreation: $1,060,000
Housing and Community Development: $1,002,000
Air Transportation: $575,000
General Public Buildings: $490,000
General Public Buildings: $440,000
Electric Utilities: $366,000
Public Welfare - Other: $201,000
Public Welfare - Other: $159,000
Toll Highways: $83,000
Toll Highways: $19,000
- Federal Intergovernmental - Other: $7,988,000
Other: $1,463,000
Air Transportation: $1,080,000
Sewerage: $678,000
Highways: $114,000
Highways: $104,000
Sewerage: $5,000
General Local Government Support: $4,000
General Local Government Support: $4,000
- General - Interest on Debt: $144,000
Interest on Debt: $104,000
- Intergovernmental to State - Health - Other: $2,000,000
Health - Other: $2,000,000
- Local Intergovernmental - General Local Government Support: $305,000
General Local Government Support: $300,000
Other: $244,000
Other: $219,000
- Long Term Debt - Beginning Outstanding - Unspecified Public Purpose: $9,666,000
Outstanding Unspecified Public Purpose: $7,759,000
Beginning Outstanding - Unspecified Public Purpose: $6,898,000
Outstanding Unspecified Public Purpose: $4,004,000
Retired Unspecified Public Purpose: $1,586,000
Retired Unspecified Public Purpose: $1,382,000
Issue, Unspecified Public Purpose: $275,000
- Miscellaneous - Special Assessments: $6,210,000
Special Assessments: $4,644,000
General Revenue - Other: $4,471,000
General Revenue - Other: $3,104,000
Interest Earnings: $1,986,000
Rents: $1,648,000
Fines and Forfeits: $1,586,000
Fines and Forfeits: $1,573,000
Rents: $1,400,000
Donations From Private Sources: $1,202,000
Interest Earnings: $679,000
Sale of Property: $548,000
Sale of Property: $71,000
Donations From Private Sources: $10,000
- Other Capital Outlay - Natural Resources - Other: $7,593,000
Police Protection: $2,457,000
Police Protection: $1,526,000
Regular Highways: $1,068,000
General - Other: $954,000
Parks and Recreation: $685,000
Local Fire Protection: $373,000
Financial Administration: $369,000
Parks and Recreation: $271,000
Financial Administration: $125,000
Correctional Institutions: $75,000
Libraries: $67,000
Health - Other: $57,000
Natural Resources - Other: $53,000
General Public Building: $48,000
General Public Building: $45,000
Health - Other: $26,000
Central Staff Services: $22,000
Protective Inspection and Regulation - Other: $20,000
Judicial and Legal Services: $20,000
Libraries: $18,000
Judicial and Legal Services: $12,000
Central Staff Services: $1,000
- Other Funds - Cash and Securities: $108,845,000
Cash and Securities: $104,241,000
- Revenue - Water Utilities: $2,377,000
Water Utilities: $2,164,000
- State Intergovernmental - General Local Government Support: $13,307,000
General Local Government Support: $11,869,000
Highways: $3,934,000
Highways: $3,666,000
Other: $3,361,000
Other: $1,301,000
Public Welfare: $1,146,000
Sewerage: $459,000
Public Welfare: $425,000
Health and Hospitals: $223,000
Health and Hospitals: $223,000
Sewerage: $115,000
- Tax - Property: $56,285,000
Property: $49,696,000
General Sales and Gross Receipts: $11,319,000
Motor Fuels Sales: $8,103,000
Motor Fuels Sales: $7,659,000
Occupation and Business License - Other: $7,202,000
Occupation and Business License - Other: $6,756,000
Other Selective Sales: $3,924,000
Other License: $3,509,000
Other License: $3,032,000
Other Selective Sales: $2,742,000
Public Utilities Sales: $1,042,000
Public Utilities Sales: $994,000
Santa Rosa County government finances - Cash and Securities in 2018:
- Charges - Other: $14,690,000
Other: $14,047,000
Solid Waste Management: $11,323,000
Solid Waste Management: $9,394,000
Parks and Recreation: $534,000
Parks and Recreation: $482,000
Natural Resources - Other: $298,000
Regular Highways: $62,000
Regular Highways: $52,000
Natural Resources - Other: $43,000
- Construction - General - Other: $8,478,000
Regular Highways: $917,000
- Current Operations - Police Protection: $48,349,000
Police Protection: $37,511,000
General - Other: $16,249,000
Regular Highways: $16,189,000
Financial Administration: $14,668,000
Financial Administration: $14,310,000
Regular Highways: $14,301,000
General - Other: $7,382,000
Solid Waste Management: $6,825,000
Judicial and Legal Services: $6,246,000
Judicial and Legal Services: $5,920,000
Health - Other: $5,079,000
Health - Other: $4,889,000
Natural Resources - Other: $4,845,000
Solid Waste Management: $4,696,000
Local Fire Protection: $4,423,000
Central Staff Services: $3,634,000
Local Fire Protection: $3,500,000
Central Staff Services: $2,950,000
Protective Inspection and Regulation - Other: $2,473,000
Water Utilities: $2,439,000
Natural Resources - Other: $2,410,000
Libraries: $2,251,000
Sewerage: $2,194,000
Parks and Recreation: $2,081,000
Libraries: $1,960,000
Protective Inspection and Regulation - Other: $1,884,000
Air Transportation: $1,693,000
Correctional Institutions: $1,338,000
Housing and Community Development: $1,110,000
Correctional Institutions: $1,079,000
Parks and Recreation: $1,060,000
Housing and Community Development: $1,002,000
Air Transportation: $575,000
General Public Buildings: $490,000
General Public Buildings: $440,000
Electric Utilities: $366,000
Public Welfare - Other: $201,000
Public Welfare - Other: $159,000
Toll Highways: $83,000
Toll Highways: $19,000
- Federal Intergovernmental - Other: $7,988,000
Other: $1,463,000
Air Transportation: $1,080,000
Sewerage: $678,000
Highways: $114,000
Highways: $104,000
Sewerage: $5,000
General Local Government Support: $4,000
General Local Government Support: $4,000
- General - Interest on Debt: $144,000
Interest on Debt: $104,000
- Intergovernmental to State - Health - Other: $2,000,000
Health - Other: $2,000,000
- Local Intergovernmental - General Local Government Support: $305,000
General Local Government Support: $300,000
Other: $244,000
Other: $219,000
- Long Term Debt - Beginning Outstanding - Unspecified Public Purpose: $9,666,000
Outstanding Unspecified Public Purpose: $7,759,000
Beginning Outstanding - Unspecified Public Purpose: $6,898,000
Outstanding Unspecified Public Purpose: $4,004,000
Retired Unspecified Public Purpose: $1,586,000
Retired Unspecified Public Purpose: $1,382,000
Issue, Unspecified Public Purpose: $275,000
- Miscellaneous - Special Assessments: $6,210,000
Special Assessments: $4,644,000
General Revenue - Other: $4,471,000
General Revenue - Other: $3,104,000
Interest Earnings: $1,986,000
Rents: $1,648,000
Fines and Forfeits: $1,586,000
Fines and Forfeits: $1,573,000
Rents: $1,400,000
Donations From Private Sources: $1,202,000
Interest Earnings: $679,000
Sale of Property: $548,000
Sale of Property: $71,000
Donations From Private Sources: $10,000
- Other Capital Outlay - Natural Resources - Other: $7,593,000
Police Protection: $2,457,000
Police Protection: $1,526,000
Regular Highways: $1,068,000
General - Other: $954,000
Parks and Recreation: $685,000
Local Fire Protection: $373,000
Financial Administration: $369,000
Parks and Recreation: $271,000
Financial Administration: $125,000
Correctional Institutions: $75,000
Libraries: $67,000
Health - Other: $57,000
Natural Resources - Other: $53,000
General Public Building: $48,000
General Public Building: $45,000
Health - Other: $26,000
Central Staff Services: $22,000
Protective Inspection and Regulation - Other: $20,000
Judicial and Legal Services: $20,000
Libraries: $18,000
Judicial and Legal Services: $12,000
Central Staff Services: $1,000
- Other Funds - Cash and Securities: $108,845,000
Cash and Securities: $104,241,000
- Revenue - Water Utilities: $2,377,000
Water Utilities: $2,164,000
- State Intergovernmental - General Local Government Support: $13,307,000
General Local Government Support: $11,869,000
Highways: $3,934,000
Highways: $3,666,000
Other: $3,361,000
Other: $1,301,000
Public Welfare: $1,146,000
Sewerage: $459,000
Public Welfare: $425,000
Health and Hospitals: $223,000
Health and Hospitals: $223,000
Sewerage: $115,000
- Tax - Property: $56,285,000
Property: $49,696,000
General Sales and Gross Receipts: $11,319,000
Motor Fuels Sales: $8,103,000
Motor Fuels Sales: $7,659,000
Occupation and Business License - Other: $7,202,000
Occupation and Business License - Other: $6,756,000
Other Selective Sales: $3,924,000
Other License: $3,509,000
Other License: $3,032,000
Other Selective Sales: $2,742,000
Public Utilities Sales: $1,042,000
Public Utilities Sales: $994,000
Supplemental Security Income (SSI) in 2006:
- Total number of recipients: 2,003
- Number of aged recipients: 168
- Number of blind and disabled recipients: 1,835
- Number of recipients under 18: 301
- Number of recipients between 18 and 64: 1,354
- Number of recipients older than 64: 348
- Number of recipients also receiving OASDI: 708
- Amount of payments (thousands of dollars): 843
| Home Mortgage Disclosure Act Aggregated Statistics For Year 2009 (Based on 19 full tracts) | ||||||||||||||
| A) FHA, FSA/RHS & VA Home Purchase Loans | B) Conventional Home Purchase Loans | C) Refinancings | D) Home Improvement Loans | E) Loans on Dwellings For 5+ Families | F) Non-occupant Loans on < 5 Family Dwellings (A B C & D) | G) Loans On Manufactured Home Dwelling (A B C & D) | ||||||||
|---|---|---|---|---|---|---|---|---|---|---|---|---|---|---|
| Number | Average Value | Number | Average Value | Number | Average Value | Number | Average Value | Number | Average Value | Number | Average Value | Number | Average Value | |
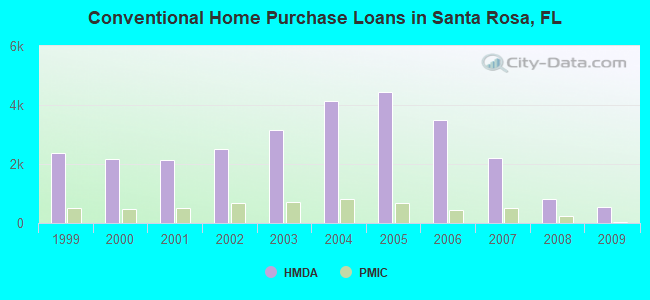
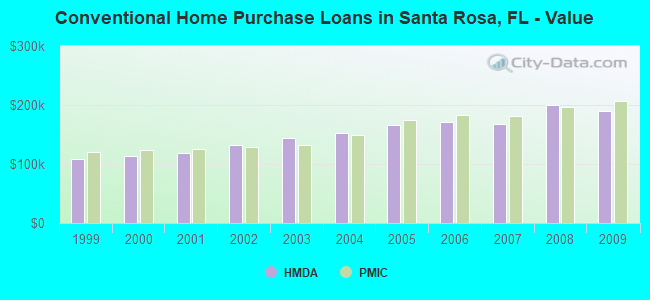
| LOANS ORIGINATED | 1,363 | $172,193 | 546 | $189,082 | 2,276 | $178,494 | 116 | $70,810 | 2 | $1,853,500 | 281 | $182,836 | 65 | $65,831 |
| APPLICATIONS APPROVED, NOT ACCEPTED | 40 | $188,525 | 44 | $135,409 | 203 | $171,345 | 4 | $43,750 | 0 | $0 | 23 | $164,609 | 28 | $43,321 |
| APPLICATIONS DENIED | 152 | $153,961 | 112 | $165,562 | 1,018 | $177,162 | 101 | $47,267 | 0 | $0 | 120 | $182,983 | 88 | $55,057 |
| APPLICATIONS WITHDRAWN | 116 | $163,190 | 87 | $175,437 | 739 | $180,701 | 15 | $84,133 | 0 | $0 | 66 | $150,106 | 25 | $74,760 |
| FILES CLOSED FOR INCOMPLETENESS | 17 | $143,059 | 17 | $266,000 | 193 | $166,632 | 14 | $61,000 | 0 | $0 | 20 | $222,200 | 12 | $62,833 |
| Private Mortgage Insurance Companies Aggregated Statistics For Year 2009 (Based on 17 full tracts) | ||||||
| A) Conventional Home Purchase Loans | B) Refinancings | C) Non-occupant Loans on < 5 Family Dwellings (A & B) | ||||
|---|---|---|---|---|---|---|
| Number | Average Value | Number | Average Value | Number | Average Value | |
| LOANS ORIGINATED | 45 | $207,578 | 19 | $189,947 | 2 | $118,500 |
| APPLICATIONS APPROVED, NOT ACCEPTED | 15 | $184,600 | 9 | $241,556 | 0 | $0 |
| APPLICATIONS DENIED | 9 | $247,889 | 26 | $189,385 | 1 | $135,000 |
| APPLICATIONS WITHDRAWN | 1 | $113,000 | 8 | $222,750 | 0 | $0 |
| FILES CLOSED FOR INCOMPLETENESS | 6 | $175,667 | 3 | $133,333 | 3 | $107,667 |
| Most common first names in Santa Rosa County, FL among deceased individuals | ||
| Name | Count | Lived (average) |
|---|---|---|
| James | 492 | 69.7 years |
| William | 482 | 71.4 years |
| John | 473 | 71.8 years |
| Mary | 406 | 77.8 years |
| Robert | 366 | 69.9 years |
| Charles | 262 | 70.9 years |
| George | 201 | 74.6 years |
| Thomas | 145 | 72.3 years |
| Joseph | 143 | 71.2 years |
| Dorothy | 131 | 76.8 years |
| Most common last names in Santa Rosa County, FL among deceased individuals | ||
| Last name | Count | Lived (average) |
|---|---|---|
| Smith | 266 | 74.6 years |
| Johnson | 130 | 73.6 years |
| Jones | 125 | 74.4 years |
| Williams | 118 | 71.7 years |
| Davis | 107 | 72.9 years |
| Brown | 106 | 75.8 years |
| Lewis | 86 | 77.2 years |
| Thompson | 80 | 74.4 years |
| Nelson | 80 | 74.9 years |
| Martin | 75 | 75.1 years |
| Businesses in Santa Rosa County, FL | ||||
| Name | Count | Name | Count | |
|---|---|---|---|---|
| AT&T | 4 | Marriott | 1 | |
| Ace Hardware | 2 | Maurices | 1 | |
| Advance Auto Parts | 4 | McDonald's | 5 | |
| Arby's | 2 | Nike | 2 | |
| AutoZone | 2 | Office Depot | 2 | |
| Baskin-Robbins | 2 | Papa John's Pizza | 3 | |
| Best Western | 1 | Penske | 1 | |
| Blockbuster | 3 | PetSmart | 1 | |
| Burger King | 4 | Pizza Hut | 5 | |
| CVS | 5 | Publix Super Markets | 3 | |
| Chevrolet | 1 | Quality | 1 | |
| Chick-Fil-A | 1 | RadioShack | 3 | |
| Church's Chicken | 2 | Red Roof Inn | 1 | |
| ColorTyme | 1 | Ruby Tuesday | 1 | |
| Comfort Inn | 1 | Rue21 | 1 | |
| Curves | 1 | Ryan's Grill | 1 | |
| Dairy Queen | 1 | SONIC Drive-In | 3 | |
| Days Inn | 2 | Sears | 2 | |
| Domino's Pizza | 1 | Shoe Carnival | 1 | |
| FedEx | 10 | Sprint Nextel | 1 | |
| GameStop | 1 | Starbucks | 2 | |
| Goodwill | 1 | Subway | 11 | |
| H&R Block | 5 | T-Mobile | 4 | |
| Hardee's | 1 | T.J.Maxx | 1 | |
| Hilton | 3 | Taco Bell | 4 | |
| Holiday Inn | 3 | Target | 1 | |
| Home Depot | 1 | Travelodge | 1 | |
| Jones New York | 1 | U-Haul | 12 | |
| KFC | 2 | UPS | 15 | |
| Kincaid | 1 | Verizon Wireless | 1 | |
| Kmart | 1 | Village Inn | 1 | |
| Kroger | 23 | Waffle House | 8 | |
| La-Z-Boy | 2 | Walgreens | 3 | |
| Lane Furniture | 2 | Walmart | 2 | |
| Little Caesars Pizza | 1 | YMCA | 1 | |
| Lowe's | 1 | |||
Santa Rosa County on our top lists:
- #33 on the list of "Top 101 counties with highest percentage of residents voting for Romney (Republican) in the 2012 Presidential Election (pop. 50,000+)"
- #45 on the list of "Top 101 counties with the highest percentage of residents relocating from foreign countries between 2010 and 2011 (pop. 50,000+)"
- #56 on the list of "Top 101 counties with the highest percentage of residents relocating to foreign countries in 2011 (pop. 50,000+)"
- #57 on the list of "Top 101 counties with the highest percentage of residents relocating from other counties between 2010 and 2011 (pop. 50,000+)"
- #67 on the list of "Top 101 counties with the highest percentage of residents relocating to other counties in 2011 (pop. 50,000+)"
- #67 on the list of "Top 101 counties with the highest percentage of residents relocating from foreign countries between 2010 and 2011"
- #81 on the list of "Top 101 counties with the highest percentage of residents relocating to foreign countries in 2011"