Screven County, Georgia (GA)
County owner-occupied free and clear houses and condos in 2010: 1,793
County owner-occupied houses and condos in 2000: 4,507
Renter-occupied apartments: 1,505 (it was 1,290 in 2000)
| % of renters here: | 22% |
| State: | 34% |
Land area: 648 sq. mi.
Water area: 7.1 sq. mi.
Population density: 22 people per square mile (low).
Industries providing employment: Educational, health and social services (20.2%), Manufacturing (17.9%), Retail trade (10.6%).
Type of workers:
- Private wage or salary: 76%
- Government: 16%
- Self-employed, not incorporated: 8%
- Unpaid family work: 0%
- OSM Map
- General Map
- Google Map
- MSN Map


- 7,71554.7%White Non-Hispanic Alone
- 5,64340.0%Black Non-Hispanic Alone
- 3832.7%Hispanic or Latino
- 2982.1%Two or more races
- 580.4%Asian alone
- 120.09%American Indian and Alaska Native alone

| Median resident age: | 42.4 years |
| Georgia median age: | 37.6 years |
| Males: 6,844 | |
| Females: 7,431 |

 | Claxton Poultry to build 75-employee plant in Screven County (2 replies) |
| Georgia tornado count by county (1950-2018) (1 reply) |
| Where does South Georgia begin to you? (39 replies) |
| Latest census estimates put Augusta-Richmond population at 197,182 (4 replies) |
| Statesboro officially added to Savannah-Hinesville CSA (48 replies) |
| County Trivia (28 replies) |
| Screven County: | 2.0 people |
| Georgia: | 3 people |
Estimated median household income in 2022: $50,978 ($29,312 in 1999)
| This county: | $50,978 |
| Georgia: | $72,837 |
Median contract rent in 2022 for apartments: $496 (lower quartile is $306, upper quartile is $600)
| This county: | $496 |
| State: | $1065 |
Estimated median house or condo value in 2022: $130,377 (it was $51,800 in 2000)
| Screven: | $130,377 |
| Georgia: | $297,400 |
Median monthly housing costs for homes and condos with a mortgage: $1,156
Median monthly housing costs for units without a mortgage: $393
Institutionalized population: 403
Crime in 2019 (reported by the sheriff's office or county police, not the county total):
- Murders: 0
- Rapes: 0
- Robberies: 4
- Assaults: 33
- Burglaries: 41
- Thefts: 59
- Auto thefts: 12
Crime in 2018 (reported by the sheriff's office or county police, not the county total):
- Murders: 1
- Rapes: 1
- Robberies: 7
- Assaults: 35
- Burglaries: 65
- Thefts: 74
- Auto thefts: 24

Single-family new house construction building permits:
- 2022: 23 buildings, average cost: $146,300
- 2021: 23 buildings, average cost: $200,600
- 2020: 21 buildings, average cost: $22,100
- 2019: 35 buildings, average cost: $198,900
- 2018: 32 buildings, average cost: $198,900
- 2017: 21 buildings, average cost: $153,200
- 2016: 32 buildings, average cost: $213,100
- 2015: 19 buildings, average cost: $169,300
- 2014: 10 buildings, average cost: $151,900
- 2013: 11 buildings, average cost: $151,900
- 2012: 15 buildings, average cost: $181,600
- 2011: 7 buildings, average cost: $175,600
- 2010: 7 buildings, average cost: $175,600
- 2009: 28 buildings, average cost: $150,000
- 2008: 31 buildings, average cost: $214,000
- 2007: 27 buildings, average cost: $196,700
- 2006: 41 buildings, average cost: $94,900
- 2005: 42 buildings, average cost: $148,500
- 2004: 53 buildings, average cost: $128,000
- 2003: 1 building, cost: $140,000
- 2002: 45 buildings, average cost: $41,400
- 2001: 1 building, cost: $90,000
- 2000: 6 buildings, average cost: $59,900
- 1999: 8 buildings, average cost: $64,100
- 1998: 8 buildings, average cost: $39,300
- 1997: 5 buildings, average cost: $87,600


Median real estate property taxes paid for housing units with mortgages in 2022: $1,581 (1.0%)
Median real estate property taxes paid for housing units with no mortgage in 2022: $998 (1.0%)


| Screven County: | 17.2% |
| Georgia: | 12.7% |
Median age of residents in 2022: 42.4 years old
(Males: 42.5 years old, Females: 42.4 years old)
(Median age for: White residents: 47.1 years old, Black residents: 40.4 years old, Asian residents: 47.1 years old, Hispanic or Latino residents: 26.8 years old, Other race residents: 63.7 years old)
Fair market rent in 2006 for a 1-bedroom apartment in Screven County is $348 a month.
Fair market rent for a 2-bedroom apartment is $458 a month.
Fair market rent for a 3-bedroom apartment is $548 a month.
Cities in this county include: Sylvania, Millhaven, Hiltonia, Newington, Oliver, Rocky Ford.
| Here: | 3.8% |
| Georgia: | 2.9% |


Current college students: 580
People 25 years of age or older with a high school degree or higher: 84.9%
People 25 years of age or older with a bachelor's degree or higher: 15.7%
Number of foreign born residents: 182 (81.6% naturalized citizens)
| Screven County: | 1.3% |
| Whole state: | 10.7% |

- Year of entry for the foreign-born population
- 192010 or later
- 722000 to 2009
- 371990 to 1999
- 631980 to 1989
- 101970 to 1979
- 39Before 1970
Mean travel time to work (commute): minutes
Percentage of county residents living and working in this county: 96.8%


Housing units in structures:
- One, detached: 3,847
- One, attached: 29
- Two: 171
- 3 or 4: 203
- 5 to 9: 37
- 50 or more: 44
- Mobile homes: 2,343
- Boats, RVs, vans, etc.: 2
Housing units in Screven County with a mortgage: 1,512 (104 second mortgage, 0 home equity loan, 80 both second mortgage and home equity loan)
Houses without a mortgage: 90
| Here: | 1.1% with mortgage |
| State: | 98.2% with mortgage |
Religion statistics for Screven County
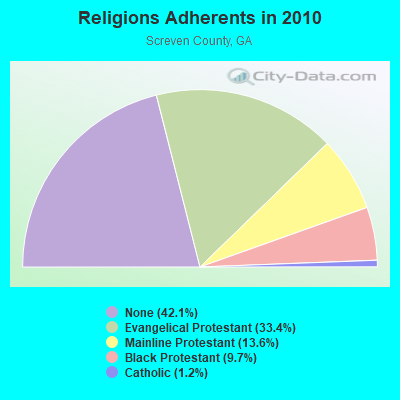
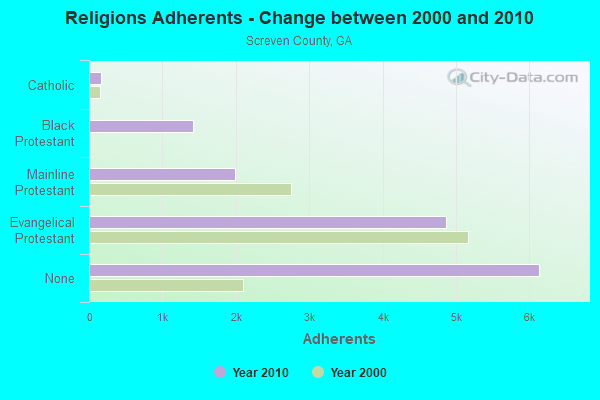
| Religion | Adherents | Congregations |
|---|---|---|
| Evangelical Protestant | 4,871 | 34 |
| Mainline Protestant | 1,990 | 19 |
| Black Protestant | 1,420 | 10 |
| Catholic | 170 | 1 |
| Other | 3 | 1 |
| None | 6,139 | - |
Source: Clifford Grammich, Kirk Hadaway, Richard Houseal, Dale E.Jones, Alexei Krindatch, Richie Stanley and Richard H.Taylor. 2012. 2010 U.S.Religion Census: Religious Congregations & Membership Study. Association of Statisticians of American Religious Bodies. Jones, Dale E., et al. 2002. Congregations and Membership in the United States 2000. Nashville, TN: Glenmary Research Center.
Food Environment Statistics:
| Screven County: | 1.99 / 10,000 pop. |
| State: | 1.91 / 10,000 pop. |
| This county: | 0.66 / 10,000 pop. |
| Georgia: | 0.86 / 10,000 pop. |
| Screven County: | 7.98 / 10,000 pop. |
| Georgia: | 5.12 / 10,000 pop. |
| This county: | 5.98 / 10,000 pop. |
| State: | 7.41 / 10,000 pop. |
| Screven County: | 14.3% |
| Georgia: | 10.4% |
| Screven County: | 30.9% |
| State: | 27.8% |
| Here: | 11.7% |
| State: | 14.6% |
Agriculture in Screven County:
Average size of farms: 531 acresAverage value of agricultural products sold per farm: $54,162
Average value of crops sold per acre for harvested cropland: $296.40
The value of livestock, poultry, and their products as a percentage of the total market value of agricultural products sold: 14.33%
Average total farm production expenses per farm: $57,408
Harvested cropland as a percentage of land in farms: 29.49%
Irrigated harvested cropland as a percentage of land in farms: 21.72%
Average market value of all machinery and equipment per farm: $82,840
The percentage of farms operated by a family or individual: 88.18%
Average age of principal farm operators: 56 years
Average number of cattle and calves per 100 acres of all land in farms: 4.42
Corn for grain: 7144 harvested acres
All wheat for grain: 2179 harvested acres
Upland cotton: 20050 harvested acres
Soybeans for beans: 7434 harvested acres
Vegetables: 350 harvested acres
Land in orchards: 1,425 acres
Earthquake activity:
Screven County-area historical earthquake activity is significantly above Georgia state average. It is 32% smaller than the overall U.S. average.On 8/2/1974 at 08:52:09, a magnitude 4.9 (4.3 MB, 4.9 LG, Class: Light, Intensity: IV - V) earthquake occurred 92.3 miles away from Screven County center
On 11/22/1974 at 05:25:55, a magnitude 4.7 (4.7 MB) earthquake occurred 87.1 miles away from the county center
On 8/21/1992 at 16:31:55, a magnitude 4.4 (4.1 MB, 4.1 LG, 4.4 LG, Depth: 6.2 mi) earthquake occurred 90.5 miles away from the county center
On 8/9/2020 at 12:07:37, a magnitude 5.1 (5.1 MW, Depth: 4.7 mi, Class: Moderate, Intensity: VI - VII) earthquake occurred 259.8 miles away from the county center
On 2/15/2014 at 03:23:38, a magnitude 4.1 (4.1 MW, Depth: 3.2 mi) earthquake occurred 78.7 miles away from Screven County center
On 8/23/2011 at 17:51:04, a magnitude 5.8 (5.8 MW, Depth: 3.7 mi) earthquake occurred 413.5 miles away from the county center
Magnitude types: regional Lg-wave magnitude (LG), body-wave magnitude (MB), moment magnitude (MW)
Most recent natural disasters:
- Georgia Covid-19 Pandemic, Incident Period: January 20, 2020, FEMA Id: 4501, Natural disaster type: Other
- Georgia Hurricane Michael, Incident Period: October 9, 2018 - October 23, 2018, Major Disaster (Presidential) Declared DR-4400-GA: October 14, 2018, FEMA Id: 4400, Natural disaster type: Hurricane
- Georgia Hurricane Matthew, Incident Period: October 04, 2016 to October 15, 2016, Emergency Declared EM-3379: October 06, 2016, FEMA Id: 3379, Natural disaster type: Hurricane
- Georgia Hurricane Matthew, Incident Period: October 04, 2016 to October 15, 2016, Major Disaster (Presidential) Declared DR-4284: October 08, 2016, FEMA Id: 4284, Natural disaster type: Hurricane
- Georgia Severe Winter Storm, Incident Period: February 10, 2014 to February 14, 2014, Emergency Declared EM-3368: February 11, 2014, FEMA Id: 3368, Natural disaster type: Winter Storm
- Georgia Severe Winter Storm, Incident Period: February 10, 2014 to February 15, 2014, Major Disaster (Presidential) Declared DR-4165: March 06, 2014, FEMA Id: 4165, Natural disaster type: Winter Storm
- Georgia Hurricane Katrina Evacuation, Incident Period: August 27, 2005 to October 01, 2005, Emergency Declared EM-3218: September 05, 2005, FEMA Id: 3218, Natural disaster type: Hurricane
- Georgia Severe Storms, Tornadoes and Flooding, Incident Period: February 14, 1998 to May 11, 1998, Major Disaster (Presidential) Declared DR-1209: March 11, 1998, FEMA Id: 1209, Natural disaster type: Storm, Tornado, Flood
- Georgia Severe Snowfall, Winter Storm, Incident Period: March 13, 1993 to March 17, 1993, Emergency Declared EM-3097: March 15, 1993, FEMA Id: 3097, Natural disaster type: Winter Storm, Snowfall
- Georgia Flooding, Severe Storm, Incident Period: October 11, 1990 to October 29, 1990, Major Disaster (Presidential) Declared DR-880: October 19, 1990, FEMA Id: 880, Natural disaster type: Storm, Flood
- 1 other natural disasters have been reported since 1953.
The number of natural disasters in Screven County (11) is smaller than the US average (15).
Major Disasters (Presidential) Declared: 5
Emergencies Declared: 5
Causes of natural disasters: Hurricanes: 4, Winter Storms: 3, Floods: 2, Storms: 2, Drought: 1, Snowfall: 1, Tornado: 1, Other: 1 (Note: some incidents may be assigned to more than one category).

Means of transportation to work:
- Drove a car alone: 3,388 (79.4%)
- Carpooled: 177 (4.1%)
- Bus: 34 (0.8%)
- Taxicab, motorcycle, or other means: 63 (1.5%)
- Walked: 95 (2.2%)
- Worked at home: 432 (10.1%)


- Health care and social assistance (25%)
- Manufacturing (19%)
- Retail trade (14%)
- Educational services (12%)
- Accommodation and food services (7%)
- Other services, except public administration (6%)
- Transportation and warehousing (5%)

- Health care and social assistance (23%)
- Manufacturing (17%)
- Retail trade (13%)
- Educational services (11%)
- Accommodation and food services (6%)
- Other services, except public administration (6%)
- Transportation and warehousing (4%)

- Installation, maintenance, and repair occupations (11%)
- Management occupations (11%)
- Production occupations (10%)
- Sales and related occupations (10%)
- Construction and extraction occupations (9%)
- Transportation occupations (7%)
- Material moving occupations (6%)

- Office and administrative support occupations (25%)
- Health diagnosing and treating practitioners and other technical occupations (8%)
- Material moving occupations (8%)
- Building and grounds cleaning and maintenance occupations (8%)
- Production occupations (7%)
- Sales and related occupations (7%)
- Management occupations (6%)

- Mexico (38%)
- China, excluding Hong Kong and Taiwan (30%)
- Jamaica (10%)
- Canada (9%)
- England (4%)
- Panama (3%)
- Haiti (2%)

- American (10%)
- English (9%)
- Irish (5%)
- European (3%)
- German (1%)
- Scottish (1%)
- French (except Basque) (1%)


People in group quarters in Screven County, Georgia in 2010:
- 146 people in correctional facilities intended for juveniles
- 142 people in local jails and other municipal confinement facilities
- 115 people in nursing facilities/skilled-nursing facilities
- 11 people in workers' group living quarters and job corps centers
- 6 people in group homes intended for adults
People in group quarters in Screven County, Georgia in 2000:
- 158 people in local jails and other confinement facilities (including police lockups)
- 149 people in other noninstitutional group quarters
- 2 people in homes for the physically handicapped
6.85% of this county's 2021 resident taxpayers lived in other counties in 2020 ($44,522 average adjusted gross income)
| Here: | 6.85% |
| Georgia average: | 10.21% |
10 or fewer of this county's residents moved from foreign countries.
5.53% relocated from other counties in Georgia ($35,291 average AGI)
1.32% relocated from other states ($9,231 average AGI)
Screven County: 1.32% Georgia average: 3.80%

Top counties from which taxpayers relocated into this county between 2020 and 2021:
| from Bulloch County, GA | |
| from Effingham County, GA | |
| from Chatham County, GA |
5.50% of this county's 2020 resident taxpayers moved to other counties in 2021 ($39,688 average adjusted gross income)
| Here: | 5.50% |
| Georgia average: | 9.60% |
10 or fewer of this county's residents moved to foreign countries.
4.58% relocated to other counties in Georgia ($34,952 average AGI)
0.92% relocated to other states ($4,732 average AGI)
Screven County: 0.92% Georgia average: 3.15%

Top counties to which taxpayers relocated from this county between 2020 and 2021:
| to Bulloch County, GA | |
| to Effingham County, GA |
Births per 1000 population from 1990 to 1999: 15.0
Births per 1000 population from 2000 to 2006: 12.7

Deaths per 1000 population from 1990 to 1999: 11.4
Deaths per 1000 population from 2000 to 2009: 11.1
Deaths per 1000 population from 2010 to 2020: 12.3

Infant deaths per 1000 live births from 1990 to 1999: 11.5
Infant deaths per 1000 live births from 2000 to 2006: 14.6

Persons under 19 years old without health insurance coverage in 2018: 7.6%


Persons enrolled in hospital insurance and/or supplemental medical insurance (Medicare) in July 1, 2007: 2,583 (2,033 aged, 550 disabled)
Children under 18 without health insurance coverage in 2007: 354 (9%)


Most common underlying causes of death in Screven County, Georgia in 1999 - 2019:
- Bronchus or lung, unspecified - Malignant neoplasms (163)
- Stroke, not specified as haemorrhage or infarction (161)
- Acute myocardial infarction, unspecified (128)
- Atherosclerotic heart disease (102)
- Alzheimer disease, unspecified (40)
- Generalized and unspecified atherosclerosis (34)
- Chronic obstructive pulmonary disease, unspecified (12)
Population without health insurance coverage in 2000: 18%
Children under 18 without health insurance coverage in 2000: 15%
Short term general hospital admissions per 100,000 population in 2004: 4,173
Short term general hospital beds per 100,000 population in 2004: 163
Emergency room visits per 100,000 population in 2004: 28,123
General practice office based MDs per 100,000 population in 2005: 1,296
Medical specialist MDs per 100,000 population in 2005: 1,141
Dentists per 100,000 population in 1998: 6
Total births per 100,000 population, July 2005 - July 2006 : 28
Total deaths per 100,000 population, July 2005 - July 2006: 45
Limited-service eating places per 100,000 population in 2005 : 6
EPA green book nonattainment status in 2004-2006: 1
Crimes per 100,000 population in 1996: 1
Household type by relationship:
Households: 14,275- Male householders: 2,156 (693 living alone), Female householders: 2,750 (753 living alone)
2,354 spouses (2,339 opposite-sex spouses), 170 unmarried partners, (165 opposite-sex unmarried partners), 4,684 children (4,339 natural, 87 adopted, 257 stepchildren), 751 grandchildren, 154 brothers or sisters, 22 parents, 66 foster children, 448 other relatives, 354 non-relatives
- In group quarters: 359
Size of family households: 1,706 2-persons, 783 3-persons, 473 4-persons, 190 5-persons, 120 6-persons, 36 7-or-more-persons.
Size of nonfamily households: 1,450 1-person, 99 2-persons, 11 3-persons, 17 5-persons.
1,125 married couples with children.
863 single-parent households (64 men, 799 women).
96.6% of residents of Screven speak English at home.
2.1% of residents speak Spanish at home (45% speak English very well, 54% speak English well, 2% speak English not well).
0.5% of residents speak other Indo-European language at home (100% speak English very well).
0.4% of residents speak Asian or Pacific Island language at home (39% speak English very well, 61% don't speak English at all).
0.1% of residents speak other language at home (100% speak English very well).
In fiscal year 2004:
Federal Government expenditure: $97,557,000 ($6,361 per capita)
Department of Defense expenditure: $1,477,000
Federal direct payments to individuals for retirement and disability: $35,755,000
Federal other direct payments to individuals: $21,853,000
Federal direct payments not to individuals: $5,528,000
Federal grants: $31,569,000
Federal procurement contracts: $563,000 ($0,000 Department of Defense)
Federal salaries and wages: $2,289,000 ($0,000 Department of Defense)
Federal Government direct loans: $490,000
Federal guaranteed/insured loans: $3,948,000
Federal Government insurance: $10,724,000
Population change from April 1, 2000 to July 1, 2005:
Births: 1,073| Here: | 70 per 1000 residents |
| State: | 79 per 1000 residents |
Deaths: 884
| Here: | 57 per 1000 residents |
| State: | 38 per 1000 residents |
Net international migration: +40
| Here: | +3 per 1000 residents |
| State: | +21 per 1000 residents |
Net internal migration: -158
| Here: | |
| State: |

Total withdrawal of fresh water for public supply: 1.15 millions of gallons per day (all from ground)
| Here: | 6.3 |
| State: | 6.8 |
| Here: | 4.9 |
| State: | 4.6 |

- Year house built in Screven County, Georgia
- 312020 or later
- 2152010 to 2019
- 7992000 to 2009
- 1,1261990 to 1999
- 1,3451980 to 1989
- 8851970 to 1979
- 5671960 to 1969
- 3551950 to 1959
- 3721940 to 1949
- 6901939 or earlier

- Rooms in owner-occupied houses in Screven County, Georgia
- 41 room
- 142 rooms
- 243 rooms
- 4294 rooms
- 6325 rooms
- 9836 rooms
- 5017 rooms
- 6038 rooms
- 4939+ rooms

- Rooms in renter-occupied apartments in Screven County, Georgia
- 491 room
- 02 rooms
- 593 rooms
- 4164 rooms
- 2105 rooms
- 2646 rooms
- 1057 rooms
- 428 rooms
- 769+ rooms

- Bedrooms in owner-occupied houses in Screven County, Georgia
- 4no bedroom
- 621 bedroom
- 4942 bedrooms
- 2,2223 bedrooms
- 7314 bedrooms
- 1385+ bedrooms

- Bedrooms in renter-occupied apartments in Screven County, Georgia
- 50no bedroom
- 1171 bedroom
- 5042 bedrooms
- 4983 bedrooms
- 684 bedrooms
- 45+ bedrooms

- Cars and other vehicles available in Screven County in owner-occupied houses/condos
- 166no vehicle
- 7021 vehicle
- 1,4992 vehicles
- 7483 vehicles
- 4584 vehicles
- 1015+ vehicles

- Cars and other vehicles available in Screven County in renter-occupied apartments
- 92no vehicle
- 5841 vehicle
- 4522 vehicles
- 1093 vehicles
- 24 vehicles
- 05+ vehicles
88.0% of Screven County residents lived in the same house 1 years ago.
Out of people who lived in different houses, 30% lived in this county.
Out of people who lived in different counties, 68% lived in Georgia.
| Screven County: | 88.0% |
| State average: | 86.6% |
Place of birth for U.S.-born residents:
- This state: 10,906
- Other state: 2,961
- Northeast: 556
- Midwest: 577
- South: 1,567
- West: 259


- 87.1%Electricity
- 6.7%Bottled, tank, or LP gas
- 4.2%Utility gas
- 1.3%Wood
- 0.5%Fuel oil, kerosene, etc.
- 0.2%No fuel used

- 85.0%Electricity
- 8.2%Utility gas
- 4.7%Bottled, tank, or LP gas
- 1.1%Other fuel
- 0.7%No fuel used
- 0.2%Wood
Private vs. public school enrollment:
| Here: | 19.0% |
| Georgia: | 12.1% |
| Here: | 13.3% |
| Georgia: | 10.8% |
| Here: | 20.1% |
| Georgia: | 17.1% |


Screven County government finances - Expenditure in 2017:
- Charges - Other: $2,378,000
Parks and Recreation: $155,000
- Construction - Regular Highways: $1,158,000
General - Other: $136,000
Local Fire Protection: $31,000
General Public Buildings: $2,000
Sewerage: $1,000
- Current Operations - Correctional Institutions: $2,205,000
Regular Highways: $1,248,000
Health - Other: $1,079,000
Judicial and Legal Services: $933,000
Sewerage: $887,000
General - Other: $788,000
Local Fire Protection: $718,000
Central Staff Services: $603,000
Police Protection: $581,000
Financial Administration: $557,000
Parks and Recreation: $486,000
General Public Buildings: $221,000
Libraries: $183,000
Natural Resources - Other: $128,000
- Federal Intergovernmental - General Local Government Support: $9,000
- General - Interest on Debt: $34,000
- Intergovernmental to Local - Other - Hospitals: $445,000
Other - General - Other: $199,000
Other - Health - Other: $63,000
Other - Public Welfare - Other: $9,000
- Local Intergovernmental - Other: $472,000
- Long Term Debt - Beginning Outstanding - Unspecified Public Purpose: $650,000
Outstanding Unspecified Public Purpose: $450,000
Retired Unspecified Public Purpose: $200,000
- Miscellaneous - General Revenue - Other: $447,000
Fines and Forfeits: $345,000
Rents: $49,000
Interest Earnings: $9,000
Sale of Property: $2,000
- Other Capital Outlay - Police Protection: $60,000
Local Fire Protection: $33,000
General - Other: $26,000
General Public Building: $8,000
Health - Other: $4,000
Correctional Institutions: $3,000
- Other Funds - Cash and Securities: $6,665,000
- State Intergovernmental - Other: $1,399,000
General Local Government Support: $16,000
- Tax - Property: $5,507,000
General Sales and Gross Receipts: $2,059,000
Insurance Premiums Sales: $613,000
Public Utilities Sales: $167,000
Other License: $44,000
Other: $33,000
Alcoholic Beverage Sales: $26,000
Occupation and Business License - Other: $13,000
Alcoholic Beverage License: $6,000
Other Selective Sales: $5,000
- Total Salaries and Wages: $114,000
Screven County government finances - Revenue in 2017:
- Charges - Other: $2,378,000
Parks and Recreation: $155,000
- Construction - Regular Highways: $1,158,000
General - Other: $136,000
Local Fire Protection: $31,000
General Public Buildings: $2,000
Sewerage: $1,000
- Current Operations - Correctional Institutions: $2,205,000
Regular Highways: $1,248,000
Health - Other: $1,079,000
Judicial and Legal Services: $933,000
Sewerage: $887,000
General - Other: $788,000
Local Fire Protection: $718,000
Central Staff Services: $603,000
Police Protection: $581,000
Financial Administration: $557,000
Parks and Recreation: $486,000
General Public Buildings: $221,000
Libraries: $183,000
Natural Resources - Other: $128,000
- Federal Intergovernmental - General Local Government Support: $9,000
- General - Interest on Debt: $34,000
- Intergovernmental to Local - Other - Hospitals: $445,000
Other - General - Other: $199,000
Other - Health - Other: $63,000
Other - Public Welfare - Other: $9,000
- Local Intergovernmental - Other: $472,000
- Long Term Debt - Beginning Outstanding - Unspecified Public Purpose: $650,000
Outstanding Unspecified Public Purpose: $450,000
Retired Unspecified Public Purpose: $200,000
- Miscellaneous - General Revenue - Other: $447,000
Fines and Forfeits: $345,000
Rents: $49,000
Interest Earnings: $9,000
Sale of Property: $2,000
- Other Capital Outlay - Police Protection: $60,000
Local Fire Protection: $33,000
General - Other: $26,000
General Public Building: $8,000
Health - Other: $4,000
Correctional Institutions: $3,000
- Other Funds - Cash and Securities: $6,665,000
- State Intergovernmental - Other: $1,399,000
General Local Government Support: $16,000
- Tax - Property: $5,507,000
General Sales and Gross Receipts: $2,059,000
Insurance Premiums Sales: $613,000
Public Utilities Sales: $167,000
Other License: $44,000
Other: $33,000
Alcoholic Beverage Sales: $26,000
Occupation and Business License - Other: $13,000
Alcoholic Beverage License: $6,000
Other Selective Sales: $5,000
- Total Salaries and Wages: $114,000
Screven County government finances - Debt in 2017:
- Charges - Other: $2,378,000
Parks and Recreation: $155,000
- Construction - Regular Highways: $1,158,000
General - Other: $136,000
Local Fire Protection: $31,000
General Public Buildings: $2,000
Sewerage: $1,000
- Current Operations - Correctional Institutions: $2,205,000
Regular Highways: $1,248,000
Health - Other: $1,079,000
Judicial and Legal Services: $933,000
Sewerage: $887,000
General - Other: $788,000
Local Fire Protection: $718,000
Central Staff Services: $603,000
Police Protection: $581,000
Financial Administration: $557,000
Parks and Recreation: $486,000
General Public Buildings: $221,000
Libraries: $183,000
Natural Resources - Other: $128,000
- Federal Intergovernmental - General Local Government Support: $9,000
- General - Interest on Debt: $34,000
- Intergovernmental to Local - Other - Hospitals: $445,000
Other - General - Other: $199,000
Other - Health - Other: $63,000
Other - Public Welfare - Other: $9,000
- Local Intergovernmental - Other: $472,000
- Long Term Debt - Beginning Outstanding - Unspecified Public Purpose: $650,000
Outstanding Unspecified Public Purpose: $450,000
Retired Unspecified Public Purpose: $200,000
- Miscellaneous - General Revenue - Other: $447,000
Fines and Forfeits: $345,000
Rents: $49,000
Interest Earnings: $9,000
Sale of Property: $2,000
- Other Capital Outlay - Police Protection: $60,000
Local Fire Protection: $33,000
General - Other: $26,000
General Public Building: $8,000
Health - Other: $4,000
Correctional Institutions: $3,000
- Other Funds - Cash and Securities: $6,665,000
- State Intergovernmental - Other: $1,399,000
General Local Government Support: $16,000
- Tax - Property: $5,507,000
General Sales and Gross Receipts: $2,059,000
Insurance Premiums Sales: $613,000
Public Utilities Sales: $167,000
Other License: $44,000
Other: $33,000
Alcoholic Beverage Sales: $26,000
Occupation and Business License - Other: $13,000
Alcoholic Beverage License: $6,000
Other Selective Sales: $5,000
- Total Salaries and Wages: $114,000
Screven County government finances - Cash and Securities in 2017:
- Charges - Other: $2,378,000
Parks and Recreation: $155,000
- Construction - Regular Highways: $1,158,000
General - Other: $136,000
Local Fire Protection: $31,000
General Public Buildings: $2,000
Sewerage: $1,000
- Current Operations - Correctional Institutions: $2,205,000
Regular Highways: $1,248,000
Health - Other: $1,079,000
Judicial and Legal Services: $933,000
Sewerage: $887,000
General - Other: $788,000
Local Fire Protection: $718,000
Central Staff Services: $603,000
Police Protection: $581,000
Financial Administration: $557,000
Parks and Recreation: $486,000
General Public Buildings: $221,000
Libraries: $183,000
Natural Resources - Other: $128,000
- Federal Intergovernmental - General Local Government Support: $9,000
- General - Interest on Debt: $34,000
- Intergovernmental to Local - Other - Hospitals: $445,000
Other - General - Other: $199,000
Other - Health - Other: $63,000
Other - Public Welfare - Other: $9,000
- Local Intergovernmental - Other: $472,000
- Long Term Debt - Beginning Outstanding - Unspecified Public Purpose: $650,000
Outstanding Unspecified Public Purpose: $450,000
Retired Unspecified Public Purpose: $200,000
- Miscellaneous - General Revenue - Other: $447,000
Fines and Forfeits: $345,000
Rents: $49,000
Interest Earnings: $9,000
Sale of Property: $2,000
- Other Capital Outlay - Police Protection: $60,000
Local Fire Protection: $33,000
General - Other: $26,000
General Public Building: $8,000
Health - Other: $4,000
Correctional Institutions: $3,000
- Other Funds - Cash and Securities: $6,665,000
- State Intergovernmental - Other: $1,399,000
General Local Government Support: $16,000
- Tax - Property: $5,507,000
General Sales and Gross Receipts: $2,059,000
Insurance Premiums Sales: $613,000
Public Utilities Sales: $167,000
Other License: $44,000
Other: $33,000
Alcoholic Beverage Sales: $26,000
Occupation and Business License - Other: $13,000
Alcoholic Beverage License: $6,000
Other Selective Sales: $5,000
- Total Salaries and Wages: $114,000
Supplemental Security Income (SSI) in 2006:
- Total number of recipients: 755
- Number of aged recipients: 124
- Number of blind and disabled recipients: 631
- Number of recipients under 18: 116
- Number of recipients between 18 and 64: 412
- Number of recipients older than 64: 227
- Number of recipients also receiving OASDI: 331
- Amount of payments (thousands of dollars): 297
| Most common first names in Screven County, GA among deceased individuals | ||
| Name | Count | Lived (average) |
|---|---|---|
| James | 143 | 69.2 years |
| John | 114 | 69.3 years |
| Mary | 107 | 75.8 years |
| William | 103 | 71.6 years |
| Willie | 85 | 73.7 years |
| Robert | 72 | 69.9 years |
| George | 62 | 75.2 years |
| Annie | 58 | 80.8 years |
| Henry | 46 | 74.9 years |
| Thomas | 45 | 72.6 years |
| Most common last names in Screven County, GA among deceased individuals | ||
| Last name | Count | Lived (average) |
|---|---|---|
| Williams | 129 | 73.2 years |
| Scott | 83 | 77.2 years |
| Roberts | 74 | 73.5 years |
| Smith | 71 | 72.3 years |
| Johnson | 69 | 70.5 years |
| Waters | 63 | 77.1 years |
| Jenkins | 61 | 74.8 years |
| Bragg | 61 | 69.9 years |
| Lee | 58 | 77.2 years |
| Thompson | 55 | 75.4 years |
| Businesses in Screven County, GA | ||||
| Name | Count | Name | Count | |
|---|---|---|---|---|
| Ace Hardware | 1 | Pizza Hut | 1 | |
| Advance Auto Parts | 1 | RadioShack | 1 | |
| FedEx | 1 | Rite Aid | 1 | |
| Ford | 1 | Subway | 2 | |
| GNC | 1 | U-Haul | 1 | |
| H&R Block | 1 | UPS | 1 | |
| McDonald's | 1 | |||