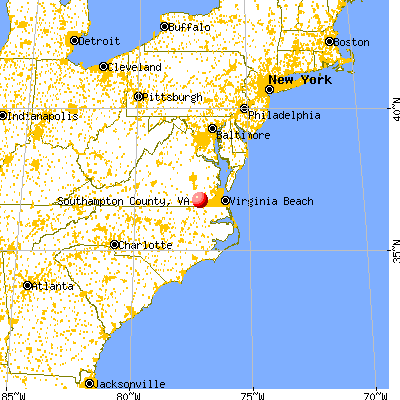
Southampton County, Virginia (VA)
County owner-occupied free and clear houses and condos in 2010: 1,767
County owner-occupied houses and condos in 2000: 4,665
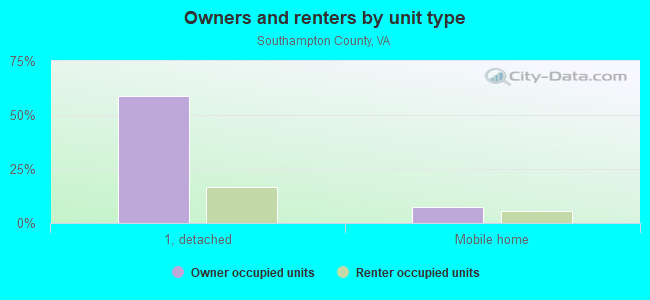
Renter-occupied apartments: 1,686 (it was 1,614 in 2000)
| % of renters here: | 26% |
| State: | 33% |
Land area: 600 sq. mi.
Water area: 2.8 sq. mi.
Population density: 30 people per square mile (low).
Industries providing employment: Educational, health and social services (25.9%), Retail trade (11.2%), Professional, scientific, management, administrative, and waste management services (11.2%), Public administration (11.1%).
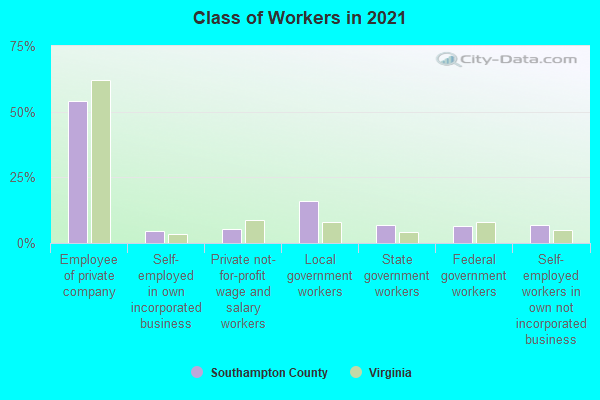
Type of workers:
- Private wage or salary: 66%
- Government: 27%
- Self-employed, not incorporated: 6%
- Unpaid family work: 0%
- OSM Map
- General Map
- Google Map
- MSN Map

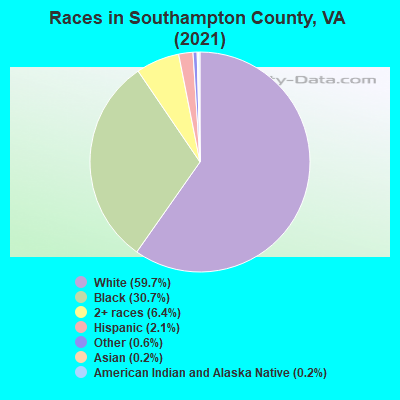
- 10,81159.8%White Non-Hispanic Alone
- 5,37429.7%Black Non-Hispanic Alone
- 1,2136.7%Two or more races
- 4132.3%Hispanic or Latino
- 1510.8%Some other race alone
- 600.3%Asian alone
- 540.3%American Indian and Alaska Native alone
| Median resident age: | 47.4 years |
| Virginia median age: | 39.0 years |
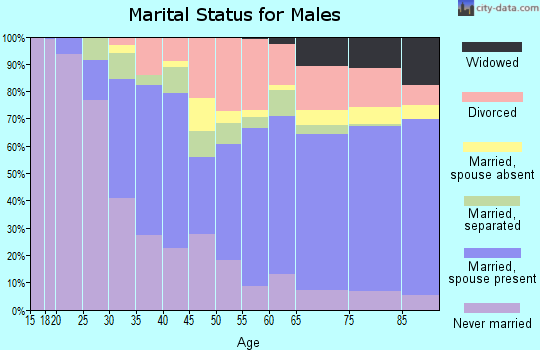
| Males: 9,517 | |
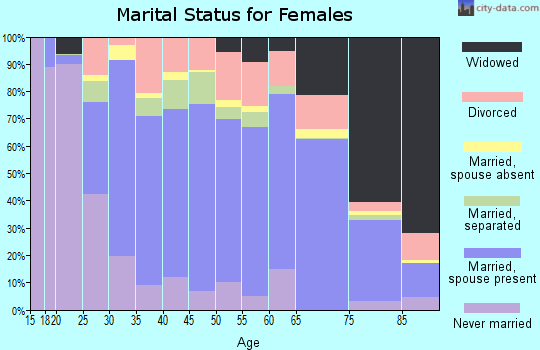
| Females: 8,609 |


| Southampton County: | 2.0 people |
| Virginia: | 3 people |
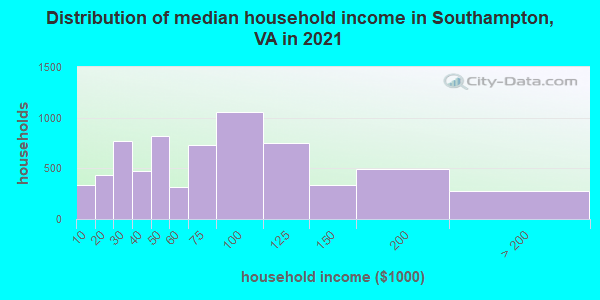
Estimated median household income in 2022: $66,743 ($33,995 in 1999)
| This county: | $66,743 |
| Virginia: | $85,873 |
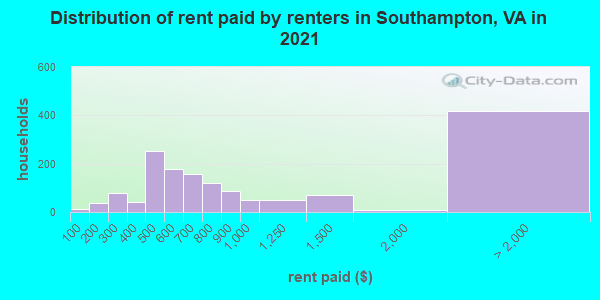
Median contract rent in 2022 for apartments: $631 (lower quartile is $483, upper quartile is $810)
| This county: | $631 |
| State: | $1270 |
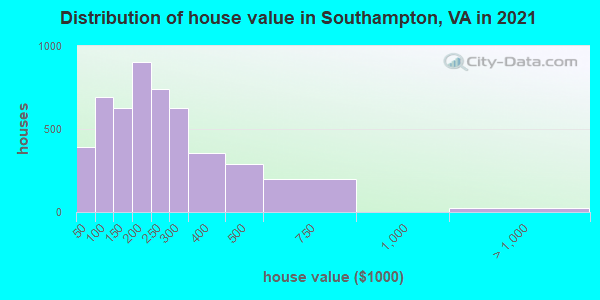
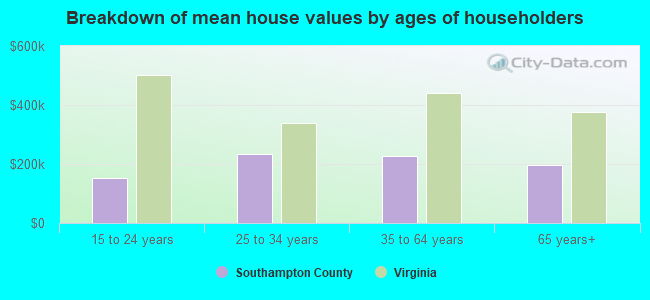
Estimated median house or condo value in 2022: $214,921 (it was $79,500 in 2000)
| Southampton: | $214,921 |
| Virginia: | $365,700 |
Mean price in 2022:
Median monthly housing costs for homes and condos with a mortgage: $1,358Detached houses: $261,758
Here: $261,758 State: $472,865 Townhouses or other attached units: $493,705
Here: $493,705 State: $457,437 Mobile homes: $78,747
Here: $78,747 State: $100,736
Median monthly housing costs for units without a mortgage: $435
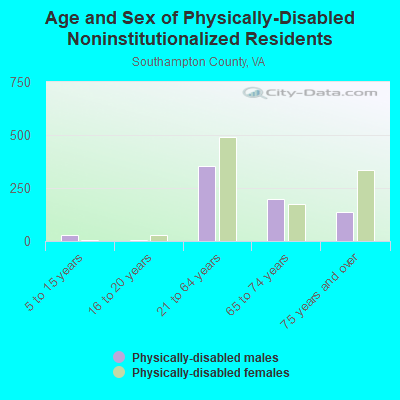
Institutionalized population: 1,554
Crime in 2021 (reported by the sheriff's office or county police, not the county total):
- Murders: 0
- Rapes: 9
- Robberies: 0
- Assaults: 0
- Burglaries: 18
- Thefts: 100
- Auto thefts: 18
Crime in 2020 (reported by the sheriff's office or county police, not the county total):
- Murders: 0
- Rapes: 3
- Robberies: 2
- Assaults: 13
- Burglaries: 28
- Thefts: 126
- Auto thefts: 24
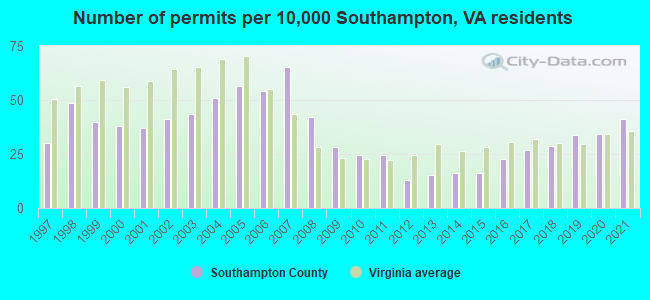
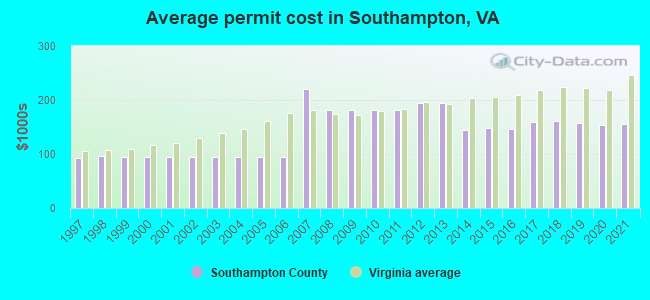
Single-family new house construction building permits:
- 2022: 64 buildings, average cost: $154,400
- 2021: 72 buildings, average cost: $154,800
- 2020: 60 buildings, average cost: $153,400
- 2019: 59 buildings, average cost: $158,400
- 2018: 50 buildings, average cost: $161,300
- 2017: 47 buildings, average cost: $158,500
- 2016: 40 buildings, average cost: $147,300
- 2015: 28 buildings, average cost: $148,400
- 2014: 28 buildings, average cost: $145,200
- 2013: 27 buildings, average cost: $195,200
- 2012: 23 buildings, average cost: $195,200
- 2011: 43 buildings, average cost: $180,500
- 2010: 43 buildings, average cost: $180,500
- 2009: 49 buildings, average cost: $180,500
- 2008: 74 buildings, average cost: $180,500
- 2007: 114 buildings, average cost: $219,600
- 2006: 95 buildings, average cost: $94,400
- 2005: 99 buildings, average cost: $94,400
- 2004: 89 buildings, average cost: $94,400
- 2003: 76 buildings, average cost: $94,400
- 2002: 72 buildings, average cost: $94,300
- 2001: 65 buildings, average cost: $94,400
- 2000: 66 buildings, average cost: $94,200
- 1999: 70 buildings, average cost: $95,000
- 1998: 85 buildings, average cost: $95,700
- 1997: 53 buildings, average cost: $92,700
Median real estate property taxes paid for housing units with mortgages in 2022: $1,477 (0.7%)
Median real estate property taxes paid for housing units with no mortgage in 2022: $1,252 (0.6%)
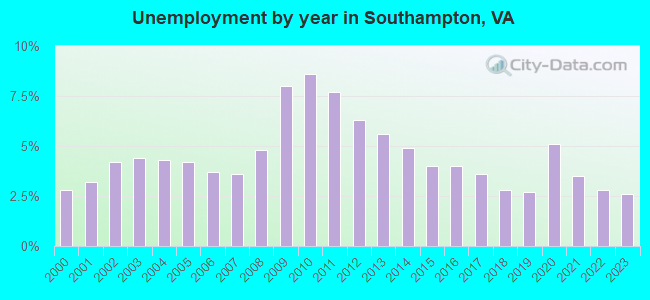
| Southampton County: | 8.8% |
| Virginia: | 10.6% |
Median age of residents in 2022: 47.4 years old
(Males: 47.6 years old, Females: 47.0 years old)
(Median age for: White residents: 47.7 years old, Black residents: 50.0 years old, American Indian residents: 56.9 years old, Asian residents: 50.9 years old, Hispanic or Latino residents: 17.8 years old, Other race residents: 26.3 years old)
Fair market rent in 2006 for a 1-bedroom apartment in Southampton County is $483 a month.
Fair market rent for a 2-bedroom apartment is $535 a month.
Fair market rent for a 3-bedroom apartment is $662 a month.
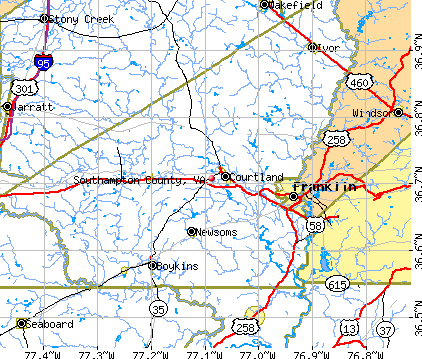
Cities in this county include: Courtland, Boykins, Southampton Meadows, Sedley, Ivor, Newsoms, Capron, Branchville.
Neighboring counties: Colfax County, New Mexico  , Mohave County, Arizona , Sandoval County, New Mexico , Craig County
  , Franklin County, North Carolina
  , Pratt County, Kansas .
| Here: | 2.4% |
| Virginia: | 2.7% |
Current college students: 565
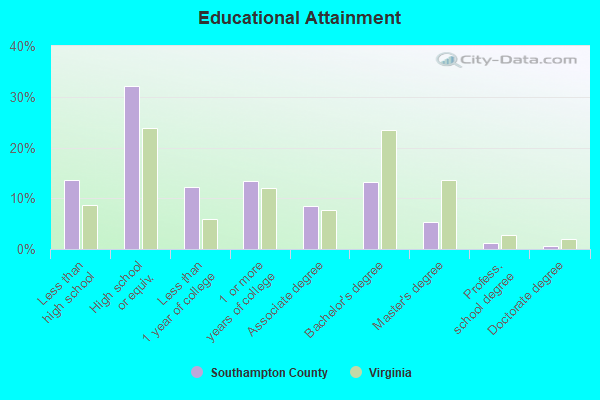
People 25 years of age or older with a high school degree or higher: 86.8%
People 25 years of age or older with a bachelor's degree or higher: 19.0%
Number of foreign born residents: 203 (100.6% naturalized citizens)
| Southampton County: | 1.1% |
| Whole state: | 12.7% |
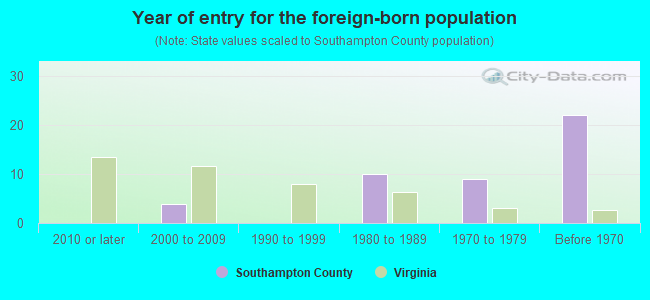
- Year of entry for the foreign-born population
- 02010 or later
- 622000 to 2009
- 01990 to 1999
- 101980 to 1989
- 91970 to 1979
- 22Before 1970
Mean travel time to work (commute): minutes
Percentage of county residents living and working in this county: 99.6%
Housing units in structures:
- One, detached: 6,313
- One, attached: 15
- Two: 76
- 3 or 4: 42
- 5 to 9: 168
- 10 to 19: 12
- Mobile homes: 1,187
Housing units in Southampton County with a mortgage: 3,038 (196 second mortgage, 0 home equity loan, 127 both second mortgage and home equity loan)
Houses without a mortgage: 144
| Here: | 2.0% with mortgage |
| State: | 97.2% with mortgage |
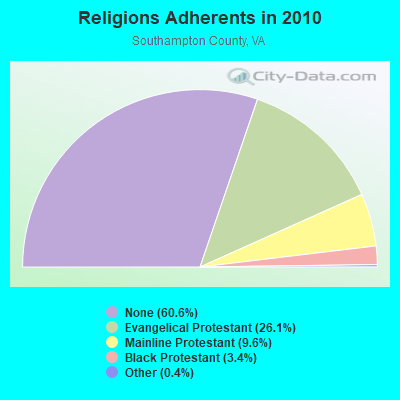
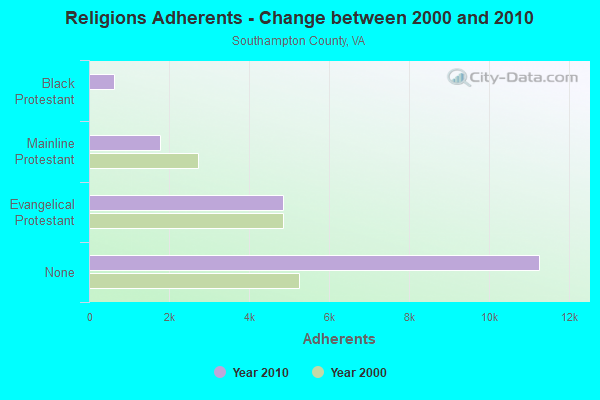
Religion statistics for Southampton County
| Religion | Adherents | Congregations |
|---|---|---|
| Evangelical Protestant | 4,840 | 16 |
| Mainline Protestant | 1,784 | 17 |
| Black Protestant | 623 | 7 |
| Other | 65 | - |
| None | 11,258 | - |
Source: Clifford Grammich, Kirk Hadaway, Richard Houseal, Dale E.Jones, Alexei Krindatch, Richie Stanley and Richard H.Taylor. 2012. 2010 U.S.Religion Census: Religious Congregations & Membership Study. Association of Statisticians of American Religious Bodies. Jones, Dale E., et al. 2002. Congregations and Membership in the United States 2000. Nashville, TN: Glenmary Research Center.
Food Environment Statistics:
| Southampton County: | 1.63 / 10,000 pop. |
| State: | 2.03 / 10,000 pop. |
| This county: | 2.17 / 10,000 pop. |
| Virginia: | 1.43 / 10,000 pop. |
| Southampton County: | 5.42 / 10,000 pop. |
| Virginia: | 4.03 / 10,000 pop. |
| This county: | 2.17 / 10,000 pop. |
| State: | 7.65 / 10,000 pop. |
| Southampton County: | 11.1% |
| Virginia: | 9.3% |
| Southampton County: | 29.6% |
| State: | 26.7% |
| Here: | 19.9% |
| State: | 18.6% |
Agriculture in Southampton County:
Average size of farms: 613 acresAverage value of agricultural products sold per farm: $127,279
Average value of crops sold per acre for harvested cropland: $262.58
The value of livestock, poultry, and their products as a percentage of the total market value of agricultural products sold: 37.40%
Average total farm production expenses per farm: $135,858
Harvested cropland as a percentage of land in farms: 49.46%
Irrigated harvested cropland as a percentage of land in farms: 2.78%
Average market value of all machinery and equipment per farm: $133,200
The percentage of farms operated by a family or individual: 82.55%
Average age of principal farm operators: 51 years
Average number of cattle and calves per 100 acres of all land in farms: 2.75
Milk cows as a percentage of all cattle and calves: 0.65%
Corn for grain: 10974 harvested acres
All wheat for grain: 4158 harvested acres
Upland cotton: 31053 harvested acres
Soybeans for beans: 21019 harvested acres
Vegetables: 647 harvested acres
Land in orchards: 37 acres
Earthquake activity:
Southampton County-area historical earthquake activity is significantly above Virginia state average. It is 58% smaller than the overall U.S. average.On 8/23/2011 at 17:51:04, a magnitude 5.8 (5.8 MW, Depth: 3.7 mi, Class: Moderate, Intensity: VI - VII) earthquake occurred 95.4 miles away from Southampton County center
On 12/9/2003 at 20:59:14, a magnitude 4.5 (4.5 MB, 4.5 LG, Class: Light, Intensity: IV - V) earthquake occurred 75.6 miles away from the county center
On 12/9/2003 at 20:59:18, a magnitude 4.5 (4.5 ML, Depth: 6.2 mi) earthquake occurred 92.5 miles away from the county center
On 8/25/2011 at 05:07:52, a magnitude 4.5 (4.5 ML, Depth: 4.2 mi) earthquake occurred 98.5 miles away from the county center
On 8/9/2020 at 12:07:37, a magnitude 5.1 (5.1 MW, Depth: 4.7 mi) earthquake occurred 222.9 miles away from Southampton County center
On 8/24/2011 at 00:04:36, a magnitude 4.2 (4.2 ML) earthquake occurred 96.2 miles away from the county center
Magnitude types: regional Lg-wave magnitude (LG), body-wave magnitude (MB), local magnitude (ML), moment magnitude (MW)
Most recent natural disasters:
- Virginia Covid-19 Pandemic, Incident Period: January 20, 2020, Major Disaster (Presidential) Declared DR-4512-VA: April 2, 2020, FEMA Id: 4512, Natural disaster type: Other
- Virginia Hurricane Matthew, Incident Period: October 07, 2016 to October 15, 2016, Major Disaster (Presidential) Declared DR-4291: November 02, 2016, FEMA Id: 4291, Natural disaster type: Hurricane
- Virginia Hurricane Sandy, Incident Period: October 26, 2012 to November 01, 2012, Emergency Declared EM-3359: October 29, 2012, FEMA Id: 3359, Natural disaster type: Hurricane
- Virginia Hurricane Irene, Incident Period: August 26, 2011 to August 28, 2011, Major Disaster (Presidential) Declared DR-4024: September 03, 2011, FEMA Id: 4024, Natural disaster type: Hurricane
- Virginia Hurricane Katrina Evacuation, Incident Period: August 29, 2005 to October 01, 2005, Emergency Declared EM-3240: September 12, 2005, FEMA Id: 3240, Natural disaster type: Hurricane
- Virginia Hurricane Isabel, Incident Period: September 18, 2003 to October 01, 2003, Major Disaster (Presidential) Declared DR-1491: September 18, 2003, FEMA Id: 1491, Natural disaster type: Hurricane
- Virginia Winter Storm, Incident Period: January 25, 2000 to January 30, 2000, Major Disaster (Presidential) Declared DR-1318: February 28, 2000, FEMA Id: 1318, Natural disaster type: Winter Storm
- Virginia Hurricane Floyd, Incident Period: September 13, 1999 to September 26, 1999, Major Disaster (Presidential) Declared DR-1293: September 18, 1999, FEMA Id: 1293, Natural disaster type: Hurricane
- Virginia Blizzard, Incident Period: January 06, 1996 to January 12, 1996, Major Disaster (Presidential) Declared DR-1086: January 13, 1996, FEMA Id: 1086, Natural disaster type: Blizzard
- Virginia Severe Winter Storm, Incident Period: March 13, 1993 to March 14, 1993, Emergency Declared EM-3112: March 25, 1993, FEMA Id: 3112, Natural disaster type: Winter Storm
The number of natural disasters in Southampton County (10) is smaller than the US average (15).
Major Disasters (Presidential) Declared: 7
Emergencies Declared: 3
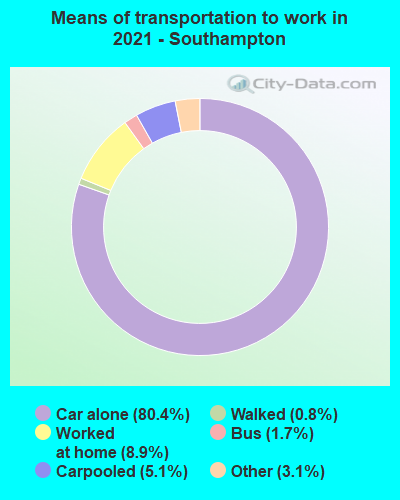
Means of transportation to work:
- Drove a car alone: 3,441 (75.1%)
- Carpooled: 304 (6.6%)
- Bus: 43 (0.9%)
- Taxicab, motorcycle, or other means: 142 (3.1%)
- Walked: 31 (0.7%)
- Worked at home: 562 (12.3%)
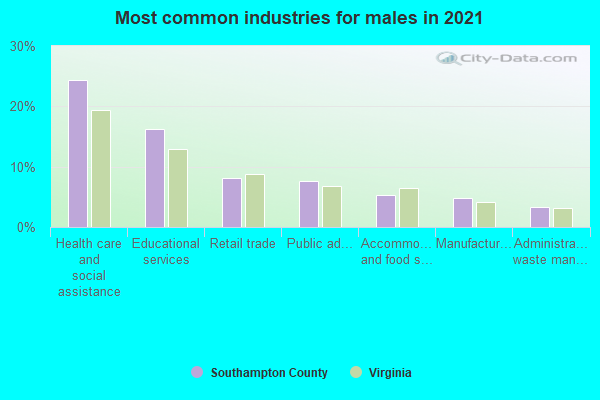
- Health care and social assistance (25%)
- Educational services (16%)
- Retail trade (12%)
- Public administration (9%)
- Accommodation and food services (7%)
- Manufacturing (4%)
- Administrative and support and waste management services (4%)
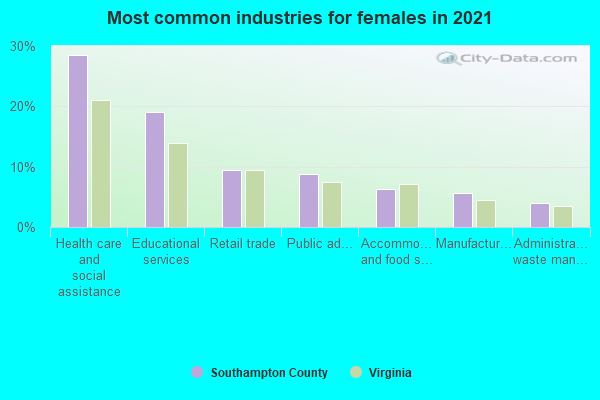
- Health care and social assistance (27%)
- Educational services (17%)
- Retail trade (13%)
- Public administration (10%)
- Accommodation and food services (7%)
- Manufacturing (4%)
- Administrative and support and waste management services (4%)
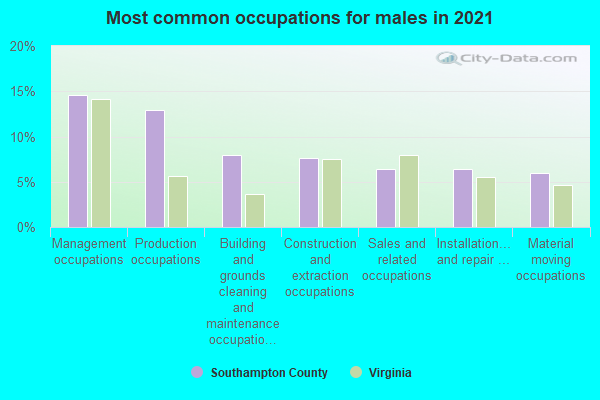
- Management occupations (14%)
- Production occupations (10%)
- Construction and extraction occupations (9%)
- Sales and related occupations (8%)
- Transportation occupations (7%)
- Computer and mathematical occupations (6%)
- Material moving occupations (6%)
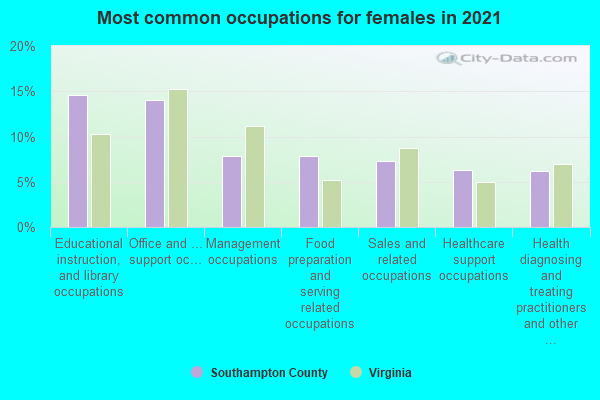
- Educational instruction, and library occupations (14%)
- Office and administrative support occupations (14%)
- Sales and related occupations (10%)
- Management occupations (9%)
- Food preparation and serving related occupations (8%)
- Health technologists and technicians (7%)
- Business and financial operations occupations (6%)
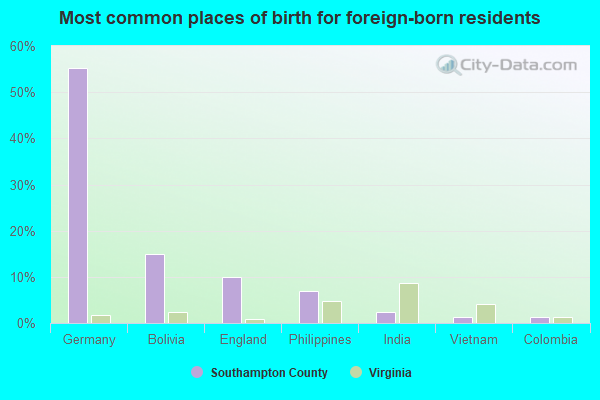
- Germany (37%)
- Peru (26%)
- England (8%)
- Philippines (7%)
- Pakistan (4%)
- India (2%)
- Other Eastern Europe (1%)
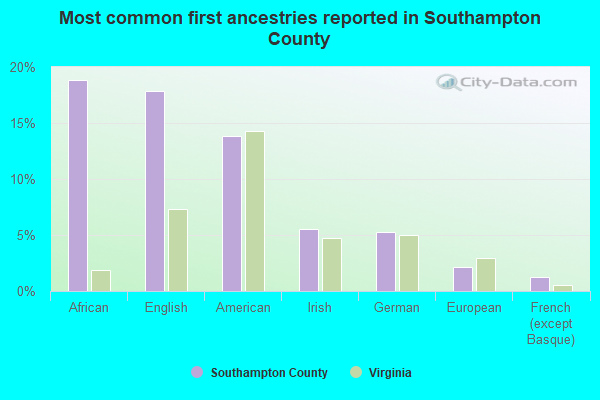
- African (19%)
- English (17%)
- American (11%)
- Irish (6%)
- German (4%)
- European (2%)
- Italian (1%)
People in group quarters in Southampton County, Virginia in 2010:
- 1,283 people in state prisons
- 100 people in correctional residential facilities
- 90 people in nursing facilities/skilled-nursing facilities
- 81 people in local jails and other municipal confinement facilities
- 13 people in residential treatment centers for adults
People in group quarters in Southampton County, Virginia in 2000:
- 1,374 people in state prisons
- 104 people in local jails and other confinement facilities (including police lockups)
- 87 people in nursing homes
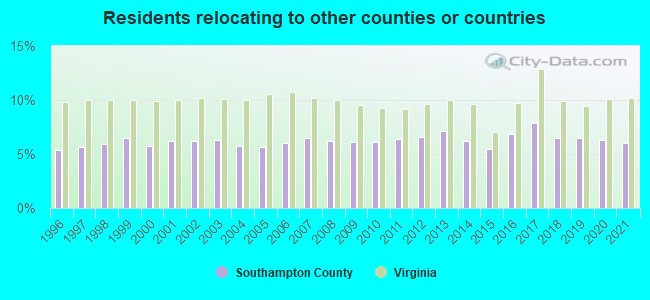
7.10% of this county's 2021 resident taxpayers lived in other counties in 2020 ($46,060 average adjusted gross income)
| Here: | 7.10% |
| Virginia average: | 10.16% |
10 or fewer of this county's residents moved from foreign countries.
6.00% relocated from other counties in Virginia ($40,342 average AGI)
1.10% relocated from other states ($5,716 average AGI)
Southampton County: 1.10% Virginia average: 3.91%

Top counties from which taxpayers relocated into this county between 2020 and 2021:
| from Franklin city, VA | |
| from Suffolk city, VA | |
| from Isle of Wight County, VA | |
| from Chesapeake city, VA | |
| from Virginia Beach city, VA |
6.05% of this county's 2020 resident taxpayers moved to other counties in 2021 ($45,620 average adjusted gross income)
| Here: | 6.05% |
| Virginia average: | 10.20% |
10 or fewer of this county's residents moved to foreign countries.
4.73% relocated to other counties in Virginia ($35,739 average AGI)
1.33% relocated to other states ($9,881 average AGI)
Southampton County: 1.33% Virginia average: 3.98%
Top counties to which taxpayers relocated from this county between 2020 and 2021:
| to Franklin city, VA | |
| to Suffolk city, VA | |
| to Isle of Wight County, VA | |
| to Chesapeake city, VA |
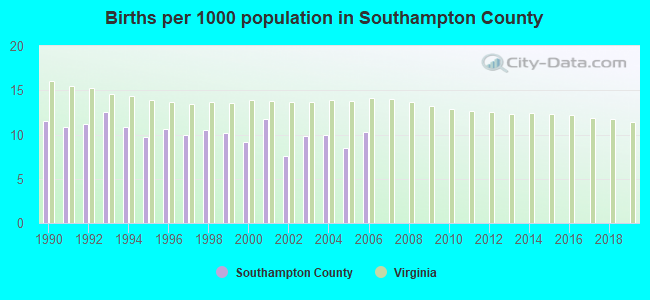
Births per 1000 population from 1990 to 1999: 10.8
Births per 1000 population from 2000 to 2006: 9.6
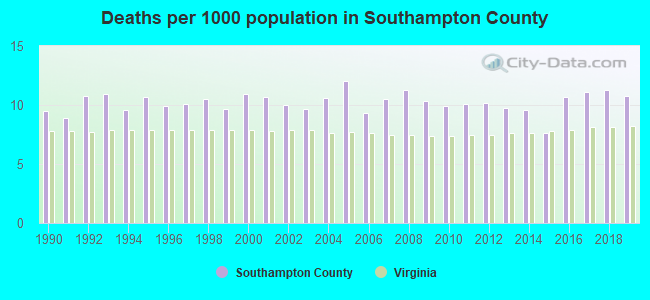
Deaths per 1000 population from 1990 to 1999: 10.1
Deaths per 1000 population from 2000 to 2009: 10.5
Deaths per 1000 population from 2010 to 2020: 10.3
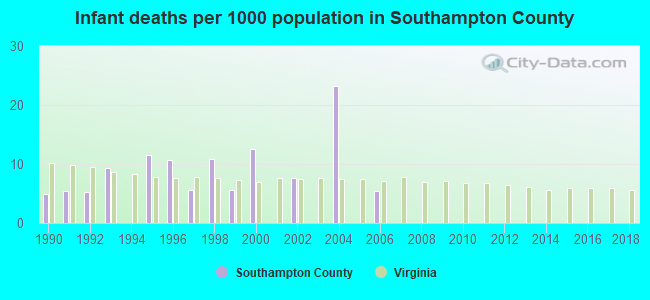
Infant deaths per 1000 live births from 1990 to 1999: 6.9
Infant deaths per 1000 live births from 2000 to 2006: 7.0
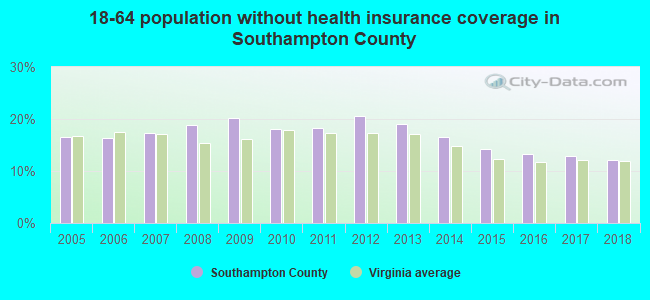
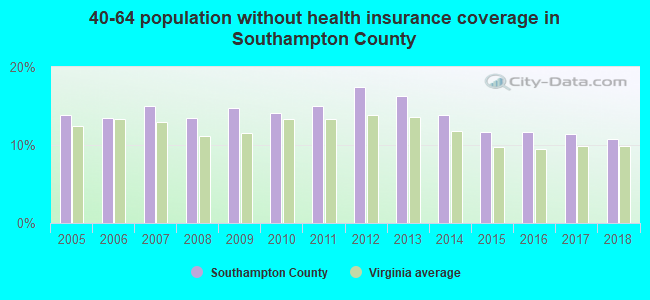
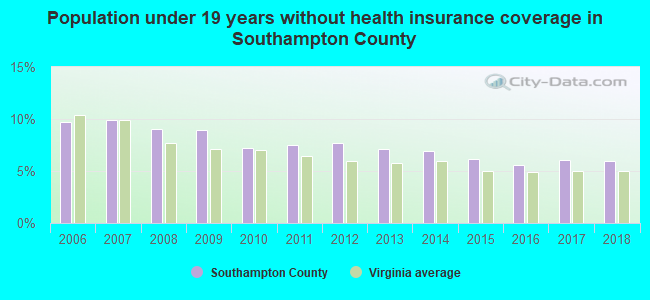
Persons under 19 years old without health insurance coverage in 2018: 6.0%
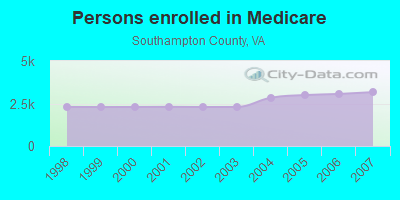
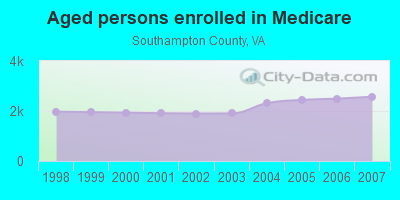
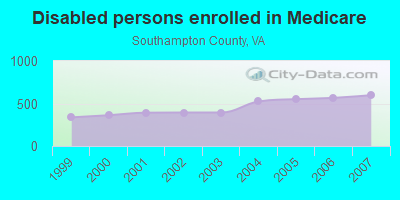
Persons enrolled in hospital insurance and/or supplemental medical insurance (Medicare) in July 1, 2007: 3,168 (2,570 aged, 598 disabled)
Children under 18 without health insurance coverage in 2007: 332 (9%)
Most common underlying causes of death in Southampton County, Virginia in 1999 - 2019:
- Acute myocardial infarction, unspecified (268)
- Bronchus or lung, unspecified - Malignant neoplasms (211)
- Atherosclerotic heart disease (131)
- Unspecified dementia (103)
- Stroke, not specified as haemorrhage or infarction (81)
- Chronic obstructive pulmonary disease, unspecified (42)
- Alzheimer disease, unspecified (11)
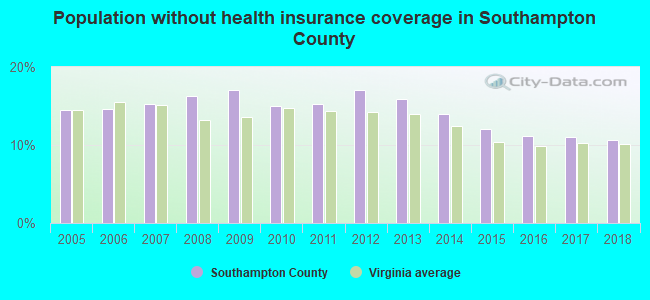
Population without health insurance coverage in 2000: 13%
Children under 18 without health insurance coverage in 2000: 9%
Medical specialist MDs per 100,000 population in 2005: 1,035
Dentists per 100,000 population in 1998: 6
Total births per 100,000 population, July 2005 - July 2006 : 11
Total deaths per 100,000 population, July 2005 - July 2006: 11
Crimes per 100,000 population in 1996: 1
Household type by relationship:
Households: 18,126- Male householders: 3,535 (1,072 living alone), Female householders: 3,494 (952 living alone)
3,135 spouses (3,125 opposite-sex spouses), 462 unmarried partners, (462 opposite-sex unmarried partners), 4,374 children (4,233 natural, 43 adopted, 104 stepchildren), 754 grandchildren, 239 brothers or sisters, 102 parents, 6 foster children, 431 other relatives, 219 non-relatives
- In group quarters: 1,343
Size of family households: 2,604 2-persons, 1,067 3-persons, 608 4-persons, 252 5-persons, 118 6-persons, 107 7-or-more-persons.
Size of nonfamily households: 2,024 1-person, 215 2-persons, 37 3-persons, 1 4-persons.
1,540 married couples with children.
919 single-parent households (175 men, 744 women).
97.2% of residents of Southampton speak English at home.
1.4% of residents speak Spanish at home (61% speak English very well, 33% speak English well, 6% speak English not well).
1.0% of residents speak other Indo-European language at home (100% speak English very well).
0.1% of residents speak Asian or Pacific Island language at home (100% speak English very well).
In fiscal year 2004:
Federal Government expenditure: $92,780,000 ($5,276 per capita)
Department of Defense expenditure: $2,298,000
Federal direct payments to individuals for retirement and disability: $37,453,000
Federal other direct payments to individuals: $20,835,000
Federal direct payments not to individuals: $9,736,000
Federal grants: $20,464,000
Federal procurement contracts: $1,608,000 ($116,000 Department of Defense)
Federal salaries and wages: $2,683,000 ($0,000 Department of Defense)
Federal Government direct loans: $1,247,000
Federal guaranteed/insured loans: $8,578,000
Federal Government insurance: $41,328,000
Population change from April 1, 2000 to July 1, 2005:
Births: 914| Here: | 52 per 1000 residents |
| State: | 70 per 1000 residents |
Deaths: 918
| Here: | 52 per 1000 residents |
| State: | 40 per 1000 residents |
Net international migration: +2
| Here: | +0 per 1000 residents |
| State: | +18 per 1000 residents |
Net internal migration: +157
| Here: | +9 per 1000 residents |
| State: | +14 per 1000 residents |
Total withdrawal of fresh water for public supply: 1.27 millions of gallons per day (39% from ground, 61% from surface)
| Here: | 6.5 |
| State: | 7.0 |
| Here: | 4.6 |
| State: | 4.3 |
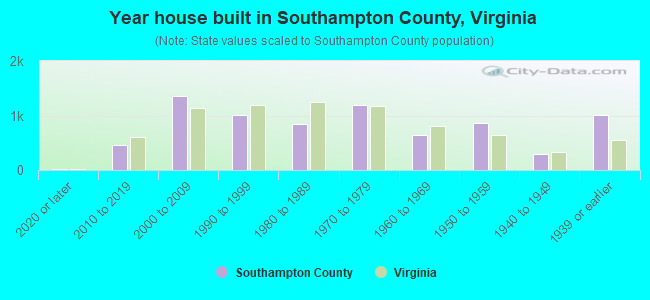
- Year house built in Southampton County, Virginia
- 502020 or later
- 5342010 to 2019
- 1,2262000 to 2009
- 1,1191990 to 1999
- 8331980 to 1989
- 1,0571970 to 1979
- 5591960 to 1969
- 9471950 to 1959
- 2761940 to 1949
- 1,1471939 or earlier
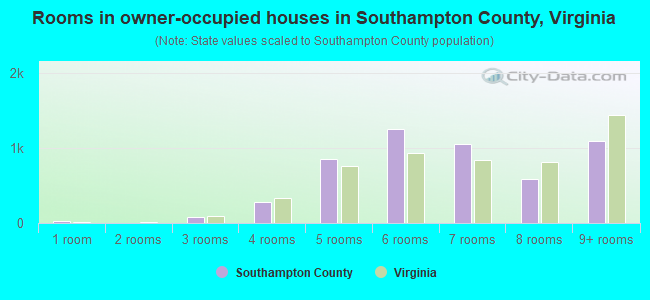
- Rooms in owner-occupied houses in Southampton County, Virginia
- 161 room
- 02 rooms
- 733 rooms
- 3044 rooms
- 9475 rooms
- 1,3776 rooms
- 1,0077 rooms
- 6178 rooms
- 1,0989+ rooms
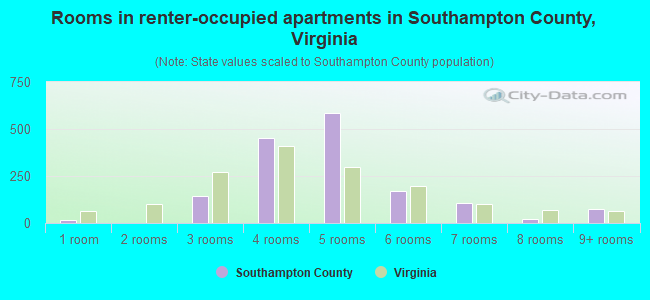
- Rooms in renter-occupied apartments in Southampton County, Virginia
- 101 room
- 32 rooms
- 933 rooms
- 5834 rooms
- 4845 rooms
- 1816 rooms
- 1187 rooms
- 118 rooms
- 869+ rooms
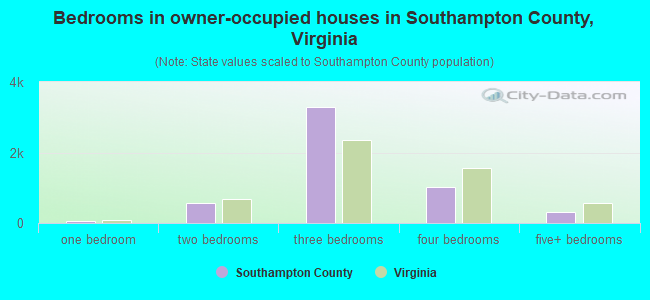
- Bedrooms in owner-occupied houses in Southampton County, Virginia
- 18no bedroom
- 501 bedroom
- 5692 bedrooms
- 3,4903 bedrooms
- 1,0084 bedrooms
- 3205+ bedrooms
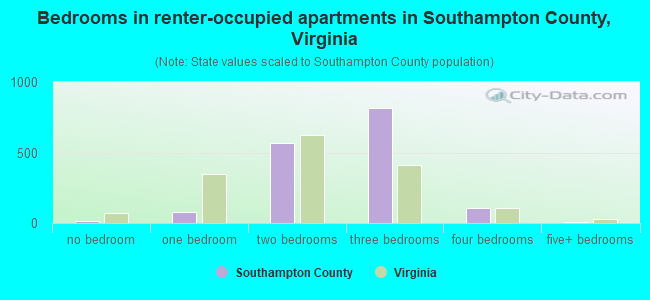
- Bedrooms in renter-occupied apartments in Southampton County, Virginia
- 10no bedroom
- 991 bedroom
- 6302 bedrooms
- 7293 bedrooms
- 964 bedrooms
- 75+ bedrooms
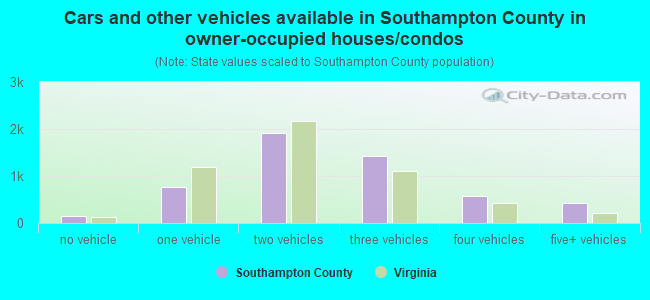
- Cars and other vehicles available in Southampton County in owner-occupied houses/condos
- 164no vehicle
- 9131 vehicle
- 2,0552 vehicles
- 1,4373 vehicles
- 4034 vehicles
- 4675+ vehicles
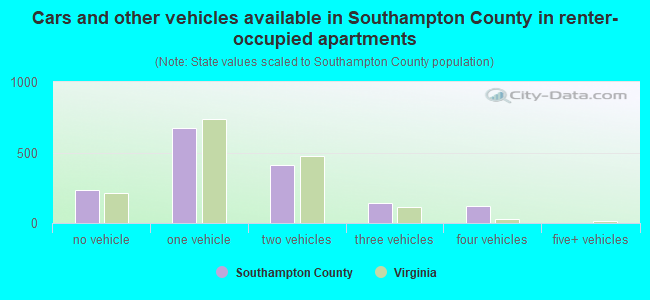
- Cars and other vehicles available in Southampton County in renter-occupied apartments
- 193no vehicle
- 7391 vehicle
- 3992 vehicles
- 1433 vehicles
- 1124 vehicles
- 25+ vehicles
91.6% of Southampton County residents lived in the same house 1 years ago.
Out of people who lived in different houses, 16% lived in this county.
Out of people who lived in different counties, 84% lived in Virginia.
| Southampton County: | 91.6% |
| State average: | 86.6% |
Place of birth for U.S.-born residents:
- This state: 13,509
- Other state: 4,187
- Northeast: 1,229
- Midwest: 514
- South: 2,028
- West: 411
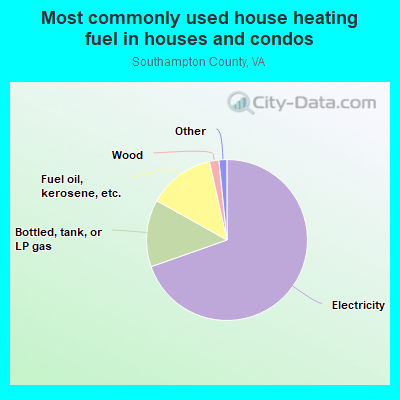
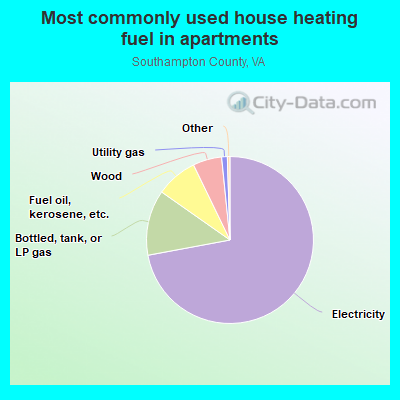
- 68.7%Electricity
- 14.0%Fuel oil, kerosene, etc.
- 13.5%Bottled, tank, or LP gas
- 1.4%Wood
- 1.3%No fuel used
- 0.6%Utility gas
- 0.5%Other fuel
- 72.0%Electricity
- 13.4%Bottled, tank, or LP gas
- 8.9%Fuel oil, kerosene, etc.
- 4.1%Wood
- 1.3%Utility gas
- 0.2%No fuel used
- 0.1%Other fuel
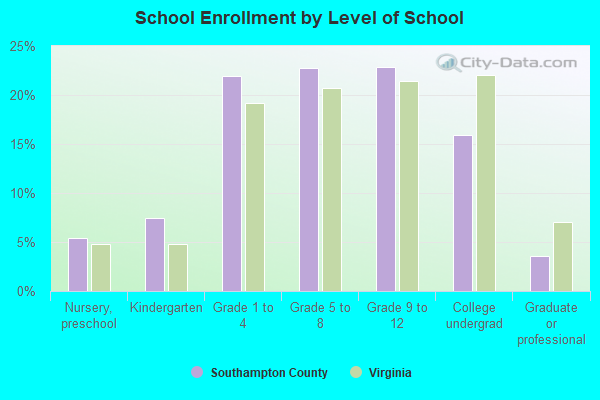
Private vs. public school enrollment:
| Here: | 12.7% |
| Virginia: | 13.2% |
| Here: | 17.5% |
| Virginia: | 10.2% |
| Here: | 14.9% |
| Virginia: | 18.7% |
Southampton County government finances - Expenditure in 2020:
- Bond Funds - Cash and Securities: $1,865,000
Cash and Securities: $1,521,000
- Charges - Solid Waste Management: $990,000
Solid Waste Management: $988,000
Sewerage: $763,000
Sewerage: $761,000
Other: $697,000
Other: $696,000
Elementary and Secondary Education School Lunch: $357,000
Elementary and Secondary Education School Lunch: $356,000
Elementary and Secondary Education School Tuition and Transportation: $116,000
Elementary and Secondary Education School Tuition and Transportation: $104,000
- Construction - Elementary and Secondary Education: $581,000
Elementary and Secondary Education: $561,000
Sewerage: $264,000
Sewerage: $261,000
Water Utilities: $189,000
Water Utilities: $189,000
- Current Operations - Elementary and Secondary Education: $33,682,000
Elementary and Secondary Education: $30,112,000
Correctional Institutions: $3,959,000
Correctional Institutions: $3,573,000
Solid Waste Management: $2,719,000
Police Protection: $2,539,000
Solid Waste Management: $2,454,000
Public Welfare - Other: $2,426,000
Police Protection: $2,292,000
Public Welfare - Other: $2,190,000
Judicial and Legal Services: $2,186,000
Local Fire Protection: $2,104,000
General - Other: $1,975,000
Judicial and Legal Services: $1,973,000
Local Fire Protection: $1,899,000
General - Other: $1,782,000
Financial Administration: $1,540,000
Financial Administration: $1,390,000
Sewerage: $1,045,000
General Public Buildings: $990,000
Sewerage: $943,000
General Public Buildings: $894,000
Housing and Community Development: $880,000
Housing and Community Development: $794,000
Central Staff Services: $765,000
Central Staff Services: $690,000
Water Utilities: $683,000
Water Utilities: $683,000
Health - Other: $540,000
Health - Other: $487,000
Libraries: $266,000
Libraries: $240,000
Corrections - Other: $205,000
Natural Resources - Other: $196,000
Protective Inspection and Regulation - Other: $187,000
Corrections - Other: $185,000
Natural Resources - Other: $177,000
Protective Inspection and Regulation - Other: $169,000
Regular Highways: $58,000
Regular Highways: $53,000
Parks and Recreation: $39,000
Parks and Recreation: $35,000
- Federal Intergovernmental - Public Welfare: $1,412,000
Public Welfare: $1,296,000
Education: $292,000
Education: $199,000
Other: $58,000
Other: $54,000
Highways: $2,000
Highways: $2,000
- General - Interest on Debt: $2,581,000
Interest on Debt: $2,474,000
- Intergovernmental to Local - Other - Elementary and Secondary Education: $1,916,000
Other - Elementary and Secondary Education: $1,857,000
- Local Intergovernmental - Education: $2,205,000
Education: $1,881,000
- Long Term Debt - Beginning Outstanding - Unspecified Public Purpose: $66,387,000
Outstanding Unspecified Public Purpose: $63,522,000
Beginning Outstanding - Unspecified Public Purpose: $59,970,000
Outstanding Unspecified Public Purpose: $56,418,000
Retired Unspecified Public Purpose: $3,552,000
Retired Unspecified Public Purpose: $3,552,000
Issue, Unspecified Public Purpose: $688,000
- Miscellaneous - General Revenue - Other: $1,908,000
General Revenue - Other: $1,599,000
Fines and Forfeits: $1,004,000
Fines and Forfeits: $841,000
Donations From Private Sources: $212,000
Donations From Private Sources: $178,000
Interest Earnings: $0
- Other Capital Outlay - Elementary and Secondary Education: $2,796,000
Elementary and Secondary Education: $2,758,000
Police Protection: $71,000
Police Protection: $70,000
- Other Funds - Cash and Securities: $7,233,000
Cash and Securities: $5,899,000
- Revenue - Water Utilities: $552,000
Water Utilities: $552,000
- State Intergovernmental - Education: $23,113,000
Education: $20,829,000
General Local Government Support: $4,406,000
General Local Government Support: $3,971,000
Other: $3,817,000
Other: $3,440,000
Public Welfare: $645,000
Public Welfare: $581,000
- Tax - Property: $22,665,000
Property: $20,530,000
General Sales and Gross Receipts: $1,411,000
General Sales and Gross Receipts: $1,278,000
Motor Vehicle License: $545,000
Motor Vehicle License: $493,000
Other License: $255,000
Other License: $231,000
Occupation and Business License - Other: $182,000
Occupation and Business License - Other: $165,000
Documentary and Stock Transfer: $144,000
Documentary and Stock Transfer: $130,000
Public Utilities Sales: $110,000
Public Utilities Sales: $99,000
Other Selective Sales: $13,000
Other Selective Sales: $12,000
- Total Salaries and Wages: $18,406,000
: $17,116,000
Southampton County government finances - Revenue in 2020:
- Bond Funds - Cash and Securities: $1,865,000
Cash and Securities: $1,521,000
- Charges - Solid Waste Management: $990,000
Solid Waste Management: $988,000
Sewerage: $763,000
Sewerage: $761,000
Other: $697,000
Other: $696,000
Elementary and Secondary Education School Lunch: $357,000
Elementary and Secondary Education School Lunch: $356,000
Elementary and Secondary Education School Tuition and Transportation: $116,000
Elementary and Secondary Education School Tuition and Transportation: $104,000
- Construction - Elementary and Secondary Education: $581,000
Elementary and Secondary Education: $561,000
Sewerage: $264,000
Sewerage: $261,000
Water Utilities: $189,000
Water Utilities: $189,000
- Current Operations - Elementary and Secondary Education: $33,682,000
Elementary and Secondary Education: $30,112,000
Correctional Institutions: $3,959,000
Correctional Institutions: $3,573,000
Solid Waste Management: $2,719,000
Police Protection: $2,539,000
Solid Waste Management: $2,454,000
Public Welfare - Other: $2,426,000
Police Protection: $2,292,000
Public Welfare - Other: $2,190,000
Judicial and Legal Services: $2,186,000
Local Fire Protection: $2,104,000
General - Other: $1,975,000
Judicial and Legal Services: $1,973,000
Local Fire Protection: $1,899,000
General - Other: $1,782,000
Financial Administration: $1,540,000
Financial Administration: $1,390,000
Sewerage: $1,045,000
General Public Buildings: $990,000
Sewerage: $943,000
General Public Buildings: $894,000
Housing and Community Development: $880,000
Housing and Community Development: $794,000
Central Staff Services: $765,000
Central Staff Services: $690,000
Water Utilities: $683,000
Water Utilities: $683,000
Health - Other: $540,000
Health - Other: $487,000
Libraries: $266,000
Libraries: $240,000
Corrections - Other: $205,000
Natural Resources - Other: $196,000
Protective Inspection and Regulation - Other: $187,000
Corrections - Other: $185,000
Natural Resources - Other: $177,000
Protective Inspection and Regulation - Other: $169,000
Regular Highways: $58,000
Regular Highways: $53,000
Parks and Recreation: $39,000
Parks and Recreation: $35,000
- Federal Intergovernmental - Public Welfare: $1,412,000
Public Welfare: $1,296,000
Education: $292,000
Education: $199,000
Other: $58,000
Other: $54,000
Highways: $2,000
Highways: $2,000
- General - Interest on Debt: $2,581,000
Interest on Debt: $2,474,000
- Intergovernmental to Local - Other - Elementary and Secondary Education: $1,916,000
Other - Elementary and Secondary Education: $1,857,000
- Local Intergovernmental - Education: $2,205,000
Education: $1,881,000
- Long Term Debt - Beginning Outstanding - Unspecified Public Purpose: $66,387,000
Outstanding Unspecified Public Purpose: $63,522,000
Beginning Outstanding - Unspecified Public Purpose: $59,970,000
Outstanding Unspecified Public Purpose: $56,418,000
Retired Unspecified Public Purpose: $3,552,000
Retired Unspecified Public Purpose: $3,552,000
Issue, Unspecified Public Purpose: $688,000
- Miscellaneous - General Revenue - Other: $1,908,000
General Revenue - Other: $1,599,000
Fines and Forfeits: $1,004,000
Fines and Forfeits: $841,000
Donations From Private Sources: $212,000
Donations From Private Sources: $178,000
Interest Earnings: $0
- Other Capital Outlay - Elementary and Secondary Education: $2,796,000
Elementary and Secondary Education: $2,758,000
Police Protection: $71,000
Police Protection: $70,000
- Other Funds - Cash and Securities: $7,233,000
Cash and Securities: $5,899,000
- Revenue - Water Utilities: $552,000
Water Utilities: $552,000
- State Intergovernmental - Education: $23,113,000
Education: $20,829,000
General Local Government Support: $4,406,000
General Local Government Support: $3,971,000
Other: $3,817,000
Other: $3,440,000
Public Welfare: $645,000
Public Welfare: $581,000
- Tax - Property: $22,665,000
Property: $20,530,000
General Sales and Gross Receipts: $1,411,000
General Sales and Gross Receipts: $1,278,000
Motor Vehicle License: $545,000
Motor Vehicle License: $493,000
Other License: $255,000
Other License: $231,000
Occupation and Business License - Other: $182,000
Occupation and Business License - Other: $165,000
Documentary and Stock Transfer: $144,000
Documentary and Stock Transfer: $130,000
Public Utilities Sales: $110,000
Public Utilities Sales: $99,000
Other Selective Sales: $13,000
Other Selective Sales: $12,000
- Total Salaries and Wages: $18,406,000
: $17,116,000
Southampton County government finances - Debt in 2020:
- Bond Funds - Cash and Securities: $1,865,000
Cash and Securities: $1,521,000
- Charges - Solid Waste Management: $990,000
Solid Waste Management: $988,000
Sewerage: $763,000
Sewerage: $761,000
Other: $697,000
Other: $696,000
Elementary and Secondary Education School Lunch: $357,000
Elementary and Secondary Education School Lunch: $356,000
Elementary and Secondary Education School Tuition and Transportation: $116,000
Elementary and Secondary Education School Tuition and Transportation: $104,000
- Construction - Elementary and Secondary Education: $581,000
Elementary and Secondary Education: $561,000
Sewerage: $264,000
Sewerage: $261,000
Water Utilities: $189,000
Water Utilities: $189,000
- Current Operations - Elementary and Secondary Education: $33,682,000
Elementary and Secondary Education: $30,112,000
Correctional Institutions: $3,959,000
Correctional Institutions: $3,573,000
Solid Waste Management: $2,719,000
Police Protection: $2,539,000
Solid Waste Management: $2,454,000
Public Welfare - Other: $2,426,000
Police Protection: $2,292,000
Public Welfare - Other: $2,190,000
Judicial and Legal Services: $2,186,000
Local Fire Protection: $2,104,000
General - Other: $1,975,000
Judicial and Legal Services: $1,973,000
Local Fire Protection: $1,899,000
General - Other: $1,782,000
Financial Administration: $1,540,000
Financial Administration: $1,390,000
Sewerage: $1,045,000
General Public Buildings: $990,000
Sewerage: $943,000
General Public Buildings: $894,000
Housing and Community Development: $880,000
Housing and Community Development: $794,000
Central Staff Services: $765,000
Central Staff Services: $690,000
Water Utilities: $683,000
Water Utilities: $683,000
Health - Other: $540,000
Health - Other: $487,000
Libraries: $266,000
Libraries: $240,000
Corrections - Other: $205,000
Natural Resources - Other: $196,000
Protective Inspection and Regulation - Other: $187,000
Corrections - Other: $185,000
Natural Resources - Other: $177,000
Protective Inspection and Regulation - Other: $169,000
Regular Highways: $58,000
Regular Highways: $53,000
Parks and Recreation: $39,000
Parks and Recreation: $35,000
- Federal Intergovernmental - Public Welfare: $1,412,000
Public Welfare: $1,296,000
Education: $292,000
Education: $199,000
Other: $58,000
Other: $54,000
Highways: $2,000
Highways: $2,000
- General - Interest on Debt: $2,581,000
Interest on Debt: $2,474,000
- Intergovernmental to Local - Other - Elementary and Secondary Education: $1,916,000
Other - Elementary and Secondary Education: $1,857,000
- Local Intergovernmental - Education: $2,205,000
Education: $1,881,000
- Long Term Debt - Beginning Outstanding - Unspecified Public Purpose: $66,387,000
Outstanding Unspecified Public Purpose: $63,522,000
Beginning Outstanding - Unspecified Public Purpose: $59,970,000
Outstanding Unspecified Public Purpose: $56,418,000
Retired Unspecified Public Purpose: $3,552,000
Retired Unspecified Public Purpose: $3,552,000
Issue, Unspecified Public Purpose: $688,000
- Miscellaneous - General Revenue - Other: $1,908,000
General Revenue - Other: $1,599,000
Fines and Forfeits: $1,004,000
Fines and Forfeits: $841,000
Donations From Private Sources: $212,000
Donations From Private Sources: $178,000
Interest Earnings: $0
- Other Capital Outlay - Elementary and Secondary Education: $2,796,000
Elementary and Secondary Education: $2,758,000
Police Protection: $71,000
Police Protection: $70,000
- Other Funds - Cash and Securities: $7,233,000
Cash and Securities: $5,899,000
- Revenue - Water Utilities: $552,000
Water Utilities: $552,000
- State Intergovernmental - Education: $23,113,000
Education: $20,829,000
General Local Government Support: $4,406,000
General Local Government Support: $3,971,000
Other: $3,817,000
Other: $3,440,000
Public Welfare: $645,000
Public Welfare: $581,000
- Tax - Property: $22,665,000
Property: $20,530,000
General Sales and Gross Receipts: $1,411,000
General Sales and Gross Receipts: $1,278,000
Motor Vehicle License: $545,000
Motor Vehicle License: $493,000
Other License: $255,000
Other License: $231,000
Occupation and Business License - Other: $182,000
Occupation and Business License - Other: $165,000
Documentary and Stock Transfer: $144,000
Documentary and Stock Transfer: $130,000
Public Utilities Sales: $110,000
Public Utilities Sales: $99,000
Other Selective Sales: $13,000
Other Selective Sales: $12,000
- Total Salaries and Wages: $18,406,000
: $17,116,000
Southampton County government finances - Cash and Securities in 2020:
- Bond Funds - Cash and Securities: $1,865,000
Cash and Securities: $1,521,000
- Charges - Solid Waste Management: $990,000
Solid Waste Management: $988,000
Sewerage: $763,000
Sewerage: $761,000
Other: $697,000
Other: $696,000
Elementary and Secondary Education School Lunch: $357,000
Elementary and Secondary Education School Lunch: $356,000
Elementary and Secondary Education School Tuition and Transportation: $116,000
Elementary and Secondary Education School Tuition and Transportation: $104,000
- Construction - Elementary and Secondary Education: $581,000
Elementary and Secondary Education: $561,000
Sewerage: $264,000
Sewerage: $261,000
Water Utilities: $189,000
Water Utilities: $189,000
- Current Operations - Elementary and Secondary Education: $33,682,000
Elementary and Secondary Education: $30,112,000
Correctional Institutions: $3,959,000
Correctional Institutions: $3,573,000
Solid Waste Management: $2,719,000
Police Protection: $2,539,000
Solid Waste Management: $2,454,000
Public Welfare - Other: $2,426,000
Police Protection: $2,292,000
Public Welfare - Other: $2,190,000
Judicial and Legal Services: $2,186,000
Local Fire Protection: $2,104,000
General - Other: $1,975,000
Judicial and Legal Services: $1,973,000
Local Fire Protection: $1,899,000
General - Other: $1,782,000
Financial Administration: $1,540,000
Financial Administration: $1,390,000
Sewerage: $1,045,000
General Public Buildings: $990,000
Sewerage: $943,000
General Public Buildings: $894,000
Housing and Community Development: $880,000
Housing and Community Development: $794,000
Central Staff Services: $765,000
Central Staff Services: $690,000
Water Utilities: $683,000
Water Utilities: $683,000
Health - Other: $540,000
Health - Other: $487,000
Libraries: $266,000
Libraries: $240,000
Corrections - Other: $205,000
Natural Resources - Other: $196,000
Protective Inspection and Regulation - Other: $187,000
Corrections - Other: $185,000
Natural Resources - Other: $177,000
Protective Inspection and Regulation - Other: $169,000
Regular Highways: $58,000
Regular Highways: $53,000
Parks and Recreation: $39,000
Parks and Recreation: $35,000
- Federal Intergovernmental - Public Welfare: $1,412,000
Public Welfare: $1,296,000
Education: $292,000
Education: $199,000
Other: $58,000
Other: $54,000
Highways: $2,000
Highways: $2,000
- General - Interest on Debt: $2,581,000
Interest on Debt: $2,474,000
- Intergovernmental to Local - Other - Elementary and Secondary Education: $1,916,000
Other - Elementary and Secondary Education: $1,857,000
- Local Intergovernmental - Education: $2,205,000
Education: $1,881,000
- Long Term Debt - Beginning Outstanding - Unspecified Public Purpose: $66,387,000
Outstanding Unspecified Public Purpose: $63,522,000
Beginning Outstanding - Unspecified Public Purpose: $59,970,000
Outstanding Unspecified Public Purpose: $56,418,000
Retired Unspecified Public Purpose: $3,552,000
Retired Unspecified Public Purpose: $3,552,000
Issue, Unspecified Public Purpose: $688,000
- Miscellaneous - General Revenue - Other: $1,908,000
General Revenue - Other: $1,599,000
Fines and Forfeits: $1,004,000
Fines and Forfeits: $841,000
Donations From Private Sources: $212,000
Donations From Private Sources: $178,000
Interest Earnings: $0
- Other Capital Outlay - Elementary and Secondary Education: $2,796,000
Elementary and Secondary Education: $2,758,000
Police Protection: $71,000
Police Protection: $70,000
- Other Funds - Cash and Securities: $7,233,000
Cash and Securities: $5,899,000
- Revenue - Water Utilities: $552,000
Water Utilities: $552,000
- State Intergovernmental - Education: $23,113,000
Education: $20,829,000
General Local Government Support: $4,406,000
General Local Government Support: $3,971,000
Other: $3,817,000
Other: $3,440,000
Public Welfare: $645,000
Public Welfare: $581,000
- Tax - Property: $22,665,000
Property: $20,530,000
General Sales and Gross Receipts: $1,411,000
General Sales and Gross Receipts: $1,278,000
Motor Vehicle License: $545,000
Motor Vehicle License: $493,000
Other License: $255,000
Other License: $231,000
Occupation and Business License - Other: $182,000
Occupation and Business License - Other: $165,000
Documentary and Stock Transfer: $144,000
Documentary and Stock Transfer: $130,000
Public Utilities Sales: $110,000
Public Utilities Sales: $99,000
Other Selective Sales: $13,000
Other Selective Sales: $12,000
- Total Salaries and Wages: $18,406,000
: $17,116,000
Supplemental Security Income (SSI) in 2006:
- Total number of recipients: 554
- Number of aged recipients: 93
- Number of blind and disabled recipients: 461
- Number of recipients under 18: 95
- Number of recipients between 18 and 64: 296
- Number of recipients older than 64: 163
- Number of recipients also receiving OASDI: 260
- Amount of payments (thousands of dollars): 203
| Most common first names in Southampton County, VA among deceased individuals | ||
| Name | Count | Lived (average) |
|---|---|---|
| James | 120 | 70.4 years |
| John | 91 | 73.3 years |
| Mary | 80 | 80.3 years |
| William | 73 | 69.8 years |
| Robert | 60 | 66.5 years |
| Willie | 54 | 73.9 years |
| George | 50 | 73.1 years |
| Annie | 38 | 84.0 years |
| Joseph | 36 | 71.9 years |
| Virginia | 35 | 78.4 years |
| Most common last names in Southampton County, VA among deceased individuals | ||
| Last name | Count | Lived (average) |
|---|---|---|
| Williams | 63 | 71.6 years |
| Joyner | 51 | 75.9 years |
| Brown | 51 | 73.4 years |
| Bryant | 49 | 78.7 years |
| Davis | 47 | 74.6 years |
| Johnson | 47 | 72.9 years |
| Harris | 39 | 74.5 years |
| Barnes | 37 | 70.8 years |
| Turner | 37 | 71.4 years |
| Jones | 37 | 74.8 years |
| Businesses in Southampton County, VA | ||||
| Name | Count | Name | Count | |
|---|---|---|---|---|
| 7-Eleven | 2 | Lane Furniture | 1 | |
| Dairy Queen | 1 | True Value | 1 | |
| La-Z-Boy | 2 | U-Haul | 2 | |