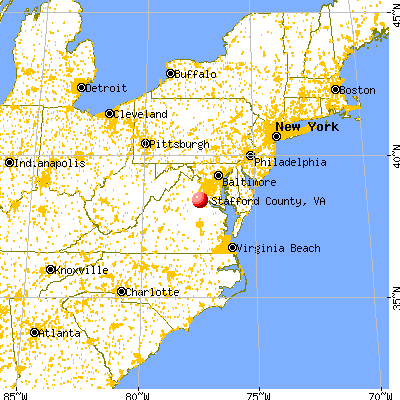
Stafford County, Virginia (VA)
County owner-occupied free and clear houses and condos in 2010: 4,322
County owner-occupied houses and condos in 2000: 24,331
Renter-occupied apartments: 9,430 (it was 5,856 in 2000)
| % of renters here: | 19% |
| State: | 33% |
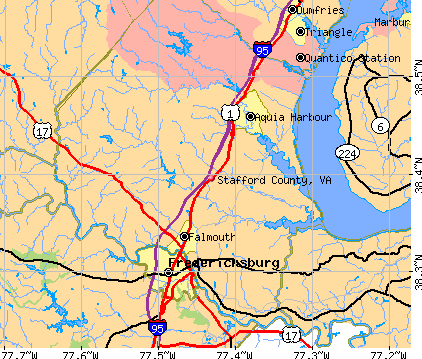
Land area: 270 sq. mi.
Water area: 9.6 sq. mi.
Population density: 604 people per square mile (high).
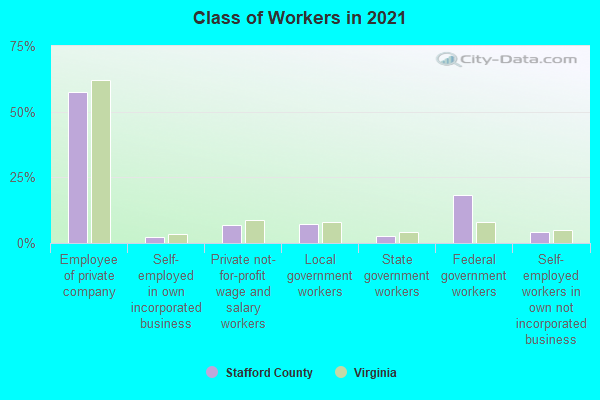
Industries providing employment: Educational, health and social services (20.1%), Public administration (19.9%), Professional, scientific, management, administrative, and waste management services (17.6%), Retail trade (10.4%).
Type of workers:
- Private wage or salary: 61%
- Government: 35%
- Self-employed, not incorporated: 4%
- Unpaid family work: 0%
- OSM Map
- General Map
- Google Map
- MSN Map

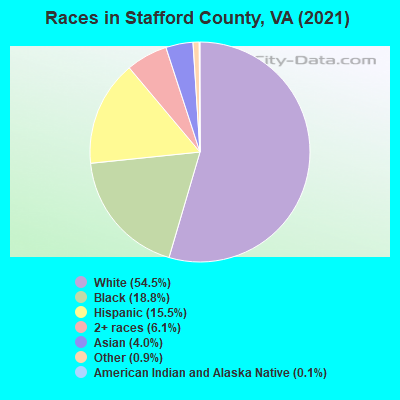
- 82,06250.2%White Non-Hispanic Alone
- 31,84319.5%Black Non-Hispanic Alone
- 26,58116.3%Hispanic or Latino
- 12,8117.8%Two or more races
- 7,1964.4%Asian alone
- 2,7821.7%Some other race alone
- 550.03%American Indian and Alaska Native alone
- 500.03%Native Hawaiian and Other
Pacific Islander alone
| Median resident age: | 37.0 years |
| Virginia median age: | 39.0 years |
| Males: 83,120 | |
| Females: 80,260 |

 | is NoVA where the North ends? (45 replies) |
| Is Stafford County gonna turn into Loudoun (15 replies) |
| Stafford County-Exurb or Suburb? (10 replies) |
| First Snowfall - 1/3/2022 (76 replies) |
| Navigating Life in NOVA during Covid19 (490 replies) |
| Stop Overdevelopment in Northern Virginia (65 replies) |
| Stafford County: | 3.0 people |
| Virginia: | 3 people |
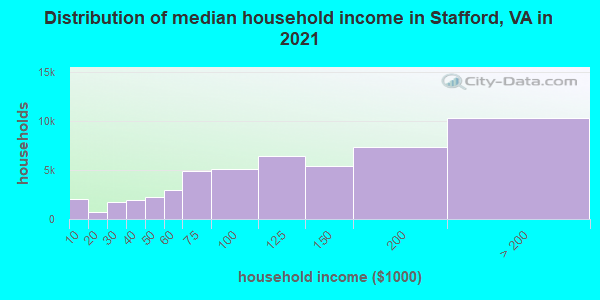
Estimated median household income in 2022: $138,378 ($66,809 in 1999)
| This county: | $138,378 |
| Virginia: | $85,873 |
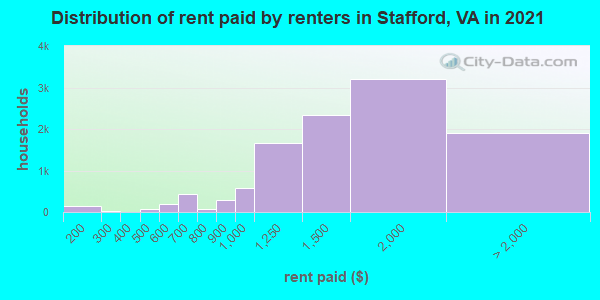
Median contract rent in 2022 for apartments: $1,549 (lower quartile is $1,284, upper quartile is $1,971)
| This county: | $1549 |
| State: | $1270 |
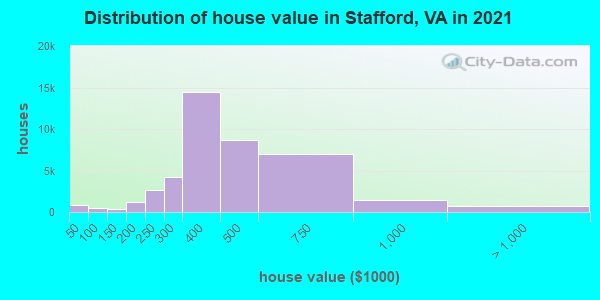
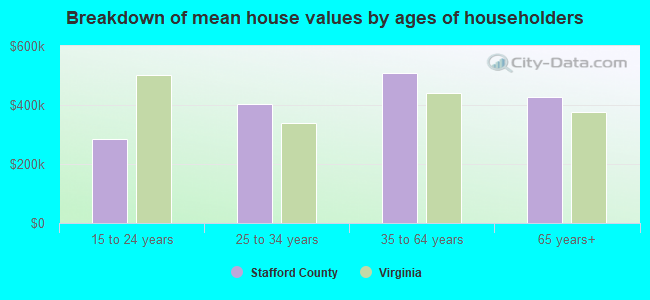
Estimated median house or condo value in 2022: $478,200 (it was $155,100 in 2000)
| Stafford: | $478,200 |
| Virginia: | $365,700 |
Mean price in 2022:
Median monthly housing costs for homes and condos with a mortgage: $2,315Detached houses: $480,433
Here: $480,433 State: $472,865 Townhouses or other attached units: $359,386
Here: $359,386 State: $457,437 In 3-to-4-unit structures: $264,357
Here: $264,357 State: $252,346 In 5-or-more-unit structures: $239,881
Here: $239,881 State: $382,551 Mobile homes: $90,315
Here: $90,315 State: $100,736
Median monthly housing costs for units without a mortgage: $558
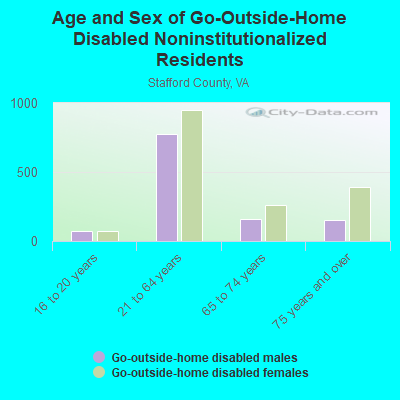
Institutionalized population: 1,637
Crime in 2021 (reported by the sheriff's office or county police, not the county total):
- Murders: 4
- Rapes: 85
- Robberies: 24
- Assaults: 205
- Burglaries: 92
- Thefts: 1070
- Auto thefts: 87
Crime in 2020 (reported by the sheriff's office or county police, not the county total):
- Murders: 2
- Rapes: 65
- Robberies: 37
- Assaults: 203
- Burglaries: 71
- Thefts: 1034
- Auto thefts: 67
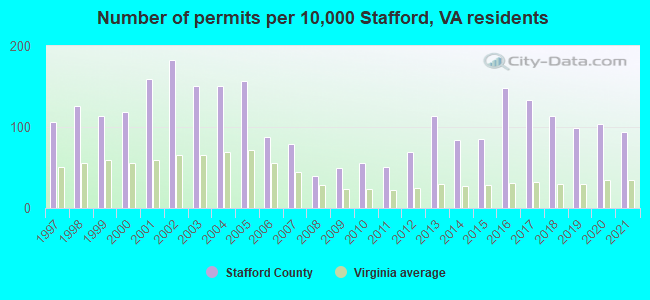
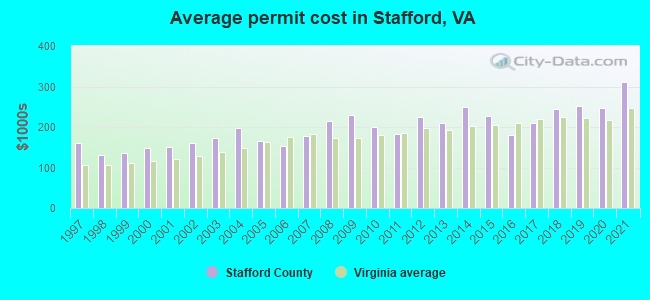
Single-family new house construction building permits:
- 2022: 582 buildings, average cost: $355,000
- 2021: 865 buildings, average cost: $312,400
- 2020: 964 buildings, average cost: $247,100
- 2019: 913 buildings, average cost: $253,100
- 2018: 1048 buildings, average cost: $244,100
- 2017: 1227 buildings, average cost: $209,900
- 2016: 1370 buildings, average cost: $180,200
- 2015: 785 buildings, average cost: $226,000
- 2014: 772 buildings, average cost: $248,700
- 2013: 1043 buildings, average cost: $210,900
- 2012: 638 buildings, average cost: $223,700
- 2011: 471 buildings, average cost: $181,800
- 2010: 522 buildings, average cost: $200,000
- 2009: 455 buildings, average cost: $229,500
- 2008: 371 buildings, average cost: $215,800
- 2007: 732 buildings, average cost: $177,300
- 2006: 818 buildings, average cost: $153,800
- 2005: 1452 buildings, average cost: $164,600
- 2004: 1395 buildings, average cost: $196,700
- 2003: 1385 buildings, average cost: $174,000
- 2002: 1692 buildings, average cost: $160,900
- 2001: 1468 buildings, average cost: $150,300
- 2000: 1101 buildings, average cost: $148,300
- 1999: 1048 buildings, average cost: $136,300
- 1998: 1169 buildings, average cost: $129,500
- 1997: 984 buildings, average cost: $160,200
Median real estate property taxes paid for housing units with mortgages in 2022: $3,227 (0.7%)
Median real estate property taxes paid for housing units with no mortgage in 2022: $2,726 (0.7%)
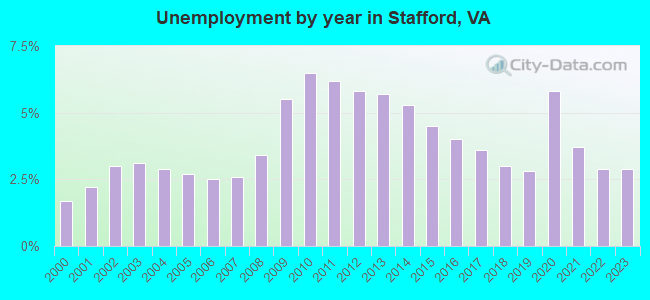
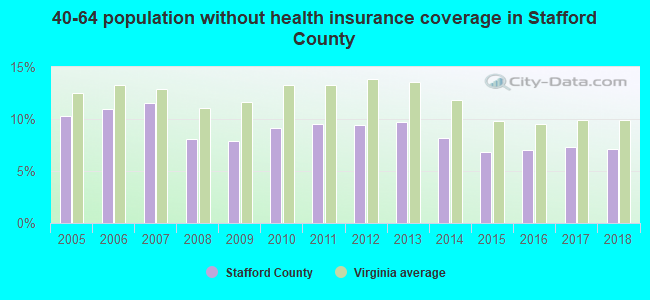
| Stafford County: | 4.2% |
| Virginia: | 10.6% |
Median age of residents in 2022: 37.0 years old
(Males: 35.4 years old, Females: 38.6 years old)
(Median age for: White residents: 41.3 years old, Black residents: 37.6 years old, American Indian residents: 37.8 years old, Asian residents: 37.4 years old, Hispanic or Latino residents: 29.8 years old, Other race residents: 30.3 years old)
Area name: Washington-Arlington-Alexandria, DC-VA-MD HUD Metro FMR Area
Fair market rent in 2006 for a 1-bedroom apartment in Stafford County is $1080 a month.
Fair market rent for a 2-bedroom apartment is $1225 a month.
Fair market rent for a 3-bedroom apartment is $1580 a month.
Cities in this county include: Aquia Harbour, Stafford Courthouse, Falmouth, Southern Gateway, Boswell's Corner.
2023 air pollution in Stafford County:
Ozone (1-hour): 0.032 ppm (standard limit: 0.12 ppm). Near U.S. average.
Notable locations in this county outside city limits:
Notable locations in Stafford County: Confederate Breastworks (A), Forks of Waters (B), Flood (C), Locust Springs Recreation Site (D), Locust Springs Picnic Area (E), Valley Center (F), Head Waters (G), Company 4 Buena Vista Rescue Squad (H), Company 1 Lexington Rescue Squad (I), Shenandoah Rescue Squad (J). Display/hide their locations on the map
Churches in Stafford County include: Asbury Church (A), Beulah Presbyterian Church (B), Central Church (C), Green Hill Church (D), Hamilton Chapel (E), Hightown Church (F), Hiner Church (G), Laurel Gap Church (H), Lockridge Memorial Church (I). Display/hide their locations on the map
Cemeteries: Stony Run Cemetery (1), Fairview Cemetery (2), Griffin Cemetery (3), Big Valley Cemetery (4), Blue Grass Cemetery (5). Display/hide their locations on the map
Streams, rivers, and creeks: Warwick Run (A), Siebert Run (B), Eowyns Run (C), Hulit Draft (D), Wooden Run (E), Whiteman Run (F), White Run (G), Vinegar Run (H), Upper Mountain Lick (I). Display/hide their locations on the map
Park in Stafford County: Highland Wildlife Management Area (1). Display/hide its location on the map
Neighboring counties: Clinton County, Illinois  , Perry County, Indiana , Saline County, Kansas , Harrisonburg city .
| Here: | 2.8% |
| Virginia: | 2.7% |

Current college students: 4,879
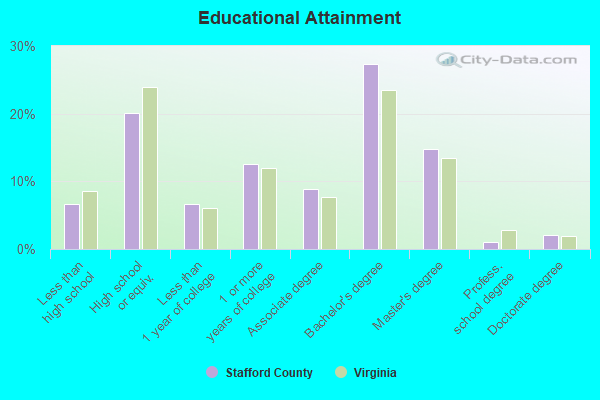
People 25 years of age or older with a high school degree or higher: 92.0%
People 25 years of age or older with a bachelor's degree or higher: 44.2%
Number of foreign born residents: 26,012 (59.9% naturalized citizens)
| Stafford County: | 15.9% |
| Whole state: | 12.7% |
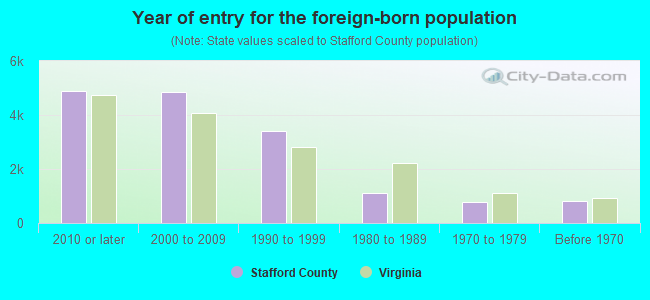
- Year of entry for the foreign-born population
- 5,9502010 or later
- 5,4272000 to 2009
- 3,6441990 to 1999
- 1,0991980 to 1989
- 7731970 to 1979
- 813Before 1970
Mean travel time to work (commute): ! minutes
Percentage of county residents living and working in this county: 94.2%
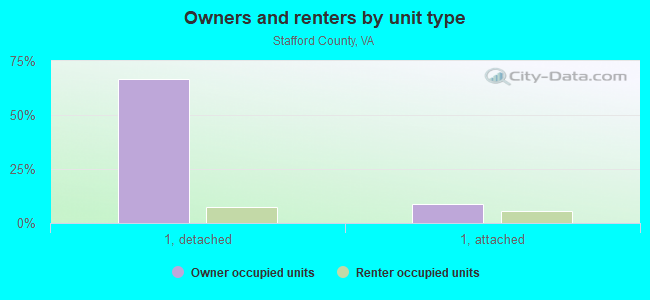
Housing units in structures:
- One, detached: 41,420
- One, attached: 8,362
- 3 or 4: 296
- 5 to 9: 1,068
- 10 to 19: 2,102
- 20 to 49: 367
- 50 or more: 346
- Mobile homes: 875
Housing units in Stafford County with a mortgage: 34,699 (2,757 second mortgage, 343 home equity loan, 2,060 both second mortgage and home equity loan)
Houses without a mortgage: 373
| Here: | 8.4% with mortgage |
| State: | 97.2% with mortgage |
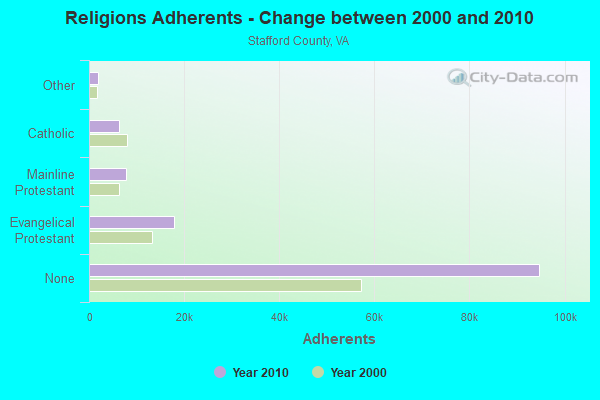
Religion statistics for Stafford County
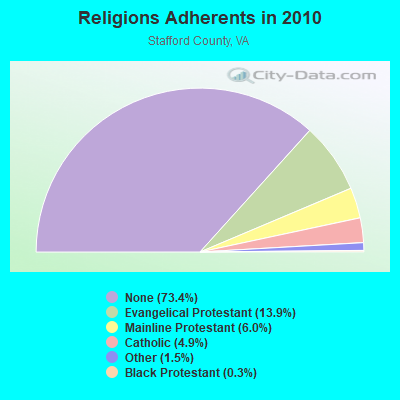
| Religion | Adherents | Congregations |
|---|---|---|
| Evangelical Protestant | 17,871 | 67 |
| Mainline Protestant | 7,704 | 14 |
| Catholic | 6,288 | 1 |
| Other | 1,978 | 8 |
| Black Protestant | 356 | 4 |
| Orthodox | 50 | 1 |
| None | 94,714 | - |
Source: Clifford Grammich, Kirk Hadaway, Richard Houseal, Dale E.Jones, Alexei Krindatch, Richie Stanley and Richard H.Taylor. 2012. 2010 U.S.Religion Census: Religious Congregations & Membership Study. Association of Statisticians of American Religious Bodies. Jones, Dale E., et al. 2002. Congregations and Membership in the United States 2000. Nashville, TN: Glenmary Research Center.
Food Environment Statistics:
| Stafford County: | 0.91 / 10,000 pop. |
| State: | 2.03 / 10,000 pop. |
| This county: | 0.66 / 10,000 pop. |
| Virginia: | 1.43 / 10,000 pop. |
| Stafford County: | 2.90 / 10,000 pop. |
| Virginia: | 4.03 / 10,000 pop. |
| This county: | 5.22 / 10,000 pop. |
| State: | 7.65 / 10,000 pop. |
| Stafford County: | 7.7% |
| Virginia: | 9.3% |
| Stafford County: | 27.8% |
| State: | 26.7% |
| Here: | 15.7% |
| State: | 18.6% |
Agriculture in Stafford County:
Average size of farms: 111 acresAverage value of agricultural products sold per farm: $10,530
Average value of crops sold per acre for harvested cropland: $120.98
The value of nursery, greenhouse, floriculture, and sod as a percentage of the total market value of agricultural products sold: 2.06%
The value of livestock, poultry, and their products as a percentage of the total market value of agricultural products sold: 53.62%
Average total farm production expenses per farm: $18,335
Harvested cropland as a percentage of land in farms: 36.46%
Irrigated harvested cropland as a percentage of land in farms: 1.95%
Average market value of all machinery and equipment per farm: $39,315
The percentage of farms operated by a family or individual: 89.83%
Average age of principal farm operators: 58 years
Average number of cattle and calves per 100 acres of all land in farms: 14.85
Corn for grain: 1257 harvested acres
All wheat for grain: 156 harvested acres
Soybeans for beans: 1333 harvested acres
Tornado activity:
Stafford County historical area-adjusted tornado activity is significantly below Virginia state average. It is 27724927.1 times below overall U.S. average.Earthquake activity:
Stafford County-area historical earthquake activity is significantly above Virginia state average. It is 54% smaller than the overall U.S. average.On 8/23/2011 at 17:51:04, a magnitude 5.8 (5.8 MW, Depth: 3.7 mi, Class: Moderate, Intensity: VI - VII) earthquake occurred 43.3 miles away from Stafford County center
On 8/25/2011 at 05:07:52, a magnitude 4.5 (4.5 ML, Depth: 4.2 mi, Class: Light, Intensity: IV - V) earthquake occurred 42.5 miles away from the county center
On 12/9/2003 at 20:59:18, a magnitude 4.5 (4.5 ML, Depth: 6.2 mi) earthquake occurred 56.2 miles away from the county center
On 12/9/2003 at 20:59:14, a magnitude 4.5 (4.5 MB, 4.5 LG) earthquake occurred 61.5 miles away from the county center
On 8/24/2011 at 00:04:36, a magnitude 4.2 (4.2 ML) earthquake occurred 43.7 miles away from Stafford County center
On 8/9/2020 at 12:07:37, a magnitude 5.1 (5.1 MW, Depth: 4.7 mi) earthquake occurred 240.9 miles away from the county center
Magnitude types: regional Lg-wave magnitude (LG), body-wave magnitude (MB), local magnitude (ML), moment magnitude (MW)
Most recent natural disasters:
- Virginia Covid-19 Pandemic, Incident Period: January 20, 2020, Major Disaster (Presidential) Declared DR-4512-VA: April 2, 2020, FEMA Id: 4512, Natural disaster type: Other
- Virginia Severe Winter Storm And Snowstorm, Incident Period: January 22, 2016 to January 23, 2016, Major Disaster (Presidential) Declared DR-4262: March 07, 2016, FEMA Id: 4262, Natural disaster type: Snowstorm, Winter Storm
- Virginia Hurricane Sandy, Incident Period: October 26, 2012 to November 01, 2012, Emergency Declared EM-3359: October 29, 2012, FEMA Id: 3359, Natural disaster type: Hurricane
- Virginia Severe Storms and Straight-line Winds, Incident Period: June 29, 2012 to July 01, 2012, Major Disaster (Presidential) Declared DR-4072: July 27, 2012, FEMA Id: 4072, Natural disaster type: Storm, Wind
- Virginia Severe Winter Storms and Snowstorms, Incident Period: February 05, 2010 to February 11, 2010, Major Disaster (Presidential) Declared DR-1905: April 27, 2010, FEMA Id: 1905, Natural disaster type: Snowstorm, Winter Storm
- Virginia Severe Winter Storm and Snowstorm, Incident Period: December 18, 2009 to December 20, 2009, Major Disaster (Presidential) Declared DR-1874: February 16, 2010, FEMA Id: 1874, Natural disaster type: Snowstorm, Winter Storm
- Virginia Hurricane Katrina Evacuation, Incident Period: August 29, 2005 to October 01, 2005, Emergency Declared EM-3240: September 12, 2005, FEMA Id: 3240, Natural disaster type: Hurricane
- Virginia Hurricane Isabel, Incident Period: September 18, 2003 to October 01, 2003, Major Disaster (Presidential) Declared DR-1491: September 18, 2003, FEMA Id: 1491, Natural disaster type: Hurricane
- Virginia Winter Storm, Incident Period: January 25, 2000 to January 30, 2000, Major Disaster (Presidential) Declared DR-1318: February 28, 2000, FEMA Id: 1318, Natural disaster type: Winter Storm
- Virginia Hurricane Fran, Incident Period: September 05, 1996 to September 23, 1996, Major Disaster (Presidential) Declared DR-1135: September 06, 1996, FEMA Id: 1135, Natural disaster type: Hurricane
- 5 other natural disasters have been reported since 1953.
The number of natural disasters in Stafford County (15) is near the US average (15).
Major Disasters (Presidential) Declared: 11
Emergencies Declared: 4
Causes of natural disasters: Winter Storms: 5, Hurricanes: 4, Snowstorms: 3, Storms: 2, Blizzard: 1, Drought: 1, Flood: 1, Tropical Storm: 1, Wind: 1, Other: 1 (Note: some incidents may be assigned to more than one category).
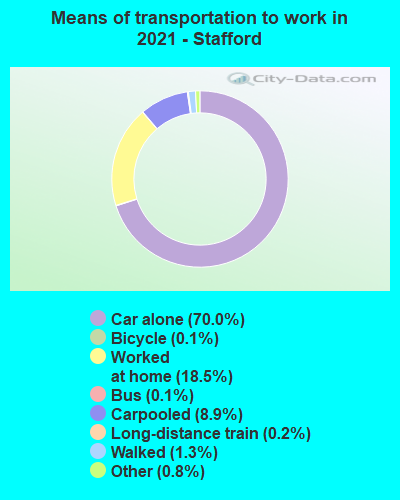
Means of transportation to work:
- Drove a car alone: 35,882 (63.7%)
- Carpooled: 5,247 (9.3%)
- Bus: 31 (0.1%)
- Long-distance train or commuter rail: 40 (0.1%)
- Taxicab, motorcycle, or other means: 538 (1.0%)
- Bicycle: 40 (0.1%)
- Walked: 648 (1.2%)
- Worked at home: 15,551 (27.6%)
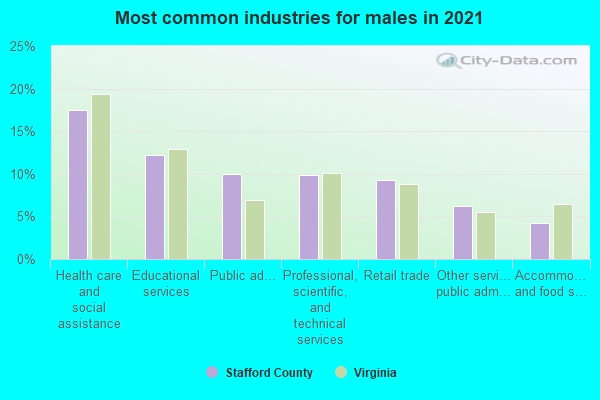
- Health care and social assistance (18%)
- Public administration (13%)
- Educational services (11%)
- Retail trade (7%)
- Professional, scientific, and technical services (7%)
- Transportation and warehousing (4%)
- Administrative and support and waste management services (4%)
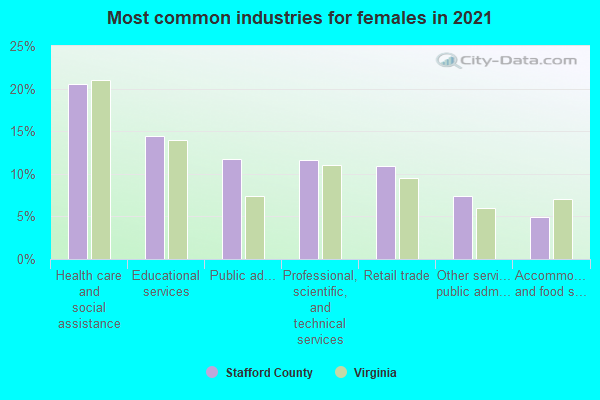
- Health care and social assistance (23%)
- Public administration (16%)
- Educational services (13%)
- Retail trade (8%)
- Professional, scientific, and technical services (8%)
- Transportation and warehousing (5%)
- Administrative and support and waste management services (4%)
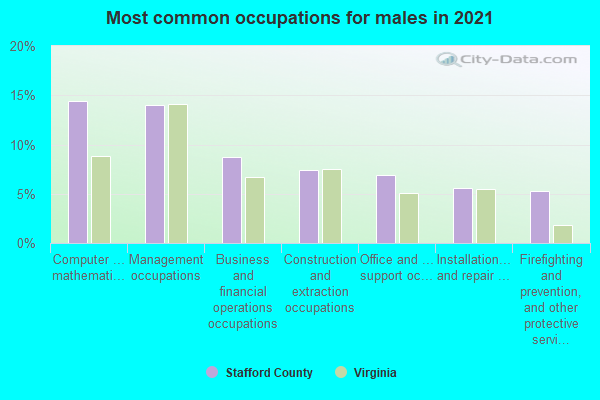
- Computer and mathematical occupations (14%)
- Management occupations (11%)
- Transportation occupations (7%)
- Business and financial operations occupations (7%)
- Construction and extraction occupations (7%)
- Architecture and engineering occupations (6%)
- Food preparation and serving related occupations (6%)
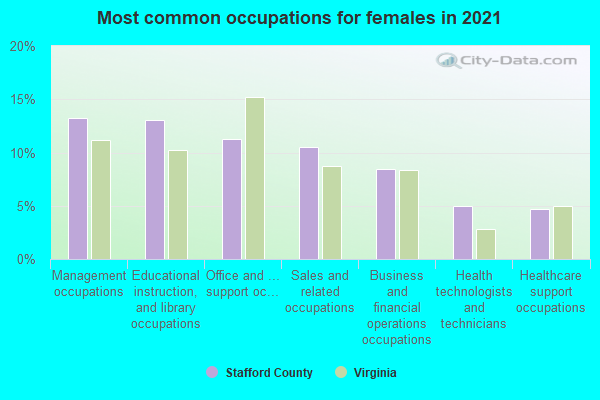
- Management occupations (15%)
- Office and administrative support occupations (14%)
- Educational instruction, and library occupations (12%)
- Sales and related occupations (7%)
- Business and financial operations occupations (7%)
- Health diagnosing and treating practitioners and other technical occupations (6%)
- Health technologists and technicians (5%)
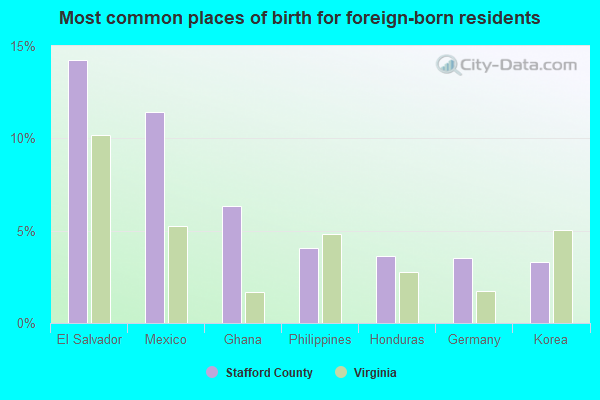
- El Salvador (16%)
- Mexico (9%)
- Ghana (6%)
- Korea (4%)
- Philippines (3%)
- Peru (3%)
- India (3%)
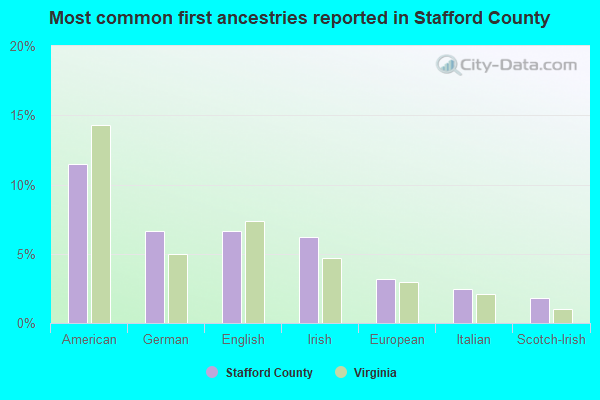
- American (11%)
- English (7%)
- German (6%)
- Irish (6%)
- European (3%)
- Italian (3%)
- Scotch-Irish (2%)
People in group quarters in Stafford County, Virginia in 2010:
- 1,908 people in military barracks and dormitories (nondisciplinary)
- 1,315 people in local jails and other municipal confinement facilities
- 164 people in nursing facilities/skilled-nursing facilities
- 81 people in correctional residential facilities
- 48 people in group homes intended for adults
- 42 people in correctional facilities intended for juveniles
- 22 people in military disciplinary barracks and jails
- 13 people in group homes for juveniles (non-correctional)
People in group quarters in Stafford County, Virginia in 2000:
- 673 people in military transient quarters for temporary residents
- 281 people in nursing homes
- 253 people in military barracks, etc.
- 90 people in local jails and other confinement facilities (including police lockups)
- 58 people in state prisons
- 44 people in military disciplinary barracks
- 29 people in other nonhousehold living situations
- 28 people in hospitals/wards and hospices for chronically ill
- 28 people in hospices or homes for chronically ill
- 17 people in other group homes
- 12 people in other noninstitutional group quarters
- 9 people in homes for abused, dependent, and neglected children
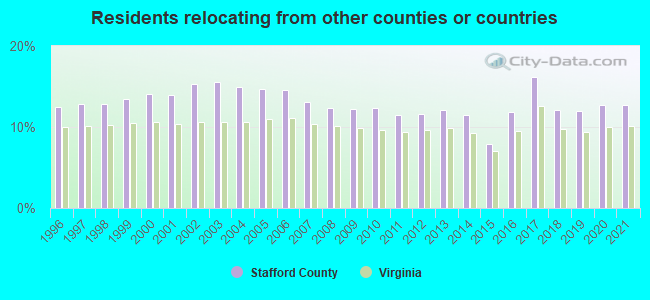
12.70% of this county's 2021 resident taxpayers lived in other counties in 2020 ($72,242 average adjusted gross income)
| Here: | 12.70% |
| Virginia average: | 10.16% |
0.22% of residents moved from foreign countries ($1,471 average AGI)
Stafford County: 0.22% Virginia average: 0.12%
8.22% relocated from other counties in Virginia ($47,100 average AGI)
4.26% relocated from other states ($23,671 average AGI)
Stafford County: 4.26% Virginia average: 3.91%
Top counties from which taxpayers relocated into this county between 2020 and 2021:
| from Prince William County, VA | |
| from Fairfax County, VA | |
| from Spotsylvania County, VA | |
| from Fredericksburg city, VA | |
| from Alexandria city, VA | |
| from Prince George's County, MD | |
| from Arlington County, VA |
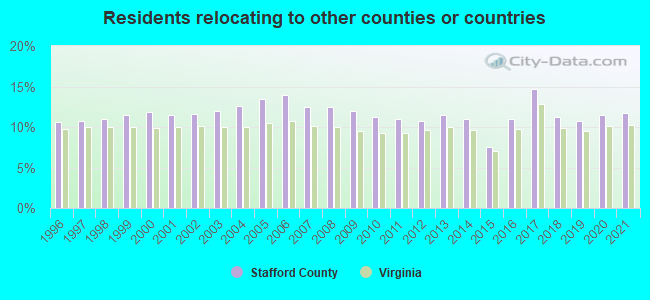
11.75% of this county's 2020 resident taxpayers moved to other counties in 2021 ($76,917 average adjusted gross income)
| Here: | 11.75% |
| Virginia average: | 10.20% |
0.15% of residents moved to foreign countries ($1,082 average AGI)
Stafford County: 0.15% Virginia average: 0.09%
6.86% relocated to other counties in Virginia ($41,847 average AGI)
4.74% relocated to other states ($33,989 average AGI)
Stafford County: 4.74% Virginia average: 3.98%
Top counties to which taxpayers relocated from this county between 2020 and 2021:
| to Spotsylvania County, VA | |
| to Prince William County, VA | |
| to Fredericksburg city, VA | |
| to Fairfax County, VA | |
| to Caroline County, VA | |
| to King George County, VA | |
| to Orange County, VA |
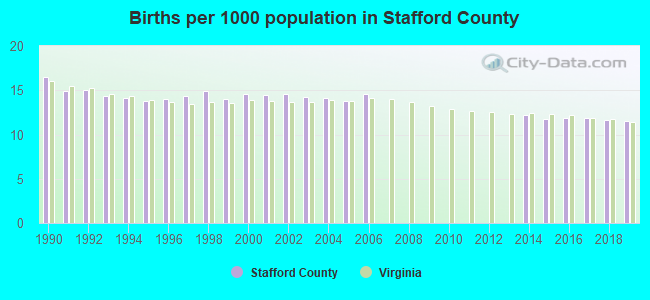
Births per 1000 population from 1990 to 1999: 14.6
Births per 1000 population from 2000 to 2009: 10.0
Births per 1000 population from 2010 to 2022: 6.3
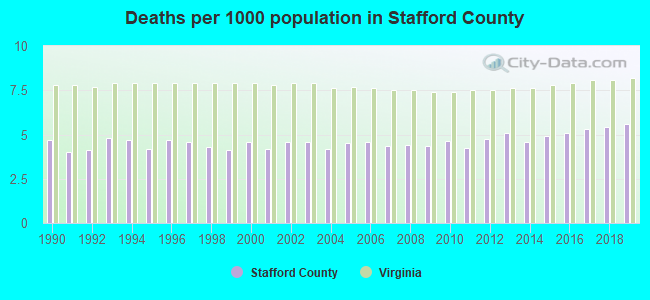
Deaths per 1000 population from 1990 to 1999: 4.4
Deaths per 1000 population from 2000 to 2009: 4.4
Deaths per 1000 population from 2010 to 2020: 5.0
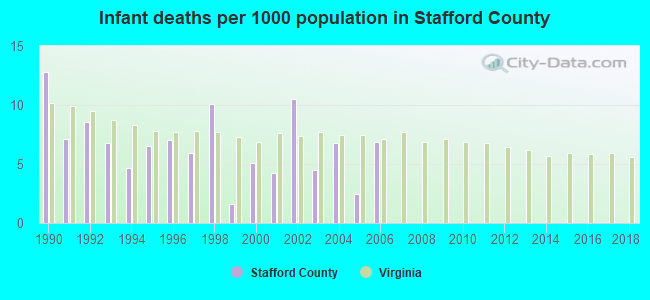
Infant deaths per 1000 live births from 1990 to 1999: 7.1
Infant deaths per 1000 live births from 2000 to 2006: 5.8
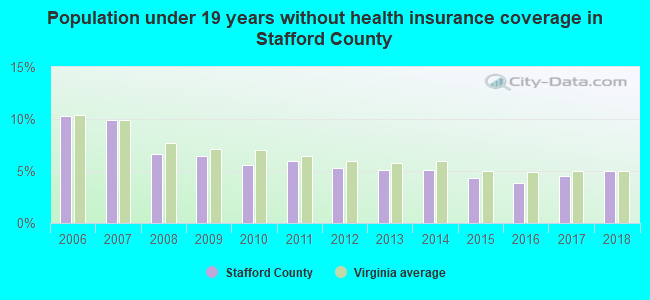
Persons under 19 years old without health insurance coverage in 2018: 5.0%
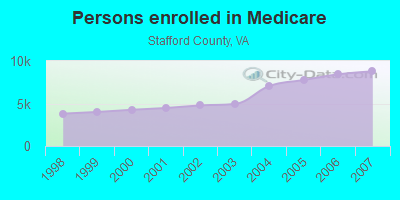
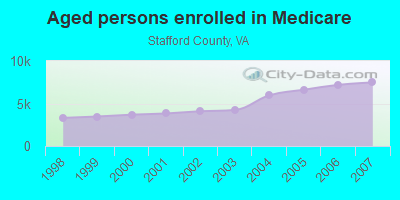
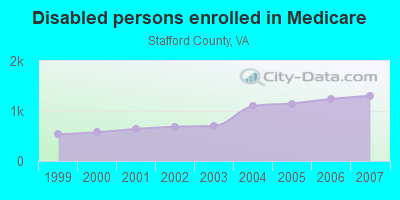
Persons enrolled in hospital insurance and/or supplemental medical insurance (Medicare) in July 1, 2007: 8,786 (7,481 aged, 1,305 disabled)
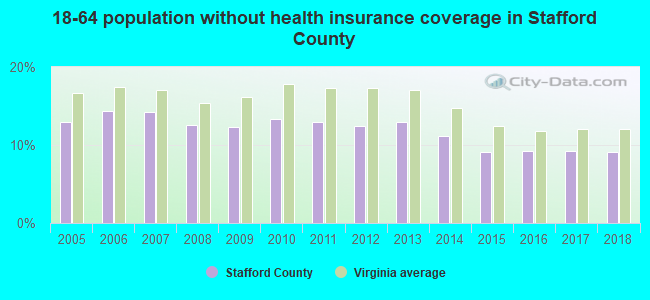
Children under 18 without health insurance coverage in 2007: 3,283 (9%)
Most common underlying causes of death in Stafford County, Virginia in 1999 - 2019:
- Bronchus or lung, unspecified - Malignant neoplasms (899)
- Acute myocardial infarction, unspecified (568)
- Atherosclerotic heart disease (538)
- Unspecified dementia (499)
- Alzheimer disease, unspecified (426)
- Chronic obstructive pulmonary disease, unspecified (368)
- Stroke, not specified as haemorrhage or infarction (263)
- Breast, unspecified - Malignant neoplasms (244)
- Septicaemia, unspecified (217)
- Pneumonia, unspecified (203)
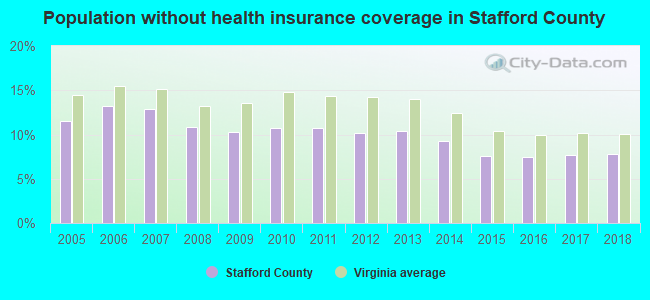
Population without health insurance coverage in 2000: 11%
Children under 18 without health insurance coverage in 2000: 9%
Medical specialist MDs per 100,000 population in 2005: 445
Dentists per 100,000 population in 1998: 3
Total births per 100,000 population, July 2005 - July 2006 : 20
Total deaths per 100,000 population, July 2005 - July 2006: 56
Limited-service eating places per 100,000 population in 2005 : 10
Beer, wine & liquor stores per 100,000 population in 2005: 1
Homicides per 1,000,000 population from 2000 to 2006: 29.3. This is less than state average.
Suicides per 1,000,000 population from 2000 to 2006: 83.8. This is less than state average.
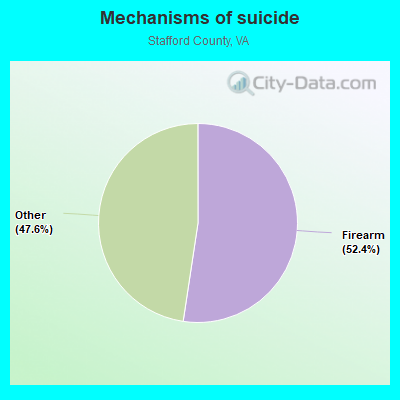
- Firearm - 43.9
- Other - 39.9
Household type by relationship:
Households: 163,380- Male householders: 27,230 (3,578 living alone), Female householders: 25,085 (4,967 living alone)
34,790 spouses (34,477 opposite-sex spouses), 3,906 unmarried partners, (3,629 opposite-sex unmarried partners), 55,937 children (53,288 natural, 381 adopted, 2,268 stepchildren), 3,952 grandchildren, 1,192 brothers or sisters, 2,430 parents, 0 foster children, 2,502 other relatives, 2,621 non-relatives
- In group quarters: 3,735
Size of family households: 12,791 2-persons, 8,625 3-persons, 10,571 4-persons, 4,511 5-persons, 3,438 6-persons, 1,201 7-or-more-persons.
Size of nonfamily households: 8,545 1-person, 2,370 2-persons, 263 3-persons.
30,416 married couples with children.
7,308 single-parent households (2,514 men, 4,794 women).
82.2% of residents of Stafford speak English at home.
10.6% of residents speak Spanish at home (61% speak English very well, 21% speak English well, 13% speak English not well, 4% don't speak English at all).
3.5% of residents speak other Indo-European language at home (60% speak English very well, 28% speak English well, 9% speak English not well, 2% don't speak English at all).
1.8% of residents speak Asian or Pacific Island language at home (59% speak English very well, 26% speak English well, 14% speak English not well).
1.7% of residents speak other language at home (68% speak English very well, 28% speak English well, 2% speak English not well, 1% don't speak English at all).
In fiscal year 2004:
Federal Government expenditure: $362,072,000 ($3,154 per capita)
Department of Defense expenditure: $89,806,000
Federal direct payments to individuals for retirement and disability: $238,011,000
Federal other direct payments to individuals: $28,232,000
Federal direct payments not to individuals: $504,000
Federal grants: $28,873,000
Federal procurement contracts: $7,352,000 ($3,905,000 Department of Defense)
Federal salaries and wages: $59,100,000 ($4,486,000 Department of Defense)
Federal Government direct loans: $515,000
Federal guaranteed/insured loans: $295,456,000
Federal Government insurance: $59,859,000
Population change from April 1, 2000 to July 1, 2005:
Births: 8,054| Here: | 68 per 1000 residents |
| State: | 70 per 1000 residents |
Deaths: 2,511
| Here: | 21 per 1000 residents |
| State: | 40 per 1000 residents |
Net international migration: +350
| Here: | +3 per 1000 residents |
| State: | +18 per 1000 residents |
Net internal migration: +19,654
| Here: | +167 per 1000 residents |
| State: | +14 per 1000 residents |
Total withdrawal of fresh water for public supply: 7.11 millions of gallons per day (all from surface)
| Here: | 8.2 |
| State: | 7.0 |
| Here: | 5.6 |
| State: | 4.3 |
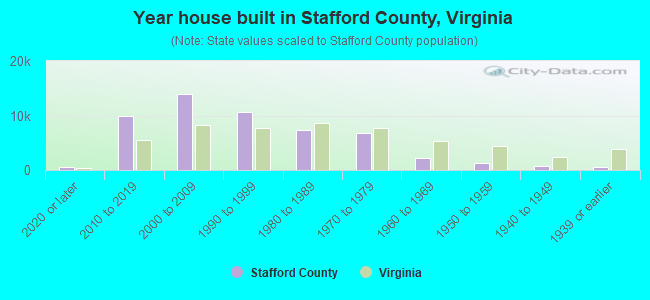
- Year house built in Stafford County, Virginia
- 1,2542020 or later
- 10,3052010 to 2019
- 13,5602000 to 2009
- 11,2241990 to 1999
- 7,6131980 to 1989
- 6,3441970 to 1979
- 1,6231960 to 1969
- 1,8901950 to 1959
- 5061940 to 1949
- 5171939 or earlier
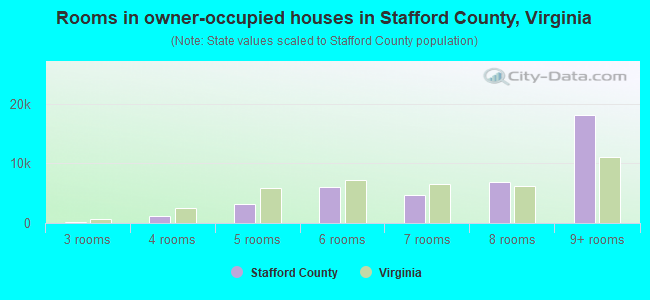
- Rooms in owner-occupied houses in Stafford County, Virginia
- 801 room
- 02 rooms
- 1783 rooms
- 1,2574 rooms
- 3,6265 rooms
- 5,4726 rooms
- 5,4857 rooms
- 8,4798 rooms
- 19,3999+ rooms
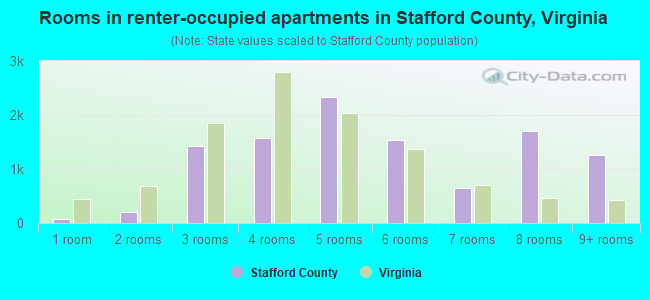
- Rooms in renter-occupied apartments in Stafford County, Virginia
- 1621 room
- 952 rooms
- 2273 rooms
- 2,1994 rooms
- 1,3295 rooms
- 1,5716 rooms
- 8807 rooms
- 5848 rooms
- 1,2929+ rooms
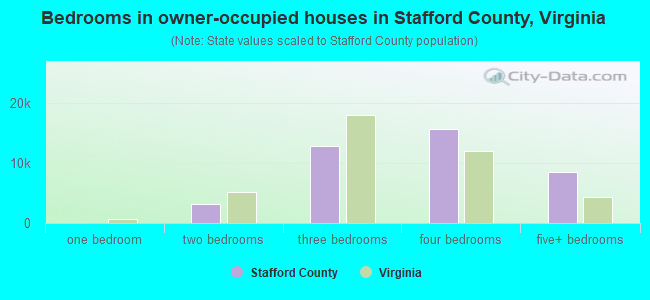
- Bedrooms in owner-occupied houses in Stafford County, Virginia
- 167no bedroom
- 381 bedroom
- 2,0972 bedrooms
- 13,8523 bedrooms
- 17,9784 bedrooms
- 9,8445+ bedrooms
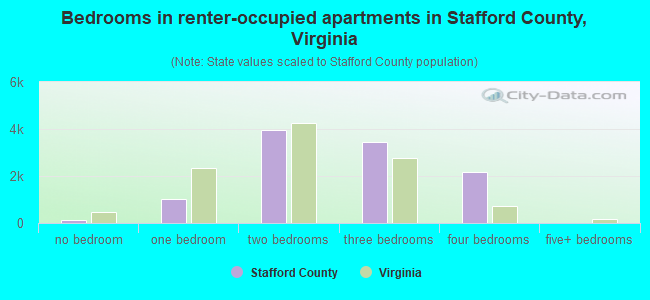
- Bedrooms in renter-occupied apartments in Stafford County, Virginia
- 162no bedroom
- 4211 bedroom
- 2,3332 bedrooms
- 3,1973 bedrooms
- 1,7044 bedrooms
- 5225+ bedrooms
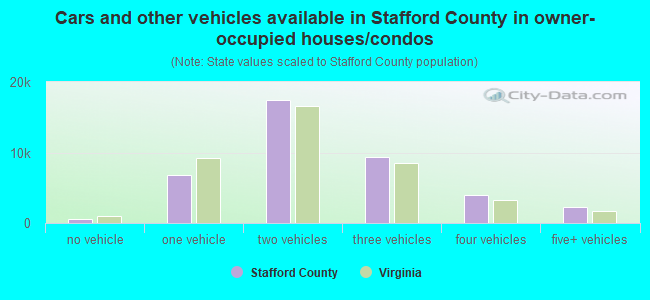
- Cars and other vehicles available in Stafford County in owner-occupied houses/condos
- 756no vehicle
- 8,0521 vehicle
- 17,3752 vehicles
- 9,8833 vehicles
- 5,2254 vehicles
- 2,6855+ vehicles
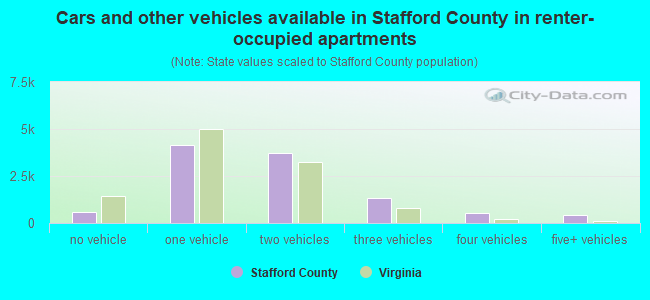
- Cars and other vehicles available in Stafford County in renter-occupied apartments
- 372no vehicle
- 3,0171 vehicle
- 3,6152 vehicles
- 7843 vehicles
- 1424 vehicles
- 4095+ vehicles
87.3% of Stafford County residents lived in the same house 1 years ago.
Out of people who lived in different houses, 7% lived in this county.
Out of people who lived in different counties, 54% lived in Virginia.
| Stafford County: | 87.3% |
| State average: | 86.6% |
Place of birth for U.S.-born residents:
- This state: 60,328
- Other state: 71,490
- Northeast: 17,212
- Midwest: 10,217
- South: 28,991
- West: 15,070
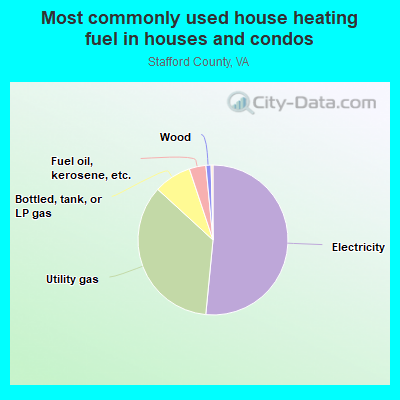
- 51.7%Electricity
- 35.9%Utility gas
- 7.7%Bottled, tank, or LP gas
- 3.2%Fuel oil, kerosene, etc.
- 0.9%Wood
- 0.2%No fuel used
- 0.2%Other fuel
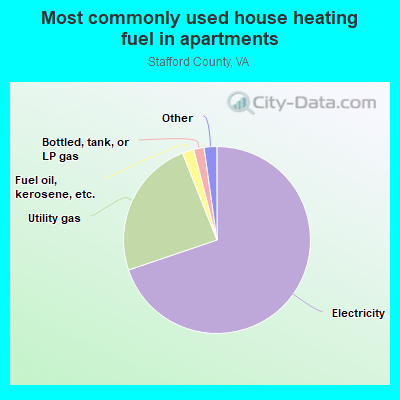
- 70.4%Electricity
- 22.9%Utility gas
- 2.4%Bottled, tank, or LP gas
- 2.3%Fuel oil, kerosene, etc.
- 0.8%Wood
- 0.6%No fuel used
- 0.6%Other fuel
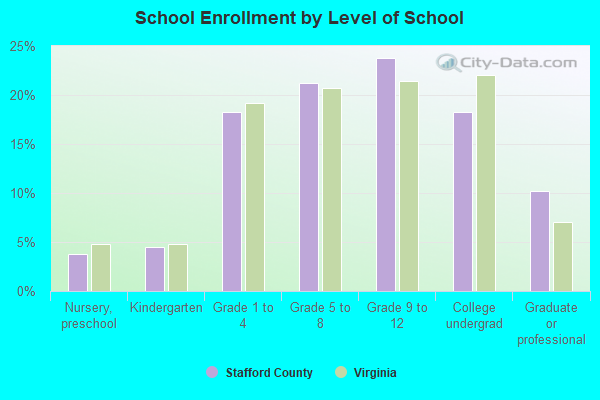
Private vs. public school enrollment:
| Here: | 14.1% |
| Virginia: | 13.2% |
| Here: | 3.4% |
| Virginia: | 10.2% |
| Here: | 7.9% |
| Virginia: | 18.7% |
Stafford County government finances - Expenditure in 2020:
- Assistance and Subsidies - Public Welfare, Cash Assistance Programs - Other: $1,230,000
Public Welfare, Cash Assistance Programs - Other: $1,152,000
Public Welfare, Federal Categorical Assistance Programs: $414,000
Public Welfare, Federal Categorical Assistance Programs: $309,000
- Bond Funds - Cash and Securities: $9,241,000
Cash and Securities: $77,000
- Charges - Sewerage: $28,640,000
Sewerage: $25,093,000
Elementary and Secondary Education School Lunch: $6,451,000
Elementary and Secondary Education School Lunch: $5,154,000
Parks and Recreation: $1,767,000
Elementary and Secondary Education School Tuition and Transportation: $1,242,000
Elementary and Secondary Education School Tuition and Transportation: $1,015,000
Parks and Recreation: $828,000
Other: $316,000
Other: $302,000
Elementary and Secondary Education - Other: $106,000
Elementary and Secondary Education - Other: $79,000
- Construction - Elementary and Secondary Education: $18,700,000
Regular Highways: $14,732,000
Elementary and Secondary Education: $9,635,000
Regular Highways: $7,791,000
Sewerage: $6,780,000
General - Other: $4,458,000
General - Other: $3,335,000
Parks and Recreation: $1,605,000
Water Utilities: $125,000
General Public Buildings: $38,000
Health - Other: $10,000
- Current Operations - Elementary and Secondary Education: $319,918,000
Elementary and Secondary Education: $292,045,000
Water Utilities: $32,572,000
Police Protection: $26,030,000
Water Utilities: $23,924,000
Local Fire Protection: $21,299,000
Police Protection: $19,616,000
Local Fire Protection: $14,776,000
Public Welfare - Other: $12,764,000
Public Welfare - Other: $12,579,000
Parks and Recreation: $12,487,000
Financial Administration: $9,997,000
Judicial and Legal Services: $9,757,000
Correctional Institutions: $9,167,000
Judicial and Legal Services: $8,932,000
Financial Administration: $8,680,000
Correctional Institutions: $6,770,000
Sewerage: $6,683,000
Central Staff Services: $6,250,000
Libraries: $5,566,000
Libraries: $5,238,000
Central Staff Services: $5,091,000
Protective Inspection and Regulation - Other: $4,743,000
General Public Buildings: $4,557,000
Regular Highways: $4,048,000
General Public Buildings: $3,491,000
Health - Other: $1,949,000
Sewerage: $1,707,000
Health - Other: $1,156,000
General - Other: $1,156,000
General - Other: $1,089,000
Parks and Recreation: $856,000
Regular Highways: $687,000
Natural Resources - Other: $171,000
Natural Resources - Other: $163,000
Public Welfare, Vendor Payments for Other Purposes: $64,000
Public Welfare, Vendor Payments for Other Purposes: $60,000
- Federal Intergovernmental - Education: $5,071,000
Education: $4,067,000
Public Welfare: $3,981,000
General Local Government Support: $1,554,000
Highways: $364,000
Highways: $341,000
Other: $215,000
- General - Interest on Debt: $17,294,000
Interest on Debt: $16,401,000
- Intergovernmental to Local - Other - Transit Utilities: $2,870,000
Other - Transit Utilities: $2,345,000
Other - Elementary and Secondary Education: $779,000
Other - Elementary and Secondary Education: $616,000
- Local Intergovernmental - Education: $1,734,000
Education: $1,273,000
- Long Term Debt - Beginning Outstanding - Unspecified Public Purpose: $569,666,000
Outstanding Unspecified Public Purpose: $559,828,000
Beginning Outstanding - Unspecified Public Purpose: $531,355,000
Outstanding Unspecified Public Purpose: $481,377,000
Beginning Outstanding - Public Debt for Private Purpose: $79,280,000
Beginning Outstanding - Public Debt for Private Purpose: $79,280,000
Outstanding Nonguaranteed - Industrial Revenue: $79,280,000
Outstanding Nonguaranteed - Industrial Revenue: $79,280,000
Retired Unspecified Public Purpose: $60,604,000
Retired Unspecified Public Purpose: $38,596,000
Issue, Unspecified Public Purpose: $28,757,000
Issue, Unspecified Public Purpose: $10,626,000
- Miscellaneous - Donations From Private Sources: $13,492,000
Donations From Private Sources: $6,183,000
General Revenue - Other: $5,287,000
Interest Earnings: $4,790,000
General Revenue - Other: $3,668,000
Interest Earnings: $2,058,000
Fines and Forfeits: $876,000
Special Assessments: $835,000
Rents: $763,000
Special Assessments: $682,000
Fines and Forfeits: $673,000
Rents: $484,000
Sale of Property: $64,000
Sale of Property: $25,000
- Other Capital Outlay - Elementary and Secondary Education: $15,373,000
Sewerage: $5,693,000
Elementary and Secondary Education: $5,079,000
Water Utilities: $4,047,000
Water Utilities: $1,181,000
Sewerage: $736,000
Parks and Recreation: $421,000
Police Protection: $278,000
General Public Building: $165,000
Local Fire Protection: $148,000
Parks and Recreation: $140,000
Police Protection: $23,000
Health - Other: $23,000
Central Staff Services: $14,000
General Public Building: $10,000
Financial Administration: $8,000
Judicial and Legal Services: $4,000
- Other Funds - Cash and Securities: $320,731,000
Cash and Securities: $253,378,000
- Revenue - Water Utilities: $30,292,000
Water Utilities: $26,426,000
- Sinking Funds - Cash and Securities: $90,794,000
Cash and Securities: $86,107,000
- State Intergovernmental - Education: $188,229,000
Education: $169,966,000
General Local Government Support: $24,966,000
General Local Government Support: $24,102,000
Public Welfare: $7,872,000
Other: $6,659,000
Other: $6,411,000
Highways: $5,389,000
Highways: $4,575,000
Public Welfare: $2,992,000
Water Utilities: $158,000
Housing and Community Development: $41,000
- Tax - Property: $253,709,000
Property: $222,527,000
General Sales and Gross Receipts: $37,196,000
General Sales and Gross Receipts: $25,897,000
Other Selective Sales: $10,423,000
Public Utilities Sales: $7,362,000
Documentary and Stock Transfer: $7,134,000
Public Utilities Sales: $6,881,000
Documentary and Stock Transfer: $6,557,000
Other License: $5,292,000
Other License: $4,640,000
Motor Fuels Sales: $4,324,000
Motor Fuels Sales: $3,807,000
Other: $3,579,000
Motor Vehicle License: $3,000,000
Motor Vehicle License: $2,646,000
- Total Salaries and Wages: $199,716,000
: $177,136,000
- Water Utilities - Interest on Debt: $3,495,000
Interest on Debt: $3,311,000
Stafford County government finances - Revenue in 2020:
- Assistance and Subsidies - Public Welfare, Cash Assistance Programs - Other: $1,230,000
Public Welfare, Cash Assistance Programs - Other: $1,152,000
Public Welfare, Federal Categorical Assistance Programs: $414,000
Public Welfare, Federal Categorical Assistance Programs: $309,000
- Bond Funds - Cash and Securities: $9,241,000
Cash and Securities: $77,000
- Charges - Sewerage: $28,640,000
Sewerage: $25,093,000
Elementary and Secondary Education School Lunch: $6,451,000
Elementary and Secondary Education School Lunch: $5,154,000
Parks and Recreation: $1,767,000
Elementary and Secondary Education School Tuition and Transportation: $1,242,000
Elementary and Secondary Education School Tuition and Transportation: $1,015,000
Parks and Recreation: $828,000
Other: $316,000
Other: $302,000
Elementary and Secondary Education - Other: $106,000
Elementary and Secondary Education - Other: $79,000
- Construction - Elementary and Secondary Education: $18,700,000
Regular Highways: $14,732,000
Elementary and Secondary Education: $9,635,000
Regular Highways: $7,791,000
Sewerage: $6,780,000
General - Other: $4,458,000
General - Other: $3,335,000
Parks and Recreation: $1,605,000
Water Utilities: $125,000
General Public Buildings: $38,000
Health - Other: $10,000
- Current Operations - Elementary and Secondary Education: $319,918,000
Elementary and Secondary Education: $292,045,000
Water Utilities: $32,572,000
Police Protection: $26,030,000
Water Utilities: $23,924,000
Local Fire Protection: $21,299,000
Police Protection: $19,616,000
Local Fire Protection: $14,776,000
Public Welfare - Other: $12,764,000
Public Welfare - Other: $12,579,000
Parks and Recreation: $12,487,000
Financial Administration: $9,997,000
Judicial and Legal Services: $9,757,000
Correctional Institutions: $9,167,000
Judicial and Legal Services: $8,932,000
Financial Administration: $8,680,000
Correctional Institutions: $6,770,000
Sewerage: $6,683,000
Central Staff Services: $6,250,000
Libraries: $5,566,000
Libraries: $5,238,000
Central Staff Services: $5,091,000
Protective Inspection and Regulation - Other: $4,743,000
General Public Buildings: $4,557,000
Regular Highways: $4,048,000
General Public Buildings: $3,491,000
Health - Other: $1,949,000
Sewerage: $1,707,000
Health - Other: $1,156,000
General - Other: $1,156,000
General - Other: $1,089,000
Parks and Recreation: $856,000
Regular Highways: $687,000
Natural Resources - Other: $171,000
Natural Resources - Other: $163,000
Public Welfare, Vendor Payments for Other Purposes: $64,000
Public Welfare, Vendor Payments for Other Purposes: $60,000
- Federal Intergovernmental - Education: $5,071,000
Education: $4,067,000
Public Welfare: $3,981,000
General Local Government Support: $1,554,000
Highways: $364,000
Highways: $341,000
Other: $215,000
- General - Interest on Debt: $17,294,000
Interest on Debt: $16,401,000
- Intergovernmental to Local - Other - Transit Utilities: $2,870,000
Other - Transit Utilities: $2,345,000
Other - Elementary and Secondary Education: $779,000
Other - Elementary and Secondary Education: $616,000
- Local Intergovernmental - Education: $1,734,000
Education: $1,273,000
- Long Term Debt - Beginning Outstanding - Unspecified Public Purpose: $569,666,000
Outstanding Unspecified Public Purpose: $559,828,000
Beginning Outstanding - Unspecified Public Purpose: $531,355,000
Outstanding Unspecified Public Purpose: $481,377,000
Beginning Outstanding - Public Debt for Private Purpose: $79,280,000
Beginning Outstanding - Public Debt for Private Purpose: $79,280,000
Outstanding Nonguaranteed - Industrial Revenue: $79,280,000
Outstanding Nonguaranteed - Industrial Revenue: $79,280,000
Retired Unspecified Public Purpose: $60,604,000
Retired Unspecified Public Purpose: $38,596,000
Issue, Unspecified Public Purpose: $28,757,000
Issue, Unspecified Public Purpose: $10,626,000
- Miscellaneous - Donations From Private Sources: $13,492,000
Donations From Private Sources: $6,183,000
General Revenue - Other: $5,287,000
Interest Earnings: $4,790,000
General Revenue - Other: $3,668,000
Interest Earnings: $2,058,000
Fines and Forfeits: $876,000
Special Assessments: $835,000
Rents: $763,000
Special Assessments: $682,000
Fines and Forfeits: $673,000
Rents: $484,000
Sale of Property: $64,000
Sale of Property: $25,000
- Other Capital Outlay - Elementary and Secondary Education: $15,373,000
Sewerage: $5,693,000
Elementary and Secondary Education: $5,079,000
Water Utilities: $4,047,000
Water Utilities: $1,181,000
Sewerage: $736,000
Parks and Recreation: $421,000
Police Protection: $278,000
General Public Building: $165,000
Local Fire Protection: $148,000
Parks and Recreation: $140,000
Police Protection: $23,000
Health - Other: $23,000
Central Staff Services: $14,000
General Public Building: $10,000
Financial Administration: $8,000
Judicial and Legal Services: $4,000
- Other Funds - Cash and Securities: $320,731,000
Cash and Securities: $253,378,000
- Revenue - Water Utilities: $30,292,000
Water Utilities: $26,426,000
- Sinking Funds - Cash and Securities: $90,794,000
Cash and Securities: $86,107,000
- State Intergovernmental - Education: $188,229,000
Education: $169,966,000
General Local Government Support: $24,966,000
General Local Government Support: $24,102,000
Public Welfare: $7,872,000
Other: $6,659,000
Other: $6,411,000
Highways: $5,389,000
Highways: $4,575,000
Public Welfare: $2,992,000
Water Utilities: $158,000
Housing and Community Development: $41,000
- Tax - Property: $253,709,000
Property: $222,527,000
General Sales and Gross Receipts: $37,196,000
General Sales and Gross Receipts: $25,897,000
Other Selective Sales: $10,423,000
Public Utilities Sales: $7,362,000
Documentary and Stock Transfer: $7,134,000
Public Utilities Sales: $6,881,000
Documentary and Stock Transfer: $6,557,000
Other License: $5,292,000
Other License: $4,640,000
Motor Fuels Sales: $4,324,000
Motor Fuels Sales: $3,807,000
Other: $3,579,000
Motor Vehicle License: $3,000,000
Motor Vehicle License: $2,646,000
- Total Salaries and Wages: $199,716,000
: $177,136,000
- Water Utilities - Interest on Debt: $3,495,000
Interest on Debt: $3,311,000
Stafford County government finances - Debt in 2020:
- Assistance and Subsidies - Public Welfare, Cash Assistance Programs - Other: $1,230,000
Public Welfare, Cash Assistance Programs - Other: $1,152,000
Public Welfare, Federal Categorical Assistance Programs: $414,000
Public Welfare, Federal Categorical Assistance Programs: $309,000
- Bond Funds - Cash and Securities: $9,241,000
Cash and Securities: $77,000
- Charges - Sewerage: $28,640,000
Sewerage: $25,093,000
Elementary and Secondary Education School Lunch: $6,451,000
Elementary and Secondary Education School Lunch: $5,154,000
Parks and Recreation: $1,767,000
Elementary and Secondary Education School Tuition and Transportation: $1,242,000
Elementary and Secondary Education School Tuition and Transportation: $1,015,000
Parks and Recreation: $828,000
Other: $316,000
Other: $302,000
Elementary and Secondary Education - Other: $106,000
Elementary and Secondary Education - Other: $79,000
- Construction - Elementary and Secondary Education: $18,700,000
Regular Highways: $14,732,000
Elementary and Secondary Education: $9,635,000
Regular Highways: $7,791,000
Sewerage: $6,780,000
General - Other: $4,458,000
General - Other: $3,335,000
Parks and Recreation: $1,605,000
Water Utilities: $125,000
General Public Buildings: $38,000
Health - Other: $10,000
- Current Operations - Elementary and Secondary Education: $319,918,000
Elementary and Secondary Education: $292,045,000
Water Utilities: $32,572,000
Police Protection: $26,030,000
Water Utilities: $23,924,000
Local Fire Protection: $21,299,000
Police Protection: $19,616,000
Local Fire Protection: $14,776,000
Public Welfare - Other: $12,764,000
Public Welfare - Other: $12,579,000
Parks and Recreation: $12,487,000
Financial Administration: $9,997,000
Judicial and Legal Services: $9,757,000
Correctional Institutions: $9,167,000
Judicial and Legal Services: $8,932,000
Financial Administration: $8,680,000
Correctional Institutions: $6,770,000
Sewerage: $6,683,000
Central Staff Services: $6,250,000
Libraries: $5,566,000
Libraries: $5,238,000
Central Staff Services: $5,091,000
Protective Inspection and Regulation - Other: $4,743,000
General Public Buildings: $4,557,000
Regular Highways: $4,048,000
General Public Buildings: $3,491,000
Health - Other: $1,949,000
Sewerage: $1,707,000
Health - Other: $1,156,000
General - Other: $1,156,000
General - Other: $1,089,000
Parks and Recreation: $856,000
Regular Highways: $687,000
Natural Resources - Other: $171,000
Natural Resources - Other: $163,000
Public Welfare, Vendor Payments for Other Purposes: $64,000
Public Welfare, Vendor Payments for Other Purposes: $60,000
- Federal Intergovernmental - Education: $5,071,000
Education: $4,067,000
Public Welfare: $3,981,000
General Local Government Support: $1,554,000
Highways: $364,000
Highways: $341,000
Other: $215,000
- General - Interest on Debt: $17,294,000
Interest on Debt: $16,401,000
- Intergovernmental to Local - Other - Transit Utilities: $2,870,000
Other - Transit Utilities: $2,345,000
Other - Elementary and Secondary Education: $779,000
Other - Elementary and Secondary Education: $616,000
- Local Intergovernmental - Education: $1,734,000
Education: $1,273,000
- Long Term Debt - Beginning Outstanding - Unspecified Public Purpose: $569,666,000
Outstanding Unspecified Public Purpose: $559,828,000
Beginning Outstanding - Unspecified Public Purpose: $531,355,000
Outstanding Unspecified Public Purpose: $481,377,000
Beginning Outstanding - Public Debt for Private Purpose: $79,280,000
Beginning Outstanding - Public Debt for Private Purpose: $79,280,000
Outstanding Nonguaranteed - Industrial Revenue: $79,280,000
Outstanding Nonguaranteed - Industrial Revenue: $79,280,000
Retired Unspecified Public Purpose: $60,604,000
Retired Unspecified Public Purpose: $38,596,000
Issue, Unspecified Public Purpose: $28,757,000
Issue, Unspecified Public Purpose: $10,626,000
- Miscellaneous - Donations From Private Sources: $13,492,000
Donations From Private Sources: $6,183,000
General Revenue - Other: $5,287,000
Interest Earnings: $4,790,000
General Revenue - Other: $3,668,000
Interest Earnings: $2,058,000
Fines and Forfeits: $876,000
Special Assessments: $835,000
Rents: $763,000
Special Assessments: $682,000
Fines and Forfeits: $673,000
Rents: $484,000
Sale of Property: $64,000
Sale of Property: $25,000
- Other Capital Outlay - Elementary and Secondary Education: $15,373,000
Sewerage: $5,693,000
Elementary and Secondary Education: $5,079,000
Water Utilities: $4,047,000
Water Utilities: $1,181,000
Sewerage: $736,000
Parks and Recreation: $421,000
Police Protection: $278,000
General Public Building: $165,000
Local Fire Protection: $148,000
Parks and Recreation: $140,000
Police Protection: $23,000
Health - Other: $23,000
Central Staff Services: $14,000
General Public Building: $10,000
Financial Administration: $8,000
Judicial and Legal Services: $4,000
- Other Funds - Cash and Securities: $320,731,000
Cash and Securities: $253,378,000
- Revenue - Water Utilities: $30,292,000
Water Utilities: $26,426,000
- Sinking Funds - Cash and Securities: $90,794,000
Cash and Securities: $86,107,000
- State Intergovernmental - Education: $188,229,000
Education: $169,966,000
General Local Government Support: $24,966,000
General Local Government Support: $24,102,000
Public Welfare: $7,872,000
Other: $6,659,000
Other: $6,411,000
Highways: $5,389,000
Highways: $4,575,000
Public Welfare: $2,992,000
Water Utilities: $158,000
Housing and Community Development: $41,000
- Tax - Property: $253,709,000
Property: $222,527,000
General Sales and Gross Receipts: $37,196,000
General Sales and Gross Receipts: $25,897,000
Other Selective Sales: $10,423,000
Public Utilities Sales: $7,362,000
Documentary and Stock Transfer: $7,134,000
Public Utilities Sales: $6,881,000
Documentary and Stock Transfer: $6,557,000
Other License: $5,292,000
Other License: $4,640,000
Motor Fuels Sales: $4,324,000
Motor Fuels Sales: $3,807,000
Other: $3,579,000
Motor Vehicle License: $3,000,000
Motor Vehicle License: $2,646,000
- Total Salaries and Wages: $199,716,000
: $177,136,000
- Water Utilities - Interest on Debt: $3,495,000
Interest on Debt: $3,311,000
Stafford County government finances - Cash and Securities in 2020:
- Assistance and Subsidies - Public Welfare, Cash Assistance Programs - Other: $1,230,000
Public Welfare, Cash Assistance Programs - Other: $1,152,000
Public Welfare, Federal Categorical Assistance Programs: $414,000
Public Welfare, Federal Categorical Assistance Programs: $309,000
- Bond Funds - Cash and Securities: $9,241,000
Cash and Securities: $77,000
- Charges - Sewerage: $28,640,000
Sewerage: $25,093,000
Elementary and Secondary Education School Lunch: $6,451,000
Elementary and Secondary Education School Lunch: $5,154,000
Parks and Recreation: $1,767,000
Elementary and Secondary Education School Tuition and Transportation: $1,242,000
Elementary and Secondary Education School Tuition and Transportation: $1,015,000
Parks and Recreation: $828,000
Other: $316,000
Other: $302,000
Elementary and Secondary Education - Other: $106,000
Elementary and Secondary Education - Other: $79,000
- Construction - Elementary and Secondary Education: $18,700,000
Regular Highways: $14,732,000
Elementary and Secondary Education: $9,635,000
Regular Highways: $7,791,000
Sewerage: $6,780,000
General - Other: $4,458,000
General - Other: $3,335,000
Parks and Recreation: $1,605,000
Water Utilities: $125,000
General Public Buildings: $38,000
Health - Other: $10,000
- Current Operations - Elementary and Secondary Education: $319,918,000
Elementary and Secondary Education: $292,045,000
Water Utilities: $32,572,000
Police Protection: $26,030,000
Water Utilities: $23,924,000
Local Fire Protection: $21,299,000
Police Protection: $19,616,000
Local Fire Protection: $14,776,000
Public Welfare - Other: $12,764,000
Public Welfare - Other: $12,579,000
Parks and Recreation: $12,487,000
Financial Administration: $9,997,000
Judicial and Legal Services: $9,757,000
Correctional Institutions: $9,167,000
Judicial and Legal Services: $8,932,000
Financial Administration: $8,680,000
Correctional Institutions: $6,770,000
Sewerage: $6,683,000
Central Staff Services: $6,250,000
Libraries: $5,566,000
Libraries: $5,238,000
Central Staff Services: $5,091,000
Protective Inspection and Regulation - Other: $4,743,000
General Public Buildings: $4,557,000
Regular Highways: $4,048,000
General Public Buildings: $3,491,000
Health - Other: $1,949,000
Sewerage: $1,707,000
Health - Other: $1,156,000
General - Other: $1,156,000
General - Other: $1,089,000
Parks and Recreation: $856,000
Regular Highways: $687,000
Natural Resources - Other: $171,000
Natural Resources - Other: $163,000
Public Welfare, Vendor Payments for Other Purposes: $64,000
Public Welfare, Vendor Payments for Other Purposes: $60,000
- Federal Intergovernmental - Education: $5,071,000
Education: $4,067,000
Public Welfare: $3,981,000
General Local Government Support: $1,554,000
Highways: $364,000
Highways: $341,000
Other: $215,000
- General - Interest on Debt: $17,294,000
Interest on Debt: $16,401,000
- Intergovernmental to Local - Other - Transit Utilities: $2,870,000
Other - Transit Utilities: $2,345,000
Other - Elementary and Secondary Education: $779,000
Other - Elementary and Secondary Education: $616,000
- Local Intergovernmental - Education: $1,734,000
Education: $1,273,000
- Long Term Debt - Beginning Outstanding - Unspecified Public Purpose: $569,666,000
Outstanding Unspecified Public Purpose: $559,828,000
Beginning Outstanding - Unspecified Public Purpose: $531,355,000
Outstanding Unspecified Public Purpose: $481,377,000
Beginning Outstanding - Public Debt for Private Purpose: $79,280,000
Beginning Outstanding - Public Debt for Private Purpose: $79,280,000
Outstanding Nonguaranteed - Industrial Revenue: $79,280,000
Outstanding Nonguaranteed - Industrial Revenue: $79,280,000
Retired Unspecified Public Purpose: $60,604,000
Retired Unspecified Public Purpose: $38,596,000
Issue, Unspecified Public Purpose: $28,757,000
Issue, Unspecified Public Purpose: $10,626,000
- Miscellaneous - Donations From Private Sources: $13,492,000
Donations From Private Sources: $6,183,000
General Revenue - Other: $5,287,000
Interest Earnings: $4,790,000
General Revenue - Other: $3,668,000
Interest Earnings: $2,058,000
Fines and Forfeits: $876,000
Special Assessments: $835,000
Rents: $763,000
Special Assessments: $682,000
Fines and Forfeits: $673,000
Rents: $484,000
Sale of Property: $64,000
Sale of Property: $25,000
- Other Capital Outlay - Elementary and Secondary Education: $15,373,000
Sewerage: $5,693,000
Elementary and Secondary Education: $5,079,000
Water Utilities: $4,047,000
Water Utilities: $1,181,000
Sewerage: $736,000
Parks and Recreation: $421,000
Police Protection: $278,000
General Public Building: $165,000
Local Fire Protection: $148,000
Parks and Recreation: $140,000
Police Protection: $23,000
Health - Other: $23,000
Central Staff Services: $14,000
General Public Building: $10,000
Financial Administration: $8,000
Judicial and Legal Services: $4,000
- Other Funds - Cash and Securities: $320,731,000
Cash and Securities: $253,378,000
- Revenue - Water Utilities: $30,292,000
Water Utilities: $26,426,000
- Sinking Funds - Cash and Securities: $90,794,000
Cash and Securities: $86,107,000
- State Intergovernmental - Education: $188,229,000
Education: $169,966,000
General Local Government Support: $24,966,000
General Local Government Support: $24,102,000
Public Welfare: $7,872,000
Other: $6,659,000
Other: $6,411,000
Highways: $5,389,000
Highways: $4,575,000
Public Welfare: $2,992,000
Water Utilities: $158,000
Housing and Community Development: $41,000
- Tax - Property: $253,709,000
Property: $222,527,000
General Sales and Gross Receipts: $37,196,000
General Sales and Gross Receipts: $25,897,000
Other Selective Sales: $10,423,000
Public Utilities Sales: $7,362,000
Documentary and Stock Transfer: $7,134,000
Public Utilities Sales: $6,881,000
Documentary and Stock Transfer: $6,557,000
Other License: $5,292,000
Other License: $4,640,000
Motor Fuels Sales: $4,324,000
Motor Fuels Sales: $3,807,000
Other: $3,579,000
Motor Vehicle License: $3,000,000
Motor Vehicle License: $2,646,000
- Total Salaries and Wages: $199,716,000
: $177,136,000
- Water Utilities - Interest on Debt: $3,495,000
Interest on Debt: $3,311,000
Supplemental Security Income (SSI) in 2006:
- Total number of recipients: 722
- Number of aged recipients: 104
- Number of blind and disabled recipients: 618
- Number of recipients under 18: 133
- Number of recipients between 18 and 64: 434
- Number of recipients older than 64: 155
- Number of recipients also receiving OASDI: 208
- Amount of payments (thousands of dollars): 303
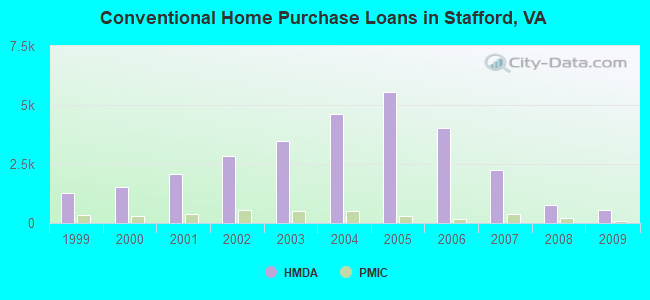
| Home Mortgage Disclosure Act Aggregated Statistics For Year 2009 (Based on 23 full tracts) | ||||||||||||||
| A) FHA, FSA/RHS & VA Home Purchase Loans | B) Conventional Home Purchase Loans | C) Refinancings | D) Home Improvement Loans | E) Loans on Dwellings For 5+ Families | F) Non-occupant Loans on < 5 Family Dwellings (A B C & D) | G) Loans On Manufactured Home Dwelling (A B C & D) | ||||||||
|---|---|---|---|---|---|---|---|---|---|---|---|---|---|---|
| Number | Average Value | Number | Average Value | Number | Average Value | Number | Average Value | Number | Average Value | Number | Average Value | Number | Average Value | |
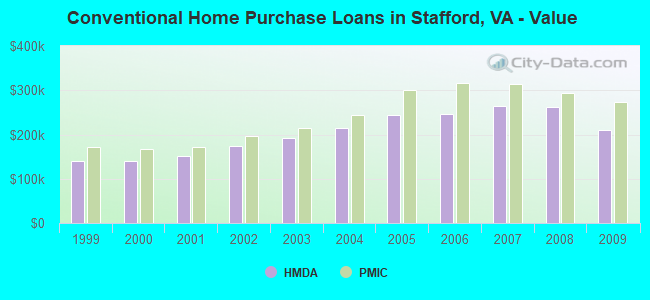
| LOANS ORIGINATED | 1,456 | $260,216 | 531 | $210,395 | 2,765 | $263,115 | 150 | $73,253 | 0 | $0 | 182 | $157,330 | 10 | $86,800 |
| APPLICATIONS APPROVED, NOT ACCEPTED | 89 | $272,978 | 40 | $206,625 | 203 | $261,650 | 23 | $40,609 | 0 | $0 | 18 | $175,500 | 3 | $50,333 |
| APPLICATIONS DENIED | 136 | $239,507 | 68 | $186,338 | 1,367 | $286,675 | 108 | $79,870 | 1 | $1,950,000 | 83 | $183,711 | 12 | $94,583 |
| APPLICATIONS WITHDRAWN | 178 | $248,899 | 96 | $213,552 | 956 | $288,445 | 44 | $109,227 | 0 | $0 | 47 | $164,532 | 6 | $132,167 |
| FILES CLOSED FOR INCOMPLETENESS | 19 | $213,737 | 16 | $248,812 | 187 | $278,428 | 12 | $217,333 | 0 | $0 | 18 | $216,667 | 1 | $118,000 |
| Private Mortgage Insurance Companies Aggregated Statistics For Year 2009 (Based on 22 full tracts) | ||||||
| A) Conventional Home Purchase Loans | B) Refinancings | C) Non-occupant Loans on < 5 Family Dwellings (A & B) | ||||
|---|---|---|---|---|---|---|
| Number | Average Value | Number | Average Value | Number | Average Value | |
| LOANS ORIGINATED | 76 | $273,145 | 26 | $323,500 | 3 | $136,000 |
| APPLICATIONS APPROVED, NOT ACCEPTED | 28 | $334,500 | 20 | $310,150 | 2 | $101,000 |
| APPLICATIONS DENIED | 12 | $258,083 | 5 | $373,200 | 2 | $122,000 |
| APPLICATIONS WITHDRAWN | 2 | $147,500 | 2 | $195,500 | 0 | $0 |
| FILES CLOSED FOR INCOMPLETENESS | 3 | $361,667 | 0 | $0 | 0 | $0 |
| Most common first names in Stafford County, VA among deceased individuals | ||
| Name | Count | Lived (average) |
|---|---|---|
| James | 176 | 71.8 years |
| Mary | 172 | 77.9 years |
| John | 165 | 74.4 years |
| William | 157 | 73.2 years |
| Robert | 136 | 71.9 years |
| George | 81 | 74.4 years |
| Margaret | 80 | 76.9 years |
| Charles | 80 | 70.9 years |
| Thomas | 60 | 71.5 years |
| Joseph | 60 | 73.3 years |
| Most common last names in Stafford County, VA among deceased individuals | ||
| Last name | Count | Lived (average) |
|---|---|---|
| Sullivan | 76 | 77.5 years |
| Newton | 60 | 76.4 years |
| Johnson | 58 | 75.5 years |
| Smith | 51 | 73.3 years |
| Brown | 50 | 75.4 years |
| Shelton | 49 | 80.1 years |
| Payne | 46 | 73.1 years |
| Williams | 46 | 73.6 years |
| Jones | 44 | 77.5 years |
| Jett | 32 | 76.7 years |
| Businesses in Stafford County, VA | ||||
| Name | Count | Name | Count | |
|---|---|---|---|---|
| 7-Eleven | 12 | Kincaid | 1 | |
| ALDI | 1 | Little Caesars Pizza | 1 | |
| AT&T | 3 | Lowe's | 1 | |
| Advance Auto Parts | 2 | Marriott | 1 | |
| Arby's | 2 | MasterBrand Cabinets | 5 | |
| Baskin-Robbins | 1 | McDonald's | 8 | |
| Best Western | 1 | Nike | 2 | |
| Blockbuster | 2 | Nissan | 1 | |
| Budget Car Rental | 1 | Papa John's Pizza | 3 | |
| Burger King | 2 | Penske | 2 | |
| CVS | 5 | PetSmart | 1 | |
| Chick-Fil-A | 1 | Pizza Hut | 2 | |
| Clarion | 1 | Popeyes | 1 | |
| Comfort Inn | 1 | Quality | 2 | |
| Comfort Suites | 1 | Quiznos | 1 | |
| Cricket Wireless | 4 | RadioShack | 2 | |
| Curves | 3 | Rite Aid | 3 | |
| DHL | 2 | Ruby Tuesday | 1 | |
| Dairy Queen | 1 | Sleep Inn | 1 | |
| Days Inn | 1 | Starbucks | 3 | |
| Domino's Pizza | 3 | Subway | 8 | |
| Dunkin Donuts | 1 | Super 8 | 2 | |
| Famous Footwear | 1 | T-Mobile | 4 | |
| FedEx | 16 | Taco Bell | 2 | |
| GNC | 1 | Target | 1 | |
| GameStop | 1 | Toyota | 1 | |
| Giant | 3 | Travelodge | 1 | |
| H&R Block | 4 | True Value | 1 | |
| Hardee's | 1 | U-Haul | 7 | |
| Hilton | 1 | UPS | 17 | |
| Holiday Inn | 3 | Waffle House | 1 | |
| Home Depot | 1 | Walmart | 3 | |
| Honda | 1 | Wendy's | 2 | |
| Howard Johnson | 1 | Wingate | 2 | |
| Justice | 1 | YMCA | 1 | |
| KFC | 1 | |||
Stafford County on our top lists:
- #8 on the list of "Top 101 counties with the largest number of children under 18 without health insurance coverage in 2000 (pop. 50,000+)"
- #18 on the list of "Top 101 counties with the lowest number of deaths per 1000 residents 2007-2013 (pop. 50,000+)"
- #33 on the list of "Top 101 counties with the highest percentage of residents relocating from other counties between 2010 and 2011 (pop. 50,000+)"
- #34 on the list of "Top 101 counties with the highest percentage of residents relocating to other counties in 2011 (pop. 50,000+)"
- #35 on the list of "Top 101 counties with the highest percentage of residents relocating from foreign countries between 2010 and 2011 (pop. 50,000+)"
- #51 on the list of "Top 101 counties with the largest number of children under 18 without health insurance coverage in 2000"
- #56 on the list of "Top 101 counties with the highest percentage of residents relocating from foreign countries between 2010 and 2011"
- #60 on the list of "Top 101 counties with the lowest number of deaths per 1000 residents 2007-2013"
- #62 on the list of "Top 101 counties with the highest percentage of residents relocating to foreign countries in 2011 (pop. 50,000+)"
- #80 on the list of "Top 101 counties with the highest percentage of residents relocating from other counties between 2010 and 2011"
- #90 on the list of "Top 101 counties with the highest percentage of residents relocating to foreign countries in 2011"
- #95 on the list of "Top 101 counties with the highest percentage of residents relocating to other counties in 2011"