Ste. Genevieve County, Missouri (MO)
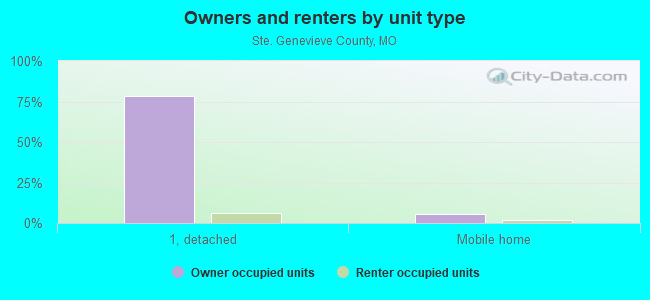
County owner-occupied free and clear houses and condos in 2010: 2,253
County owner-occupied houses and condos in 2000: 5,423
Renter-occupied apartments: 1,307 (it was 1,163 in 2000)
| % of renters here: | 18% |
| State: | 31% |
Land area: 502 sq. mi.
Water area: 6.5 sq. mi.
Population density: 37 people per square mile (low).
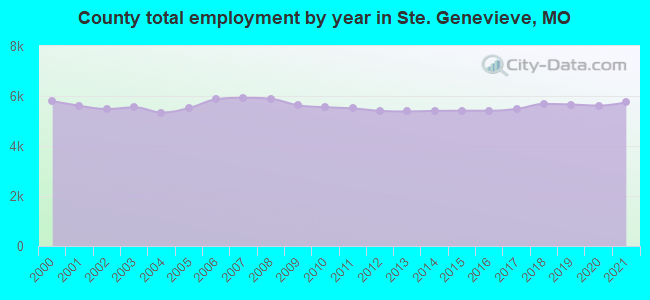
Industries providing employment: Educational, health and social services (23.3%), Manufacturing (16.4%), Construction (10.7%).
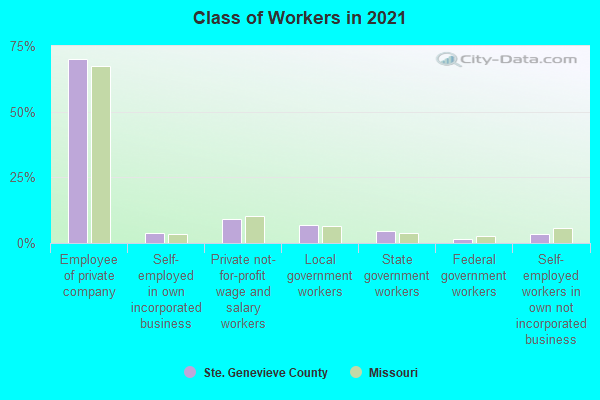
Type of workers:
- Private wage or salary: 82%
- Government: 15%
- Self-employed, not incorporated: 3%
- Unpaid family work: 0%
- OSM Map
- General Map
- Google Map
- MSN Map

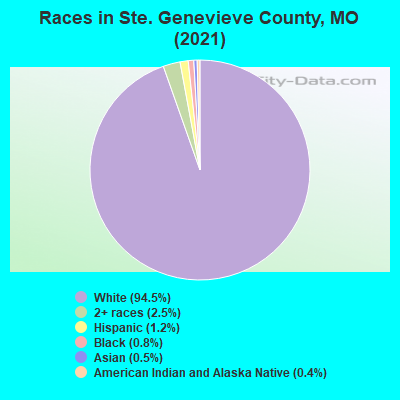
- 17,28193.6%White Non-Hispanic Alone
- 5332.9%Two or more races
- 2701.5%Black Non-Hispanic Alone
- 2581.4%Hispanic or Latino
- 980.5%Asian alone
- 170.09%American Indian and Alaska Native alone
- 100.05%Some other race alone
| Median resident age: | 44.3 years |
| Missouri median age: | 39.1 years |
| Males: 9,559 | |
| Females: 9,005 |

 | Missouri North/South Dividing Line (13 replies) |
| Cities that are most like St. Louis (251 replies) |
| How do you feel being a chump? (126 replies) |
| In what ways is Southern Missouri southern, and in what ways is it not? (340 replies) |
| Regards to MO being a Confederate state and Southern. (145 replies) |
| Imo's Pizza: St. Louis' Inexplicably Addictive Pie (86 replies) |
| Ste. Genevieve County: | 2.0 people |
| Missouri: | 2 people |
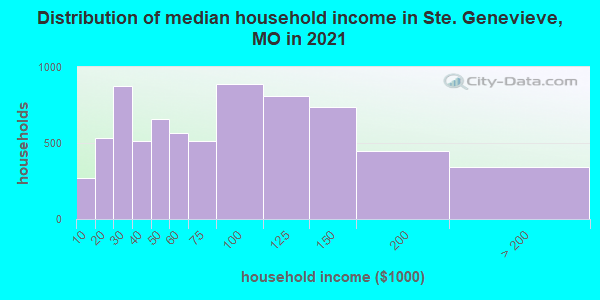
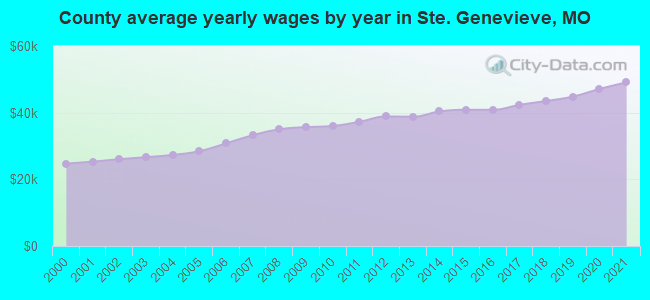
Estimated median household income in 2022: $60,185 ($39,200 in 1999)
| This county: | $60,185 |
| Missouri: | $64,811 |
Median contract rent in 2022 for apartments: $565 (lower quartile is $452, upper quartile is $685)
| This county: | $565 |
| State: | $757 |
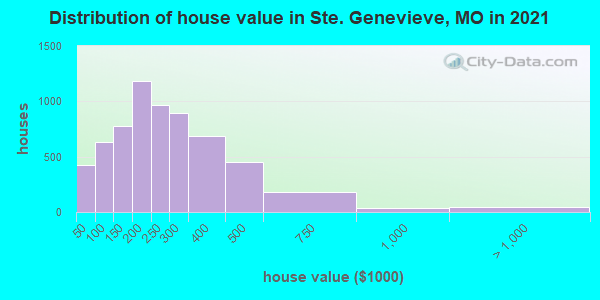
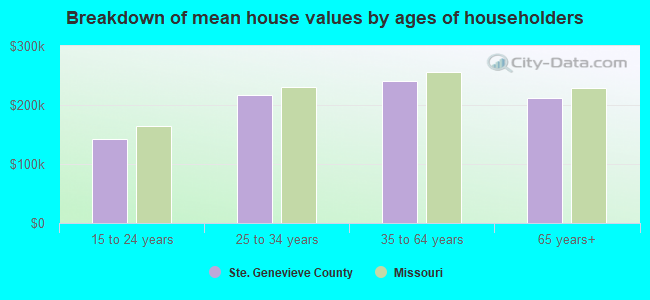
Estimated median house or condo value in 2022: $219,203 (it was $84,400 in 2000)
| Ste. Genevieve: | $219,203 |
| Missouri: | $221,200 |
Median monthly housing costs for homes and condos with a mortgage: $1,181
Median monthly housing costs for units without a mortgage: $429
Institutionalized population: 234
Crime in 2021 (reported by the sheriff's office or county police, not the county total):
- Murders: 0
- Rapes: 9
- Robberies: 0
- Assaults: 33
- Burglaries: 15
- Thefts: 68
- Auto thefts: 28
Crime in 2020 (reported by the sheriff's office or county police, not the county total):
- Murders: 0
- Rapes: 7
- Robberies: 0
- Assaults: 47
- Burglaries: 20
- Thefts: 75
- Auto thefts: 38
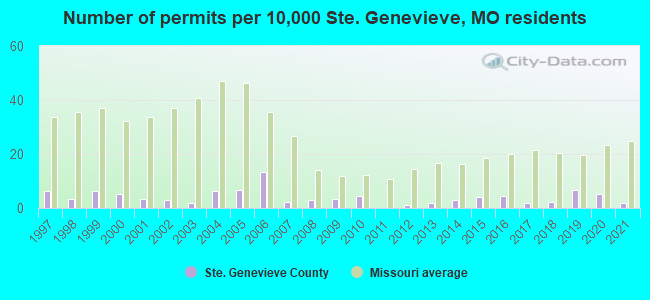
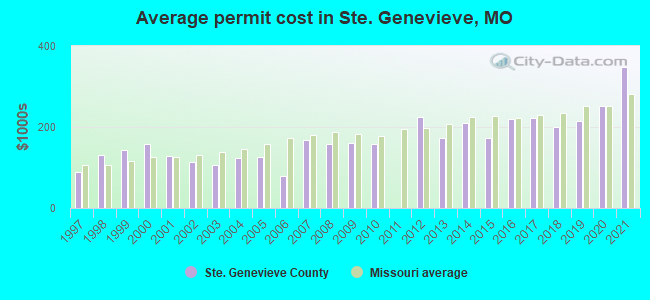
Single-family new house construction building permits:
- 2022: 6 buildings, average cost: $257,900
- 2021: 3 buildings, average cost: $346,500
- 2020: 9 buildings, average cost: $251,900
- 2019: 12 buildings, average cost: $214,700
- 2018: 4 buildings, average cost: $199,300
- 2017: 3 buildings, average cost: $221,800
- 2016: 8 buildings, average cost: $219,400
- 2015: 7 buildings, average cost: $171,800
- 2014: 5 buildings, average cost: $208,800
- 2013: 3 buildings, average cost: $172,000
- 2012: 2 buildings, average cost: $223,800
- 2011: 0 buildings
- 2010: 8 buildings, average cost: $158,200
- 2009: 6 buildings, average cost: $160,200
- 2008: 5 buildings, average cost: $158,900
- 2007: 4 buildings, average cost: $168,800
- 2006: 24 buildings, average cost: $79,300
- 2005: 12 buildings, average cost: $126,100
- 2004: 11 buildings, average cost: $124,000
- 2003: 3 buildings, average cost: $106,700
- 2002: 5 buildings, average cost: $114,000
- 2001: 6 buildings, average cost: $128,700
- 2000: 9 buildings, average cost: $159,100
- 1999: 11 buildings, average cost: $142,500
- 1998: 6 buildings, average cost: $132,000
- 1997: 11 buildings, average cost: $90,000
Median real estate property taxes paid for housing units with mortgages in 2022: $1,308 (0.6%)
Median real estate property taxes paid for housing units with no mortgage in 2022: $1,367 (0.6%)

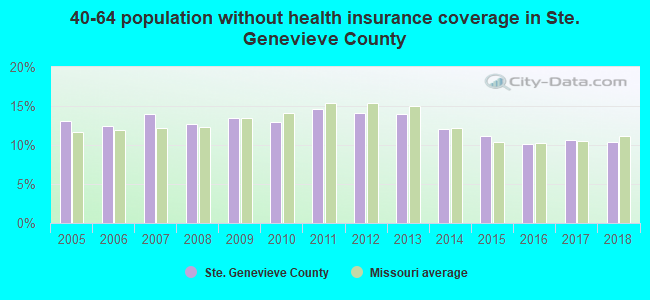
| Ste. Genevieve County: | 9.5% |
| Missouri: | 13.2% |
Median age of residents in 2022: 44.3 years old
(Males: 42.4 years old, Females: 46.3 years old)
(Median age for: White residents: 44.4 years old, Black residents: 56.5 years old, Asian residents: 57.7 years old, Hispanic or Latino residents: 28.0 years old, Other race residents: 69.9 years old)
Fair market rent in 2006 for a 1-bedroom apartment in Ste. Genevieve County is $381 a month.
Fair market rent for a 2-bedroom apartment is $500 a month.
Fair market rent for a 3-bedroom apartment is $639 a month.
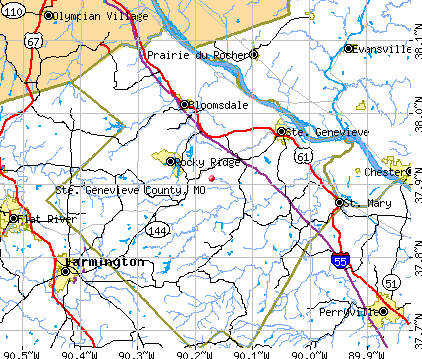
Cities in this county include: Ste. Genevieve, Grayhawk, Bloomsdale, St. Mary, Ozora, Weingarten.
2023 air pollution in Ste. Genevieve County:
Ozone (1-hour): 0.041 ppm (standard limit: 0.12 ppm). Above U.S. average.
Neighboring counties: Alleghany County, Virginia  , Bates County
  , Summers County, West Virginia , King William County, Virginia , St. Clair County , White County, Illinois .
| Here: | 2.7% |
| Missouri: | 2.8% |
Current college students: 496
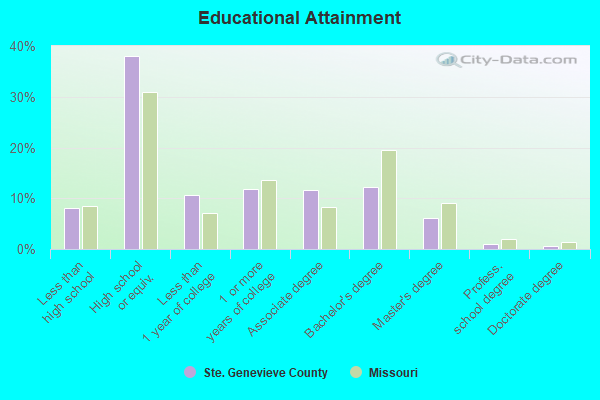
People 25 years of age or older with a high school degree or higher: 91.5%
People 25 years of age or older with a bachelor's degree or higher: 16.4%
Number of foreign born residents: 93 (86.9% naturalized citizens)
| Ste. Genevieve County: | 0.5% |
| Whole state: | 4.1% |
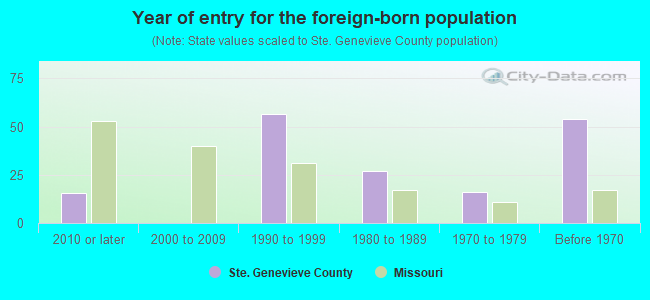
- Year of entry for the foreign-born population
- 142010 or later
- 02000 to 2009
- 501990 to 1999
- 271980 to 1989
- 161970 to 1979
- 54Before 1970
Mean travel time to work (commute): minutes
Percentage of county residents living and working in this county: 97.9%
Housing units in structures:
- One, detached: 6,726
- One, attached: 27
- Two: 115
- 3 or 4: 132
- 5 to 9: 94
- 10 to 19: 195
- 20 to 49: 79
- 50 or more: 57
- Mobile homes: 927
Housing units in Ste. Genevieve County with a mortgage: 3,179 (206 second mortgage, 0 home equity loan, 150 both second mortgage and home equity loan)
Houses without a mortgage: 327
| Here: | 0.9% with mortgage |
| State: | 98.0% with mortgage |
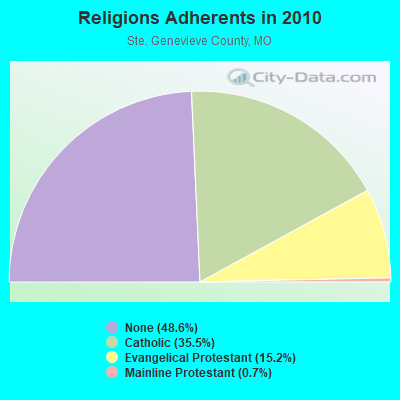
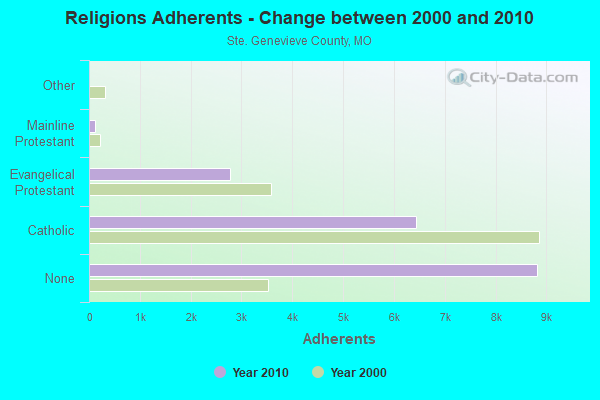
Religion statistics for Ste. Genevieve County
| Religion | Adherents | Congregations |
|---|---|---|
| Catholic | 6,434 | 9 |
| Evangelical Protestant | 2,765 | 15 |
| Mainline Protestant | 126 | 2 |
| Other | 1 | 1 |
| None | 8,819 | - |
Source: Clifford Grammich, Kirk Hadaway, Richard Houseal, Dale E.Jones, Alexei Krindatch, Richie Stanley and Richard H.Taylor. 2012. 2010 U.S.Religion Census: Religious Congregations & Membership Study. Association of Statisticians of American Religious Bodies. Jones, Dale E., et al. 2002. Congregations and Membership in the United States 2000. Nashville, TN: Glenmary Research Center.
Food Environment Statistics:
| Ste. Genevieve County: | 2.81 / 10,000 pop. |
| State: | 1.88 / 10,000 pop. |
| This county: | 1.12 / 10,000 pop. |
| Missouri: | 0.60 / 10,000 pop. |
| Ste. Genevieve County: | 6.17 / 10,000 pop. |
| Missouri: | 4.34 / 10,000 pop. |
| This county: | 7.86 / 10,000 pop. |
| State: | 7.37 / 10,000 pop. |
| Ste. Genevieve County: | 8.9% |
| Missouri: | 8.8% |
| Ste. Genevieve County: | 31.0% |
| State: | 29.6% |
| Here: | 11.0% |
| State: | 13.5% |
Agriculture in Ste. Genevieve County:
Average size of farms: 272 acresAverage value of agricultural products sold per farm: $26,312
Average value of crops sold per acre for harvested cropland: $115.72
The value of nursery, greenhouse, floriculture, and sod as a percentage of the total market value of agricultural products sold: 1.50%
The value of livestock, poultry, and their products as a percentage of the total market value of agricultural products sold: 55.50%
Average total farm production expenses per farm: $24,735
Harvested cropland as a percentage of land in farms: 37.13%
Irrigated harvested cropland as a percentage of land in farms: 0.05%
Average market value of all machinery and equipment per farm: $37,723
The percentage of farms operated by a family or individual: 87.59%
Average age of principal farm operators: 57 years
Average number of cattle and calves per 100 acres of all land in farms: 14.46
Milk cows as a percentage of all cattle and calves: 0.65%
Corn for grain: 12079 harvested acres
All wheat for grain: 4406 harvested acres
Soybeans for beans: 19746 harvested acres
Vegetables: 17 harvested acres
Land in orchards: 142 acres
Earthquake activity:
Ste. Genevieve County-area historical earthquake activity is significantly above Missouri state average. It is 357% greater than the overall U.S. average.On 4/18/2008 at 09:36:59, a magnitude 5.4 (5.1 MB, 4.8 MS, 5.4 MW, 5.2 MW, Class: Moderate, Intensity: VI - VII) earthquake occurred 129.9 miles away from Ste. Genevieve County center
On 9/26/1990 at 13:18:51, a magnitude 5.0 (4.7 MB, 4.8 LG, 5.0 LG, Depth: 7.7 mi) earthquake occurred 62.0 miles away from the county center
On 4/18/2008 at 09:36:59, a magnitude 5.2 (5.2 MW, Depth: 8.9 mi) earthquake occurred 129.9 miles away from the county center
On 5/4/1991 at 01:18:54, a magnitude 5.0 (4.4 MB, 4.6 LG, 5.0 LG, Depth: 3.1 mi) earthquake occurred 94.9 miles away from the county center
On 6/10/1987 at 23:48:54, a magnitude 5.1 (4.9 MB, 4.4 MS, 4.6 MS, 5.1 LG) earthquake occurred 139.2 miles away from Ste. Genevieve County center
On 6/18/2002 at 17:37:15, a magnitude 5.0 (4.3 MB, 4.6 MW, 5.0 LG) earthquake occurred 130.6 miles away from the county center
Magnitude types: regional Lg-wave magnitude (LG), body-wave magnitude (MB), surface-wave magnitude (MS), moment magnitude (MW)
Most recent natural disasters:
- Missouri Covid-19 Pandemic, Incident Period: January 20, 2020, FEMA Id: 4490, Natural disaster type: Other
- Missouri Severe Storms, Tornadoes, And Flooding, Incident Period: April 29, 2019, FEMA Id: 4451, Natural disaster type: Storm, Tornado, Flood
- Missouri Severe Storms, Straight-line Winds, And Flooding, Incident Period: March 11, 2019 - April 16, 2019, FEMA Id: 4435, Natural disaster type: Storm, Flood, Wind
- Missouri Severe Storms, Tornadoes, Straight-line Winds, And Flooding, Incident Period: April 28, 2017 - May 11, 2017, FEMA Id: 4317, Natural disaster type: Storm, Tornado, Flood, Wind
- Missouri Severe Storms, Tornadoes, Straight-line Winds, and Flooding, Incident Period: December 23, 2015 to January 09, 2016, Major Disaster (Presidential) Declared DR-4250: January 21, 2016, FEMA Id: 4250, Natural disaster type: Storm, Tornado, Flood, Wind
- Missouri Severe Storms, Tornadoes, Straight-line Winds, and Flooding, Incident Period: December 22, 2015 to January 09, 2016, Emergency Declared EM-3374: January 02, 2016, FEMA Id: 3374, Natural disaster type: Storm, Tornado, Flood, Wind
- Missouri Severe Storms, Tornadoes, Straight-line Winds, and Flooding, Incident Period: May 15, 2015 to July 27, 2015, Major Disaster (Presidential) Declared DR-4238: August 07, 2015, FEMA Id: 4238, Natural disaster type: Storm, Tornado, Flood, Wind
The number of natural disasters in Ste. Genevieve County (7) is smaller than the US average (15).
Major Disasters (Presidential) Declared: 2
Emergencies Declared: 1
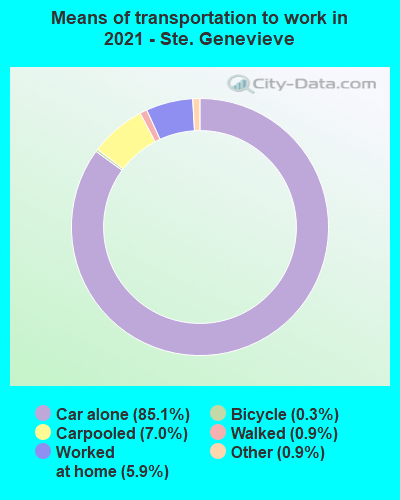
Means of transportation to work:
- Drove a car alone: 4,973 (81.0%)
- Carpooled: 407 (6.6%)
- Bus: 14 (0.2%)
- Taxicab, motorcycle, or other means: 38 (0.6%)
- Bicycle: 15 (0.2%)
- Walked: 66 (1.1%)
- Worked at home: 576 (9.4%)
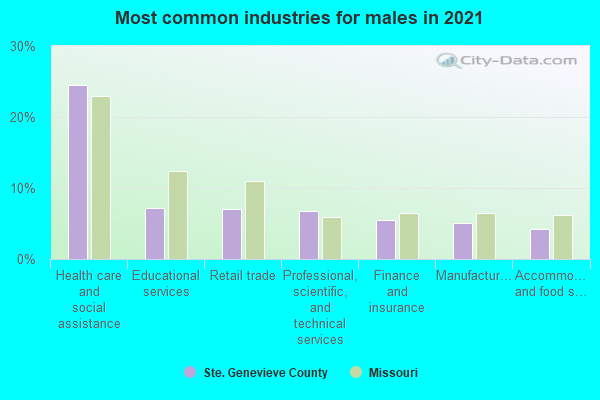
- Health care and social assistance (24%)
- Manufacturing (9%)
- Educational services (7%)
- Retail trade (6%)
- Professional, scientific, and technical services (5%)
- Finance and insurance (4%)
- Accommodation and food services (4%)
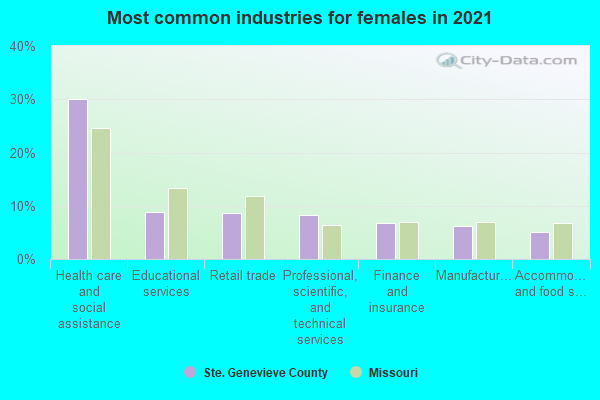
- Health care and social assistance (31%)
- Manufacturing (11%)
- Educational services (9%)
- Retail trade (7%)
- Professional, scientific, and technical services (6%)
- Finance and insurance (5%)
- Accommodation and food services (5%)
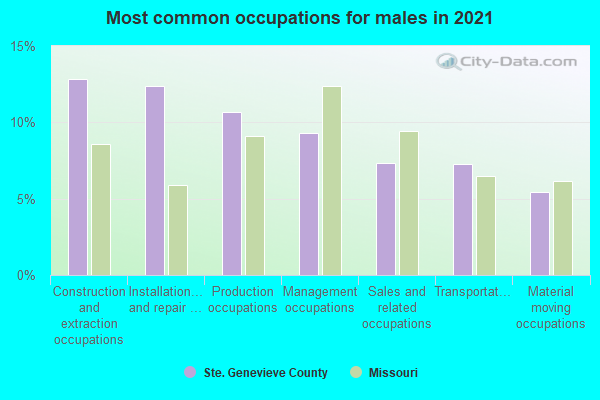
- Construction and extraction occupations (14%)
- Installation, maintenance, and repair occupations (13%)
- Production occupations (11%)
- Management occupations (9%)
- Sales and related occupations (8%)
- Transportation occupations (6%)
- Material moving occupations (6%)
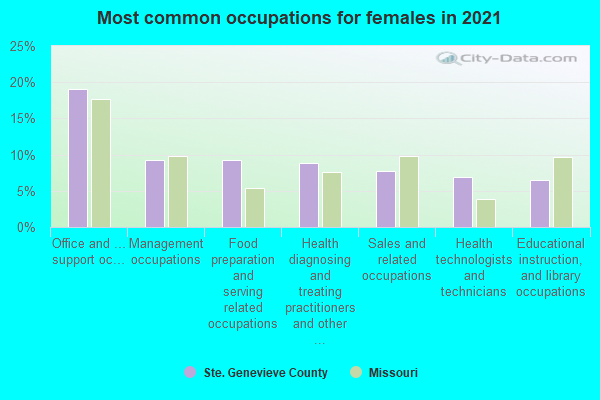
- Office and administrative support occupations (23%)
- Food preparation and serving related occupations (9%)
- Health diagnosing and treating practitioners and other technical occupations (8%)
- Sales and related occupations (8%)
- Management occupations (7%)
- Healthcare support occupations (6%)
- Business and financial operations occupations (6%)
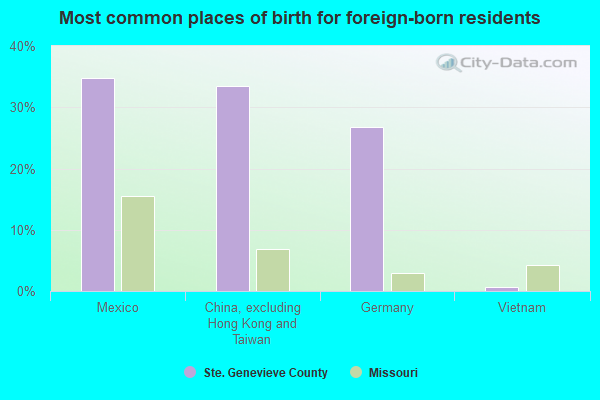
- China, excluding Hong Kong and Taiwan (52%)
- Germany (39%)
- Denmark (0%)
- Ireland (0%)
- Norway (0%)
- Sweden (0%)
- United Kingdom, excluding England and Scotland (0%)
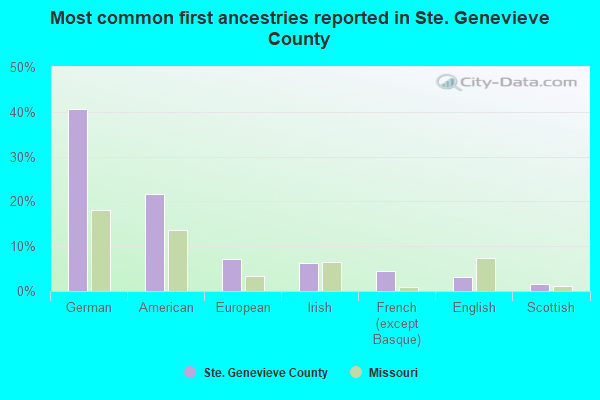
- German (39%)
- American (22%)
- European (6%)
- Irish (6%)
- French (except Basque) (4%)
- English (3%)
- Scottish (2%)
People in group quarters in Ste. Genevieve County, Missouri in 2010:
- 165 people in nursing facilities/skilled-nursing facilities
- 69 people in local jails and other municipal confinement facilities
- 26 people in residential treatment centers for adults
- 16 people in group homes intended for adults
People in group quarters in Ste. Genevieve County, Missouri in 2000:
- 221 people in nursing homes
- 87 people in local jails and other confinement facilities (including police lockups)
- 18 people in other nonhousehold living situations
- 15 people in other noninstitutional group quarters
- 13 people in homes for the mentally retarded
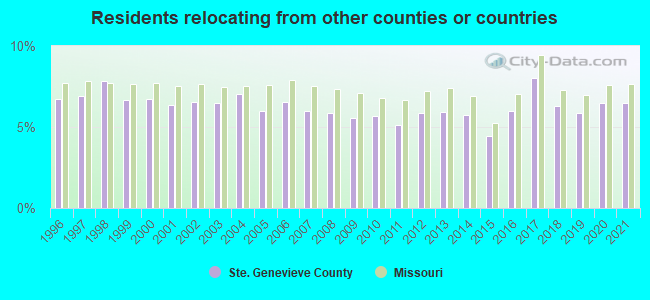
6.49% of this county's 2021 resident taxpayers lived in other counties in 2020 ($56,389 average adjusted gross income)
| Here: | 6.49% |
| Missouri average: | 7.67% |
10 or fewer of this county's residents moved from foreign countries.
5.45% relocated from other counties in Missouri ($46,002 average AGI)
1.04% relocated from other states ($10,387 average AGI)
Ste. Genevieve County: 1.04% Missouri average: 3.04%
Top counties from which taxpayers relocated into this county between 2020 and 2021:
| from Jefferson County, MO | |
| from St. Francois County, MO | |
| from St. Louis County, MO | |
| from Perry County, MO |
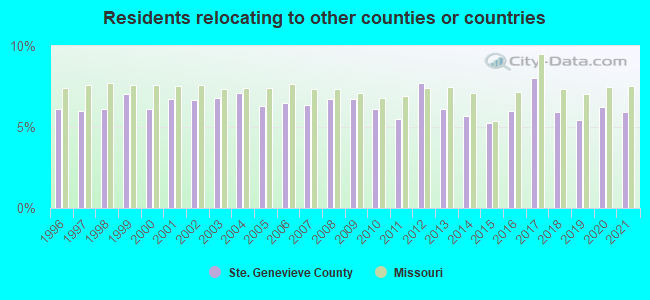
5.93% of this county's 2020 resident taxpayers moved to other counties in 2021 ($40,323 average adjusted gross income)
| Here: | 5.93% |
| Missouri average: | 7.51% |
10 or fewer of this county's residents moved to foreign countries.
5.17% relocated to other counties in Missouri ($33,244 average AGI)
0.77% relocated to other states ($7,077 average AGI)
Ste. Genevieve County: 0.77% Missouri average: 2.88%
Top counties to which taxpayers relocated from this county between 2020 and 2021:
| to St. Francois County, MO | |
| to Jefferson County, MO | |
| to Perry County, MO | |
| to St. Louis County, MO |
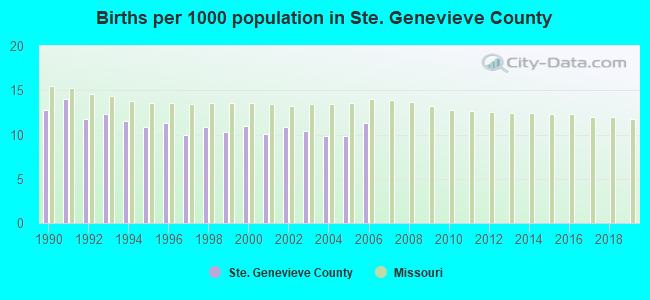
Births per 1000 population from 1990 to 1999: 11.6
Births per 1000 population from 2000 to 2006: 10.5
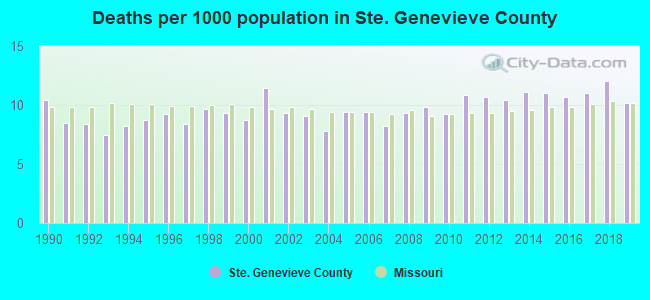
Deaths per 1000 population from 1990 to 1999: 8.8
Deaths per 1000 population from 2000 to 2009: 9.2
Deaths per 1000 population from 2010 to 2020: 10.8
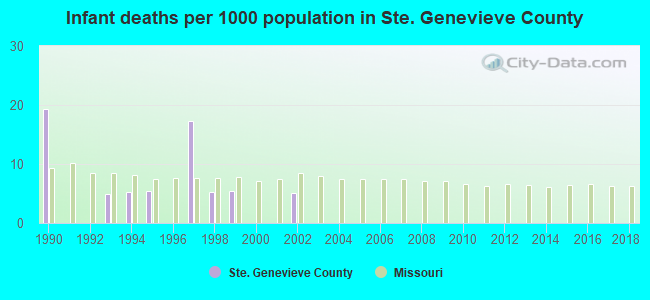
Infant deaths per 1000 live births from 1990 to 1999: 6.3
Infant deaths per 1000 live births from 2000 to 2006: 0.7
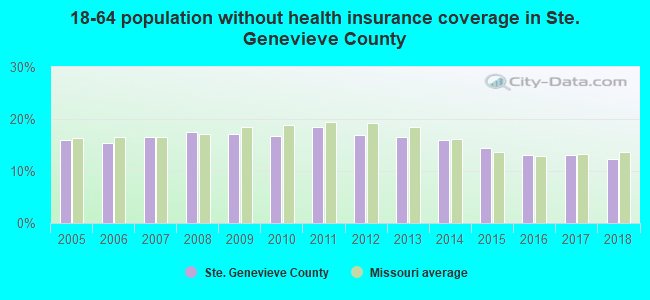
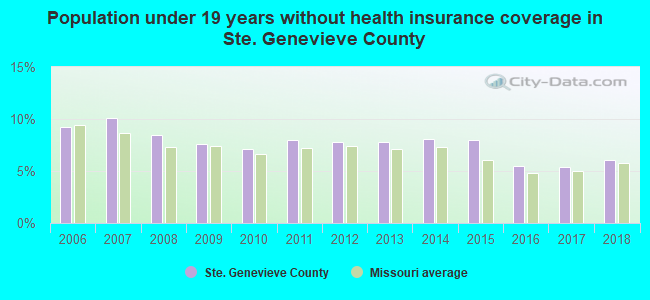
Persons under 19 years old without health insurance coverage in 2018: 6.1%

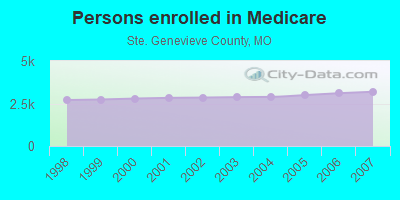
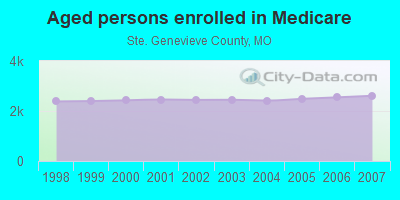
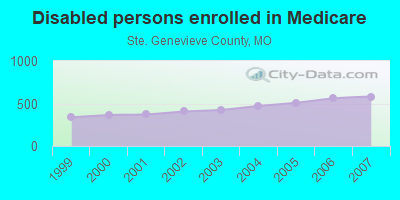
Persons enrolled in hospital insurance and/or supplemental medical insurance (Medicare) in July 1, 2007: 3,190 (2,608 aged, 582 disabled)
Children under 18 without health insurance coverage in 2007: 393 (9%)
Most common underlying causes of death in Ste. Genevieve County, Missouri in 1999 - 2019:
- Acute myocardial infarction, unspecified (401)
- Atherosclerotic heart disease (192)
- Bronchus or lung, unspecified - Malignant neoplasms (180)
- Chronic obstructive pulmonary disease, unspecified (109)
- Unspecified dementia (56)
- Congestive heart failure (22)
- Alzheimer disease, unspecified (20)
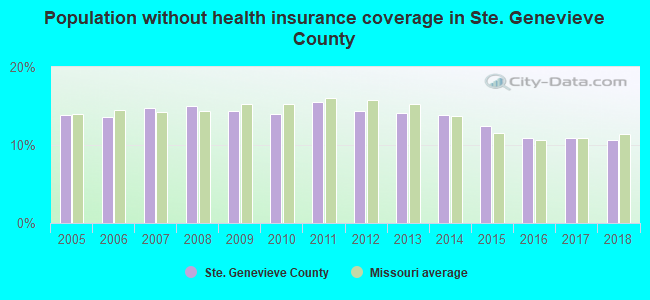
Population without health insurance coverage in 2000: 7%
Children under 18 without health insurance coverage in 2000: 5%
Short term general hospital admissions per 100,000 population in 2004: 8,251
Short term general hospital beds per 100,000 population in 2004: 192
Emergency room visits per 100,000 population in 2004: 30,119
General practice office based MDs per 100,000 population in 2005: 978
Medical specialist MDs per 100,000 population in 2005: 753
Total births per 100,000 population, July 2005 - July 2006 : 23
Total deaths per 100,000 population, July 2005 - July 2006: 55
Limited-service eating places per 100,000 population in 2005 : 6
Suicides per 1,000,000 population from 2000 to 2006: 167.8. This is more than state average.
Household type by relationship:
Households: 18,564- Male householders: 4,089 (979 living alone), Female householders: 3,199 (896 living alone)
4,132 spouses (4,115 opposite-sex spouses), 483 unmarried partners, (483 opposite-sex unmarried partners), 4,894 children (4,476 natural, 73 adopted, 349 stepchildren), 490 grandchildren, 145 brothers or sisters, 148 parents, 111 foster children, 238 other relatives, 233 non-relatives
- In group quarters: 373
Size of family households: 2,512 2-persons, 1,038 3-persons, 758 4-persons, 513 5-persons, 138 6-persons, 91 7-or-more-persons.
Size of nonfamily households: 1,873 1-person, 307 2-persons, 59 3-persons.
2,294 married couples with children.
950 single-parent households (491 men, 459 women).
98.4% of residents of Ste. Genevieve speak English at home.
0.7% of residents speak Spanish at home (83% speak English very well, 17% speak English not well).
0.5% of residents speak other Indo-European language at home (45% speak English very well, 50% speak English well, 5% speak English not well).
0.3% of residents speak Asian or Pacific Island language at home (46% speak English very well, 54% speak English well).
In fiscal year 2004:
Federal Government expenditure: $75,743,000 ($4,147 per capita)
Department of Defense expenditure: $1,394,000
Federal direct payments to individuals for retirement and disability: $42,751,000
Federal other direct payments to individuals: $18,674,000
Federal direct payments not to individuals: $1,539,000
Federal grants: $10,689,000
Federal procurement contracts: $421,000 ($40,000 Department of Defense)
Federal salaries and wages: $1,669,000 ($106,000 Department of Defense)
Federal Government direct loans: $105,000
Federal guaranteed/insured loans: $3,862,000
Federal Government insurance: $14,193,000
Population change from April 1, 2000 to July 1, 2005:
Births: 986| Here: | 54 per 1000 residents |
| State: | 69 per 1000 residents |
Deaths: 889
| Here: | 49 per 1000 residents |
| State: | 49 per 1000 residents |
Net international migration: +7
| Here: | +0 per 1000 residents |
| State: | +7 per 1000 residents |
Net internal migration: +282
| Here: | +15 per 1000 residents |
| State: | +5 per 1000 residents |
Total withdrawal of fresh water for public supply: 1.39 millions of gallons per day (all from ground)
| Here: | 6.2 |
| State: | 6.4 |
| Here: | 4.6 |
| State: | 4.4 |
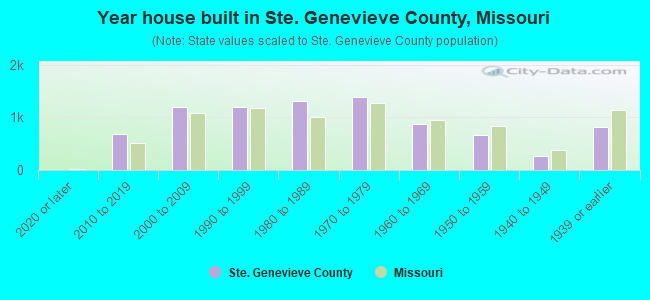
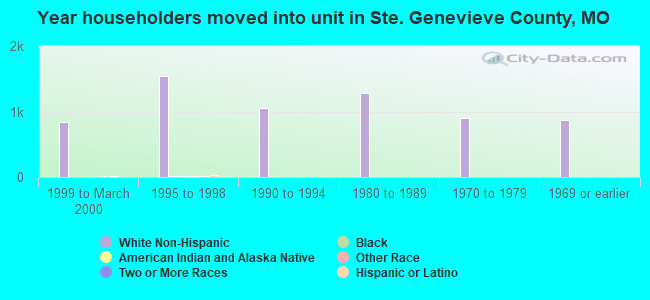
- Year house built in Ste. Genevieve County, Missouri
- 72020 or later
- 8142010 to 2019
- 1,2702000 to 2009
- 1,2411990 to 1999
- 1,2131980 to 1989
- 1,3711970 to 1979
- 8151960 to 1969
- 4771950 to 1959
- 2811940 to 1949
- 8471939 or earlier
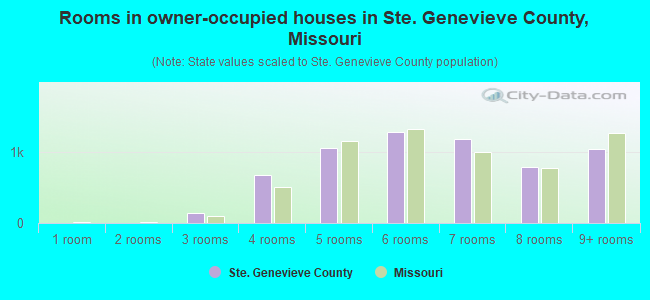
- Rooms in owner-occupied houses in Ste. Genevieve County, Missouri
- 11 room
- 442 rooms
- 1853 rooms
- 6004 rooms
- 1,1085 rooms
- 1,3856 rooms
- 1,0157 rooms
- 8148 rooms
- 7819+ rooms
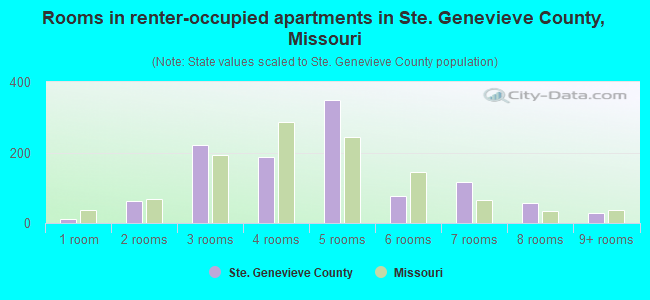
- Rooms in renter-occupied apartments in Ste. Genevieve County, Missouri
- 161 room
- 1072 rooms
- 2483 rooms
- 2884 rooms
- 3625 rooms
- 916 rooms
- 1837 rooms
- 458 rooms
- 249+ rooms
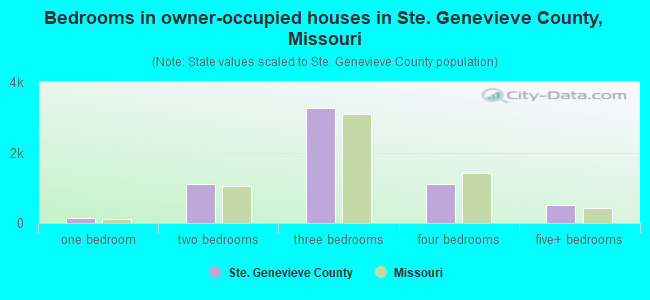
- Bedrooms in owner-occupied houses in Ste. Genevieve County, Missouri
- 1no bedroom
- 2181 bedroom
- 1,0212 bedrooms
- 3,2043 bedrooms
- 1,0454 bedrooms
- 4455+ bedrooms
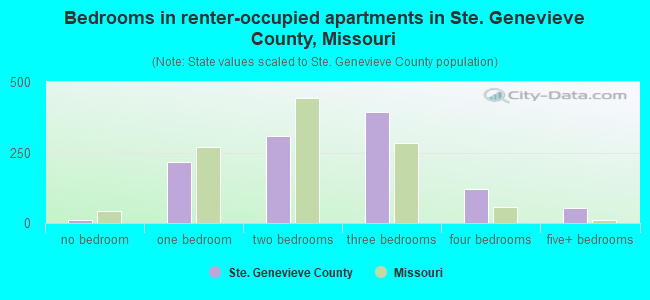
- Bedrooms in renter-occupied apartments in Ste. Genevieve County, Missouri
- 16no bedroom
- 2141 bedroom
- 4432 bedrooms
- 4903 bedrooms
- 1224 bedrooms
- 695+ bedrooms
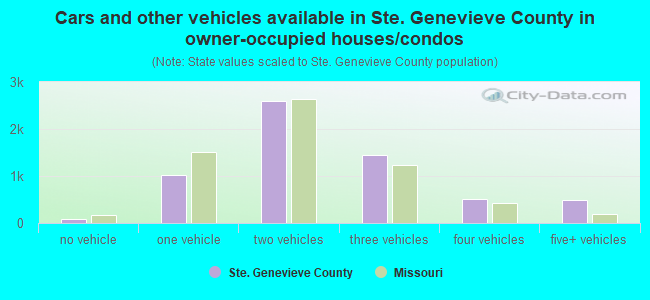
- Cars and other vehicles available in Ste. Genevieve County in owner-occupied houses/condos
- 102no vehicle
- 1,1081 vehicle
- 2,3662 vehicles
- 1,4063 vehicles
- 5084 vehicles
- 4455+ vehicles
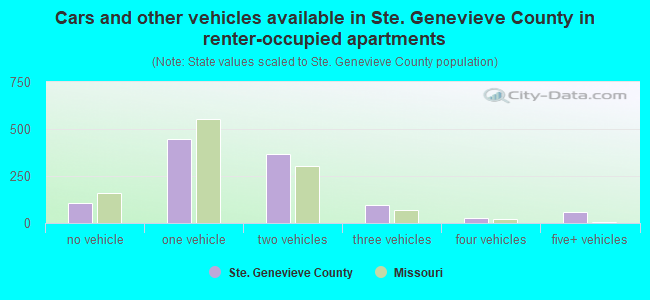
- Cars and other vehicles available in Ste. Genevieve County in renter-occupied apartments
- 137no vehicle
- 5831 vehicle
- 4682 vehicles
- 863 vehicles
- 264 vehicles
- 685+ vehicles
86.8% of Ste. Genevieve County residents lived in the same house 1 years ago.
Out of people who lived in different houses, 25% lived in this county.
Out of people who lived in different counties, 78% lived in Missouri.
| Ste. Genevieve County: | 86.8% |
| State average: | 87.1% |
Place of birth for U.S.-born residents:
- This state: 15,331
- Other state: 3,031
- Northeast: 75
- Midwest: 1,514
- South: 1,163
- West: 265
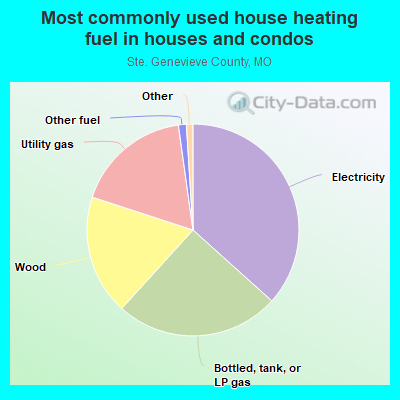
- 35.3%Electricity
- 27.8%Bottled, tank, or LP gas
- 18.8%Utility gas
- 15.7%Wood
- 1.3%Other fuel
- 0.4%No fuel used
- 0.4%Fuel oil, kerosene, etc.
- 0.2%Coal or coke
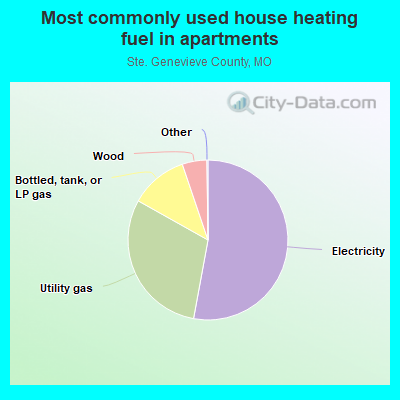
- 61.4%Electricity
- 27.1%Utility gas
- 7.8%Bottled, tank, or LP gas
- 3.5%Wood
- 0.2%Fuel oil, kerosene, etc.
Private vs. public school enrollment:
| Here: | 20.6% |
| Missouri: | 15.4% |
| Here: | 18.2% |
| Missouri: | 13.9% |
| Here: | 31.3% |
| Missouri: | 22.6% |


Ste. Genevieve County government finances - Expenditure in 2020:
- Charges - Other: $2,043,000
Other: $1,317,000
Parks and Recreation: $545,000
Parks and Recreation: $296,000
- Current Operations - Correctional Institutions: $3,626,000
Regular Highways: $3,273,000
Regular Highways: $2,558,000
Correctional Institutions: $2,418,000
Police Protection: $1,982,000
Police Protection: $1,251,000
General - Other: $1,199,000
General - Other: $1,118,000
Parks and Recreation: $875,000
Central Staff Services: $821,000
Financial Administration: $759,000
Parks and Recreation: $749,000
Judicial and Legal Services: $595,000
Health - Other: $575,000
Central Staff Services: $541,000
Financial Administration: $521,000
Health - Other: $442,000
Public Welfare - Other: $351,000
Judicial and Legal Services: $337,000
Libraries: $128,000
General Public Buildings: $97,000
General Public Buildings: $39,000
- General - Interest on Debt: $753,000
Interest on Debt: $250,000
- Long Term Debt - Beginning Outstanding - Unspecified Public Purpose: $20,701,000
Outstanding Unspecified Public Purpose: $18,438,000
Outstanding Unspecified Public Purpose: $9,145,000
Beginning Outstanding - Unspecified Public Purpose: $8,362,000
Retired Unspecified Public Purpose: $2,263,000
Issue, Unspecified Public Purpose: $2,000,000
Retired Unspecified Public Purpose: $1,217,000
- Miscellaneous - General Revenue - Other: $457,000
General Revenue - Other: $358,000
Interest Earnings: $335,000
Interest Earnings: $82,000
- Other Capital Outlay - General - Other: $819,000
- Other Funds - Cash and Securities: $5,649,000
Cash and Securities: $4,777,000
- State Intergovernmental - General Local Government Support: $6,944,000
General Local Government Support: $4,917,000
Other: $1,581,000
Highways: $1,331,000
Highways: $922,000
Other: $673,000
Health and Hospitals: $89,000
Health and Hospitals: $87,000
- Tax - General Sales and Gross Receipts: $4,885,000
General Sales and Gross Receipts: $3,840,000
Property: $2,528,000
Property: $2,452,000
Ste. Genevieve County government finances - Revenue in 2020:
- Charges - Other: $2,043,000
Other: $1,317,000
Parks and Recreation: $545,000
Parks and Recreation: $296,000
- Current Operations - Correctional Institutions: $3,626,000
Regular Highways: $3,273,000
Regular Highways: $2,558,000
Correctional Institutions: $2,418,000
Police Protection: $1,982,000
Police Protection: $1,251,000
General - Other: $1,199,000
General - Other: $1,118,000
Parks and Recreation: $875,000
Central Staff Services: $821,000
Financial Administration: $759,000
Parks and Recreation: $749,000
Judicial and Legal Services: $595,000
Health - Other: $575,000
Central Staff Services: $541,000
Financial Administration: $521,000
Health - Other: $442,000
Public Welfare - Other: $351,000
Judicial and Legal Services: $337,000
Libraries: $128,000
General Public Buildings: $97,000
General Public Buildings: $39,000
- General - Interest on Debt: $753,000
Interest on Debt: $250,000
- Long Term Debt - Beginning Outstanding - Unspecified Public Purpose: $20,701,000
Outstanding Unspecified Public Purpose: $18,438,000
Outstanding Unspecified Public Purpose: $9,145,000
Beginning Outstanding - Unspecified Public Purpose: $8,362,000
Retired Unspecified Public Purpose: $2,263,000
Issue, Unspecified Public Purpose: $2,000,000
Retired Unspecified Public Purpose: $1,217,000
- Miscellaneous - General Revenue - Other: $457,000
General Revenue - Other: $358,000
Interest Earnings: $335,000
Interest Earnings: $82,000
- Other Capital Outlay - General - Other: $819,000
- Other Funds - Cash and Securities: $5,649,000
Cash and Securities: $4,777,000
- State Intergovernmental - General Local Government Support: $6,944,000
General Local Government Support: $4,917,000
Other: $1,581,000
Highways: $1,331,000
Highways: $922,000
Other: $673,000
Health and Hospitals: $89,000
Health and Hospitals: $87,000
- Tax - General Sales and Gross Receipts: $4,885,000
General Sales and Gross Receipts: $3,840,000
Property: $2,528,000
Property: $2,452,000
Ste. Genevieve County government finances - Debt in 2020:
- Charges - Other: $2,043,000
Other: $1,317,000
Parks and Recreation: $545,000
Parks and Recreation: $296,000
- Current Operations - Correctional Institutions: $3,626,000
Regular Highways: $3,273,000
Regular Highways: $2,558,000
Correctional Institutions: $2,418,000
Police Protection: $1,982,000
Police Protection: $1,251,000
General - Other: $1,199,000
General - Other: $1,118,000
Parks and Recreation: $875,000
Central Staff Services: $821,000
Financial Administration: $759,000
Parks and Recreation: $749,000
Judicial and Legal Services: $595,000
Health - Other: $575,000
Central Staff Services: $541,000
Financial Administration: $521,000
Health - Other: $442,000
Public Welfare - Other: $351,000
Judicial and Legal Services: $337,000
Libraries: $128,000
General Public Buildings: $97,000
General Public Buildings: $39,000
- General - Interest on Debt: $753,000
Interest on Debt: $250,000
- Long Term Debt - Beginning Outstanding - Unspecified Public Purpose: $20,701,000
Outstanding Unspecified Public Purpose: $18,438,000
Outstanding Unspecified Public Purpose: $9,145,000
Beginning Outstanding - Unspecified Public Purpose: $8,362,000
Retired Unspecified Public Purpose: $2,263,000
Issue, Unspecified Public Purpose: $2,000,000
Retired Unspecified Public Purpose: $1,217,000
- Miscellaneous - General Revenue - Other: $457,000
General Revenue - Other: $358,000
Interest Earnings: $335,000
Interest Earnings: $82,000
- Other Capital Outlay - General - Other: $819,000
- Other Funds - Cash and Securities: $5,649,000
Cash and Securities: $4,777,000
- State Intergovernmental - General Local Government Support: $6,944,000
General Local Government Support: $4,917,000
Other: $1,581,000
Highways: $1,331,000
Highways: $922,000
Other: $673,000
Health and Hospitals: $89,000
Health and Hospitals: $87,000
- Tax - General Sales and Gross Receipts: $4,885,000
General Sales and Gross Receipts: $3,840,000
Property: $2,528,000
Property: $2,452,000
Ste. Genevieve County government finances - Cash and Securities in 2020:
- Charges - Other: $2,043,000
Other: $1,317,000
Parks and Recreation: $545,000
Parks and Recreation: $296,000
- Current Operations - Correctional Institutions: $3,626,000
Regular Highways: $3,273,000
Regular Highways: $2,558,000
Correctional Institutions: $2,418,000
Police Protection: $1,982,000
Police Protection: $1,251,000
General - Other: $1,199,000
General - Other: $1,118,000
Parks and Recreation: $875,000
Central Staff Services: $821,000
Financial Administration: $759,000
Parks and Recreation: $749,000
Judicial and Legal Services: $595,000
Health - Other: $575,000
Central Staff Services: $541,000
Financial Administration: $521,000
Health - Other: $442,000
Public Welfare - Other: $351,000
Judicial and Legal Services: $337,000
Libraries: $128,000
General Public Buildings: $97,000
General Public Buildings: $39,000
- General - Interest on Debt: $753,000
Interest on Debt: $250,000
- Long Term Debt - Beginning Outstanding - Unspecified Public Purpose: $20,701,000
Outstanding Unspecified Public Purpose: $18,438,000
Outstanding Unspecified Public Purpose: $9,145,000
Beginning Outstanding - Unspecified Public Purpose: $8,362,000
Retired Unspecified Public Purpose: $2,263,000
Issue, Unspecified Public Purpose: $2,000,000
Retired Unspecified Public Purpose: $1,217,000
- Miscellaneous - General Revenue - Other: $457,000
General Revenue - Other: $358,000
Interest Earnings: $335,000
Interest Earnings: $82,000
- Other Capital Outlay - General - Other: $819,000
- Other Funds - Cash and Securities: $5,649,000
Cash and Securities: $4,777,000
- State Intergovernmental - General Local Government Support: $6,944,000
General Local Government Support: $4,917,000
Other: $1,581,000
Highways: $1,331,000
Highways: $922,000
Other: $673,000
Health and Hospitals: $89,000
Health and Hospitals: $87,000
- Tax - General Sales and Gross Receipts: $4,885,000
General Sales and Gross Receipts: $3,840,000
Property: $2,528,000
Property: $2,452,000
Supplemental Security Income (SSI) in 2006:
- Total number of recipients: 248
- Number of aged recipients: 17
- Number of blind and disabled recipients: 231
- Number of recipients under 18: 41
- Number of recipients between 18 and 64: 178
- Number of recipients older than 64: 29
- Number of recipients also receiving OASDI: 84
- Amount of payments (thousands of dollars): 118
| Most common first names in Ste. Genevieve County, MO among deceased individuals | ||
| Name | Count | Lived (average) |
|---|---|---|
| Mary | 131 | 80.4 years |
| William | 111 | 75.7 years |
| John | 96 | 75.5 years |
| Joseph | 81 | 79.1 years |
| Robert | 70 | 68.9 years |
| Charles | 63 | 75.8 years |
| James | 59 | 71.6 years |
| Raymond | 59 | 75.8 years |
| Edward | 55 | 78.2 years |
| Henry | 55 | 77.4 years |
| Most common last names in Ste. Genevieve County, MO among deceased individuals | ||
| Last name | Count | Lived (average) |
|---|---|---|
| Roth | 84 | 76.9 years |
| Naeger | 61 | 76.1 years |
| Gegg | 61 | 75.3 years |
| Basler | 59 | 81.2 years |
| Jokerst | 54 | 78.4 years |
| Grass | 48 | 79.0 years |
| Bauman | 47 | 80.9 years |
| Meyer | 44 | 77.5 years |
| Joggerst | 35 | 78.9 years |
| Smith | 34 | 77.4 years |
| Businesses in Ste. Genevieve County, MO | ||||
| Name | Count | Name | Count | |
|---|---|---|---|---|
| Alco Stores | 1 | Microtel | 1 | |
| AutoZone | 1 | Nike | 2 | |
| Chevrolet | 1 | RadioShack | 1 | |
| Dairy Queen | 1 | Subway | 1 | |
| Domino's Pizza | 1 | True Value | 1 | |
| FedEx | 1 | U-Haul | 1 | |
| Ford | 1 | U.S. Cellular | 1 | |
| H&R Block | 1 | UPS | 1 | |
| McDonald's | 1 | |||
Ste. Genevieve County on our top lists:
- #76 on the list of "Top 101 counties with the highest Ozone (1-hour) air pollution readings in 2012 (ppm)"