Sullivan County, Pennsylvania (PA)
County owner-occupied free and clear houses and condos in 2010: 1,199
County owner-occupied houses and condos in 2000: 2,138
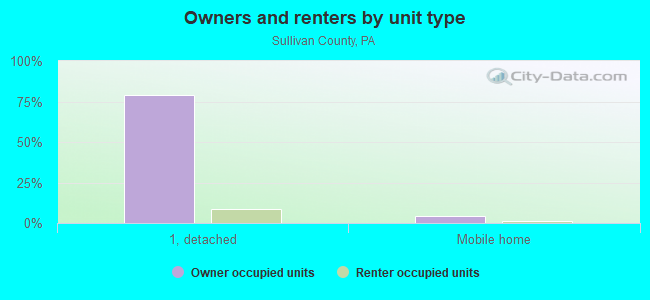
Renter-occupied apartments: 557 (it was 522 in 2000)
| % of renters here: | 20% |
| State: | 30% |
Land area: 450 sq. mi.
Water area: 2.4 sq. mi.
Population density: 13 people per square mile (low).
Industries providing employment: Educational, health and social services (23.9%), Manufacturing (15.3%).
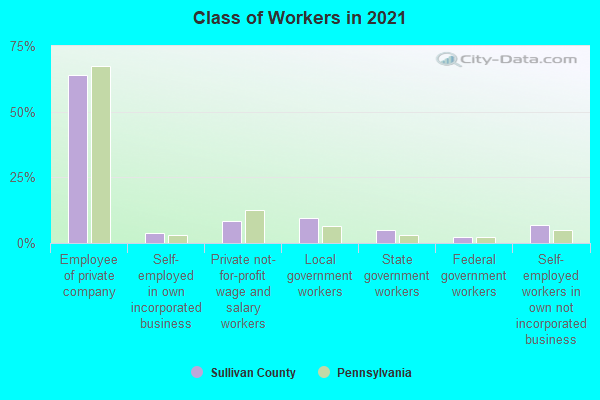
Type of workers:
- Private wage or salary: 75%
- Government: 17%
- Self-employed, not incorporated: 8%
- Unpaid family work: 0%
- OSM Map
- General Map
- Google Map
- MSN Map

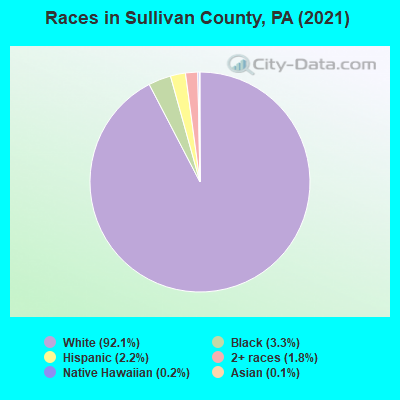
- 5,38292.8%White Non-Hispanic Alone
- 1472.5%Black Non-Hispanic Alone
- 1452.5%Hispanic or Latino
- 1172.0%Two or more races
- 50.09%Native Hawaiian and Other
Pacific Islander alone - 30.05%Some other race alone
- 20.03%American Indian and Alaska Native alone
| Median resident age: | 55.1 years |
| Pennsylvania median age: | 40.9 years |
| Males: 3,090 | |
| Females: 2,782 |

 | How's living in Sullivan County, PA? (10 replies) |
| most scenic mountain vistas in PA? (6 replies) |
| Does southeastern PA have a lot of trees, or is it treeless? (45 replies) |
| Re-Opening PA (110 replies) |
| Why aren't the Poconos as pricey as other outer-orbits of NYC? (174 replies) |
| Escaping NJ.... (21 replies) |
| Sullivan County: | 2.0 people |
| Pennsylvania: | 2 people |
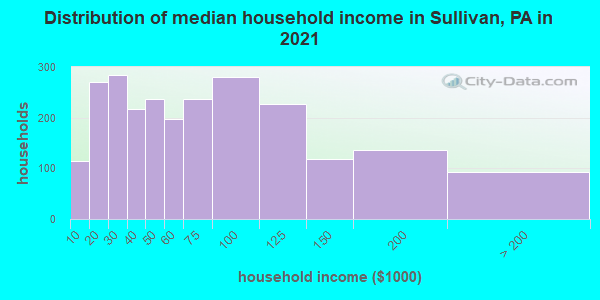
Estimated median household income in 2022: $61,730 ($30,279 in 1999)
| This county: | $61,730 |
| Pennsylvania: | $71,798 |
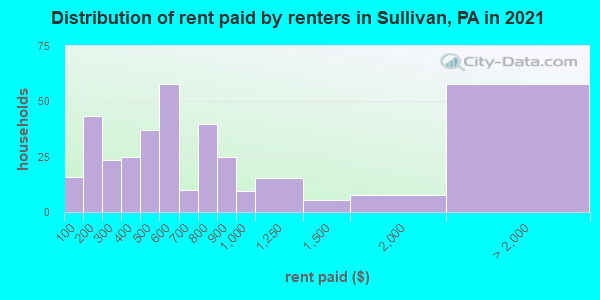
Median contract rent in 2022 for apartments: $532 (lower quartile is $241, upper quartile is $822)
| This county: | $532 |
| State: | $922 |
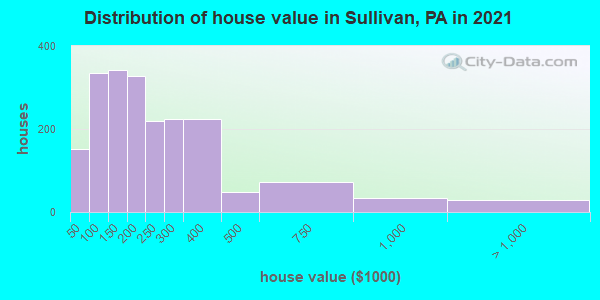
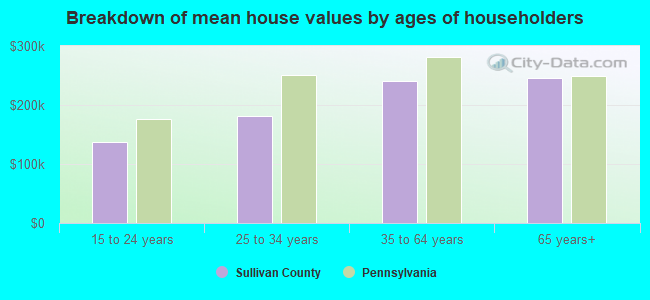
Estimated median house or condo value in 2022: $194,273 (it was $80,800 in 2000)
| Sullivan: | $194,273 |
| Pennsylvania: | $245,500 |
Mean price in 2022:
Median monthly housing costs for homes and condos with a mortgage: $1,269Detached houses: $251,133
Here: $251,133 State: $317,202 Townhouses or other attached units: $191,174
Here: $191,174 State: $254,369 Mobile homes: $281,772
Here: $281,772 State: $92,414 Occupied boats, RVs, vans, etc.: $23,338
Here: $23,338 State: $563,750
Median monthly housing costs for units without a mortgage: $463
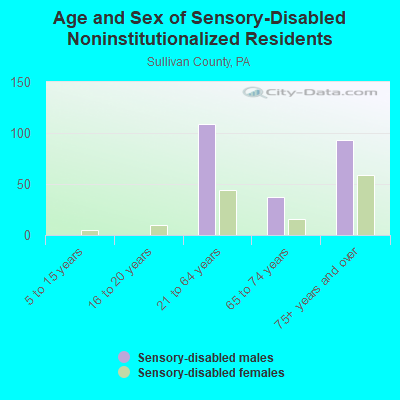
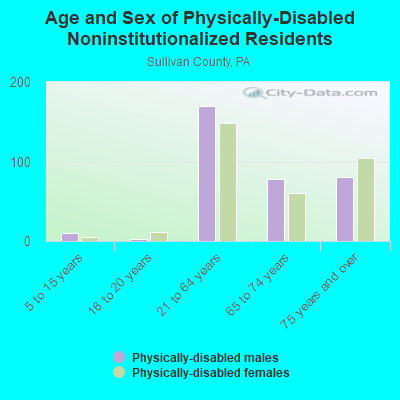
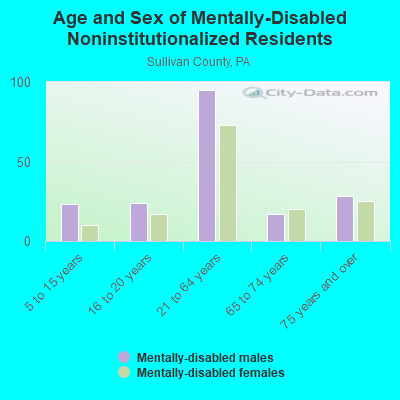
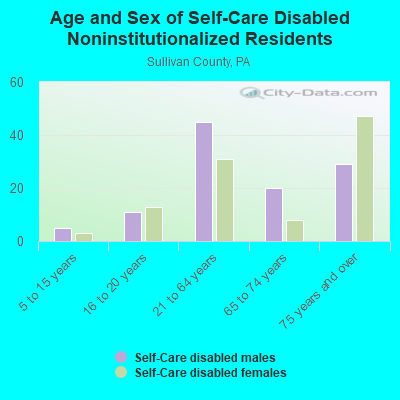
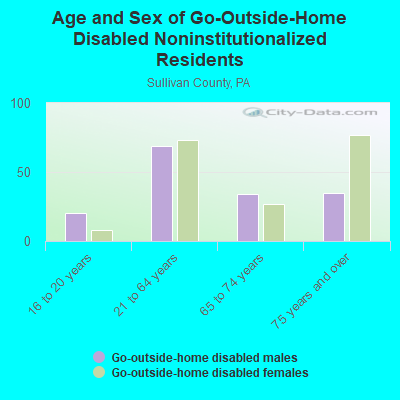
Institutionalized population: 149
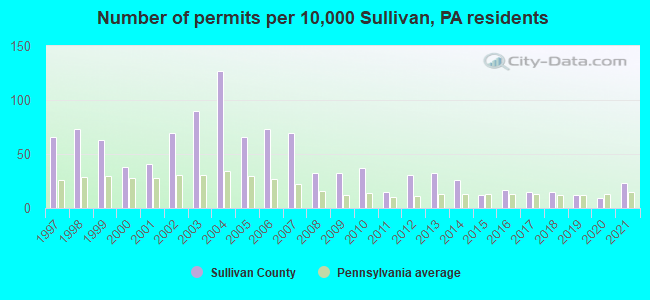
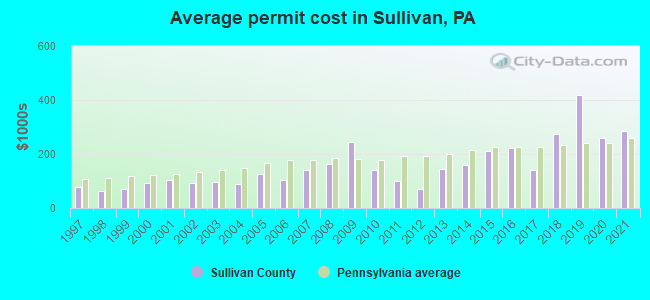
Single-family new house construction building permits:
- 2022: 17 buildings, average cost: $271,400
- 2021: 15 buildings, average cost: $285,900
- 2020: 6 buildings, average cost: $260,500
- 2019: 8 buildings, average cost: $419,000
- 2018: 10 buildings, average cost: $274,300
- 2017: 10 buildings, average cost: $139,200
- 2016: 11 buildings, average cost: $221,700
- 2015: 8 buildings, average cost: $210,200
- 2014: 17 buildings, average cost: $160,100
- 2013: 21 buildings, average cost: $143,500
- 2012: 20 buildings, average cost: $69,100
- 2011: 10 buildings, average cost: $100,800
- 2010: 24 buildings, average cost: $142,200
- 2009: 21 buildings, average cost: $245,800
- 2008: 21 buildings, average cost: $162,000
- 2007: 45 buildings, average cost: $139,600
- 2006: 48 buildings, average cost: $105,100
- 2005: 43 buildings, average cost: $125,600
- 2004: 83 buildings, average cost: $89,400
- 2003: 59 buildings, average cost: $96,300
- 2002: 45 buildings, average cost: $92,200
- 2001: 27 buildings, average cost: $102,500
- 2000: 25 buildings, average cost: $94,400
- 1999: 41 buildings, average cost: $70,100
- 1998: 48 buildings, average cost: $62,100
- 1997: 43 buildings, average cost: $78,900
Median real estate property taxes paid for housing units with mortgages in 2022: $1,975 (1.0%)
Median real estate property taxes paid for housing units with no mortgage in 2022: $1,638 (0.9%)
| Sullivan County: | 12.3% |
| Pennsylvania: | 11.8% |
Median age of residents in 2022: 55.1 years old
(Males: 54.2 years old, Females: 56.9 years old)
(Median age for: White residents: 57.0 years old, Black residents: 19.9 years old, American Indian residents: 47.1 years old, Hispanic or Latino residents: 30.0 years old, Other race residents: 30.3 years old)
Fair market rent in 2006 for a 1-bedroom apartment in Sullivan County is $434 a month.
Fair market rent for a 2-bedroom apartment is $498 a month.
Fair market rent for a 3-bedroom apartment is $624 a month.
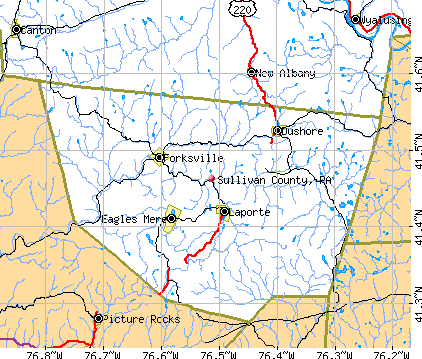
Cities in this county include: Dushore, Laporte, Eagles Mere, Forksville.
Neighboring counties: Bureau County, Illinois  , Boone County, Nebraska , Cedar County, Iowa , Summit County, Utah , Orange County, New York
  , Rockland County, New York , Union County
  .
.
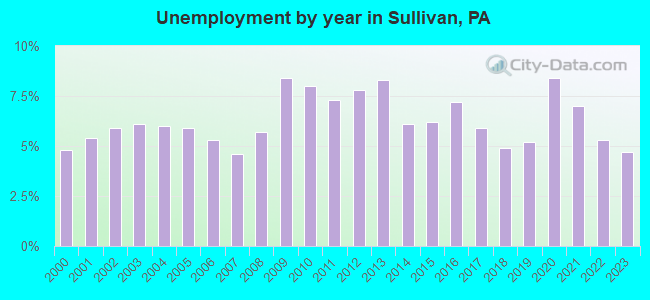
| Here: | 3.4% |
| Pennsylvania: | 2.9% |
Current college students: 165
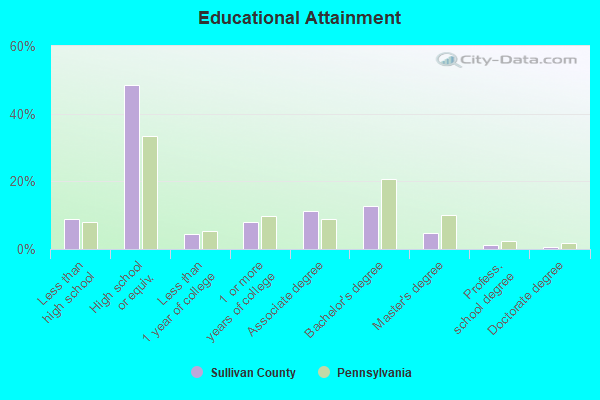
People 25 years of age or older with a high school degree or higher: 90.8%
People 25 years of age or older with a bachelor's degree or higher: 18.9%
Number of foreign born residents: 104 (45.4% naturalized citizens)
| Sullivan County: | 1.8% |
| Whole state: | 7.5% |
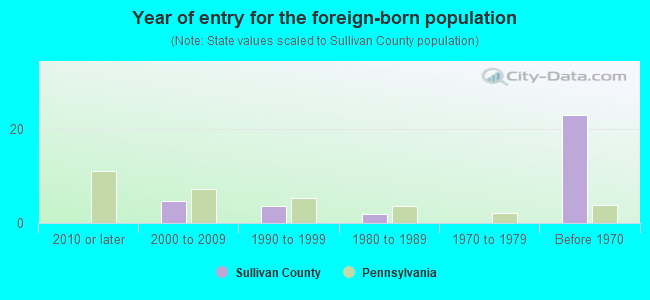
- Year of entry for the foreign-born population
- 552010 or later
- 82000 to 2009
- 41990 to 1999
- 21980 to 1989
- 01970 to 1979
- 23Before 1970
Mean travel time to work (commute): minutes
Percentage of county residents living and working in this county: 99.2%
Housing units in structures:
- One, detached: 4,901
- One, attached: 43
- Two: 50
- 3 or 4: 42
- 5 to 9: 47
- 10 to 19: 12
- 20 to 49: 6
- 50 or more: 51
- Mobile homes: 486
- Boats, RVs, vans, etc.: 10
Housing units in Sullivan County with a mortgage: 955 (121 second mortgage, 2 home equity loan, 99 both second mortgage and home equity loan)
Houses without a mortgage: 55
| Here: | 94.6% with mortgage |
| State: | 93.8% with mortgage |
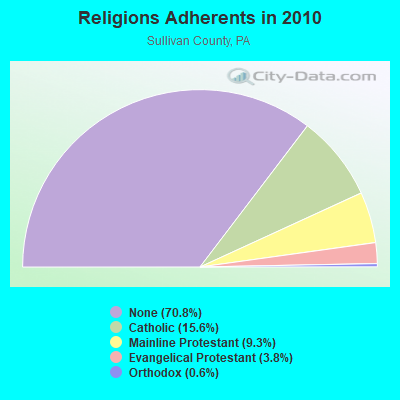
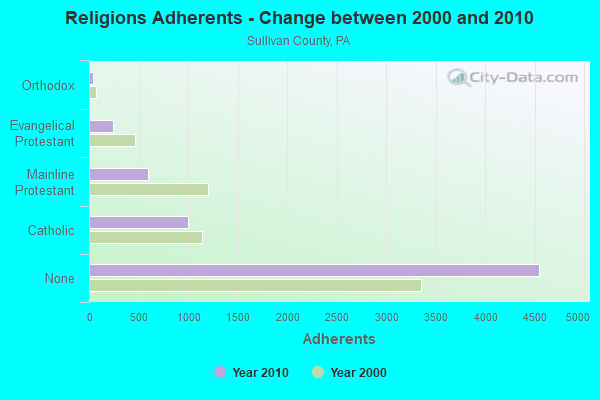
Religion statistics for Sullivan County
| Religion | Adherents | Congregations |
|---|---|---|
| Catholic | 1,000 | 4 |
| Mainline Protestant | 597 | 9 |
| Evangelical Protestant | 242 | 3 |
| Orthodox | 40 | 1 |
| Other | - | - |
| None | 4,549 | - |
Source: Clifford Grammich, Kirk Hadaway, Richard Houseal, Dale E.Jones, Alexei Krindatch, Richie Stanley and Richard H.Taylor. 2012. 2010 U.S.Religion Census: Religious Congregations & Membership Study. Association of Statisticians of American Religious Bodies. Jones, Dale E., et al. 2002. Congregations and Membership in the United States 2000. Nashville, TN: Glenmary Research Center.
Food Environment Statistics:
| Sullivan County: | 4.82 / 10,000 pop. |
| State: | 2.04 / 10,000 pop. |
| This county: | 1.61 / 10,000 pop. |
| Pennsylvania: | 0.88 / 10,000 pop. |
| Sullivan County: | 4.82 / 10,000 pop. |
| Pennsylvania: | 2.52 / 10,000 pop. |
| This county: | 17.68 / 10,000 pop. |
| State: | 7.12 / 10,000 pop. |
| Sullivan County: | 10.4% |
| Pennsylvania: | 9.1% |
| Sullivan County: | 29.5% |
| State: | 27.2% |
| Here: | 17.6% |
| State: | 11.5% |
Agriculture in Sullivan County:
Average size of farms: 183 acresAverage value of agricultural products sold per farm: $41,531
Average value of crops sold per acre for harvested cropland: $55.84
The value of nursery, greenhouse, floriculture, and sod as a percentage of the total market value of agricultural products sold: 3.53%
The value of livestock, poultry, and their products as a percentage of the total market value of agricultural products sold: 89.77%
Average total farm production expenses per farm: $27,242
Harvested cropland as a percentage of land in farms: 41.61%
Irrigated harvested cropland as a percentage of land in farms: 0.09%
Average market value of all machinery and equipment per farm: $49,082
The percentage of farms operated by a family or individual: 93.53%
Average age of principal farm operators: 53 years
Average number of cattle and calves per 100 acres of all land in farms: 16.26
Milk cows as a percentage of all cattle and calves: 40.72%
Corn for grain: 876 harvested acres
Earthquake activity:
Sullivan County-area historical earthquake activity is significantly above Pennsylvania state average. It is 65% smaller than the overall U.S. average.On 8/23/2011 at 17:51:04, a magnitude 5.8 (5.8 MW, Depth: 3.7 mi, Class: Moderate, Intensity: VI - VII) earthquake occurred 257.0 miles away from Sullivan County center
On 10/7/1983 at 10:18:46, a magnitude 5.3 (5.1 MB, 5.3 LG, 5.1 ML) earthquake occurred 204.7 miles away from the county center
On 9/25/1998 at 19:52:52, a magnitude 5.2 (4.8 MB, 4.3 MS, 5.2 LG, 4.5 MW, Depth: 3.1 mi) earthquake occurred 201.2 miles away from the county center
On 1/16/1994 at 01:49:16, a magnitude 4.6 (4.6 MB, 4.6 LG, Depth: 3.1 mi, Class: Light, Intensity: IV - V) earthquake occurred 82.1 miles away from the county center
On 4/20/2002 at 10:50:47, a magnitude 5.3 (5.3 ML, Depth: 3.0 mi) earthquake occurred 254.6 miles away from Sullivan County center
On 4/20/2002 at 10:50:47, a magnitude 5.2 (5.2 MB, 4.2 MS, 5.2 MW, 5.0 MW) earthquake occurred 252.6 miles away from the county center
Magnitude types: regional Lg-wave magnitude (LG), body-wave magnitude (MB), local magnitude (ML), surface-wave magnitude (MS), moment magnitude (MW)
Most recent natural disasters:
- Pennsylvania Covid-19 Pandemic, Incident Period: January 20, 2020, Major Disaster (Presidential) Declared DR-4506-PA: March 30, 2020, FEMA Id: 4506, Natural disaster type: Other
- Pennsylvania Severe Storms And Flooding, Incident Period: August 10, 2018 - August 15, 2018, FEMA Id: 4408, Natural disaster type: Storm, Flood
- Pennsylvania Severe Storms and Flooding, Incident Period: October 20, 2016 to October 21, 2016, Major Disaster (Presidential) Declared DR-4292: December 02, 2016, FEMA Id: 4292, Natural disaster type: Storm, Flood
- Pennsylvania Hurricane Sandy, Incident Period: October 26, 2012 to November 08, 2012, Emergency Declared EM-3356: October 29, 2012, FEMA Id: 3356, Natural disaster type: Hurricane
- Pennsylvania Hurricane Sandy, Incident Period: October 26, 2012 to November 08, 2012, Major Disaster (Presidential) Declared DR-4099: January 10, 2013, FEMA Id: 4099, Natural disaster type: Hurricane
- Pennsylvania Remnants of Tropical Storm Lee, Incident Period: September 03, 2011 to October 15, 2011, Major Disaster (Presidential) Declared EM-3340: September 08, 2011, FEMA Id: 3340, Natural disaster type: Tropical Storm
- Pennsylvania Tropical Storm Lee, Incident Period: September 03, 2011 to October 15, 2011, Major Disaster (Presidential) Declared DR-4030: September 12, 2011, FEMA Id: 4030, Natural disaster type: Tropical Storm
- Pennsylvania Hurricane Irene, Incident Period: August 26, 2011 to September 14, 2011, Emergency Declared EM-3339: August 29, 2011, FEMA Id: 3339, Natural disaster type: Hurricane
- Pennsylvania Hurricane Irene, Incident Period: August 26, 2011 to August 30, 2011, Major Disaster (Presidential) Declared DR-4025: September 03, 2011, FEMA Id: 4025, Natural disaster type: Hurricane
- Pennsylvania Severe Storms and Flooding, Incident Period: April 25, 2011 to April 28, 2011, Major Disaster (Presidential) Declared DR-4003: July 13, 2011, FEMA Id: 4003, Natural disaster type: Storm, Flood
- 11 other natural disasters have been reported since 1953.
The number of natural disasters in Sullivan County (21) is greater than the US average (15).
Major Disasters (Presidential) Declared: 16
Emergencies Declared: 4
Causes of natural disasters: Floods: 8, Storms: 8, Hurricanes: 5, Tropical Storms: 3, Winter Storms: 2, Blizzard: 1, Heavy Rain: 1, Mudslide: 1, Snowfall: 1, Tropical Depression: 1, Other: 1 (Note: some incidents may be assigned to more than one category).
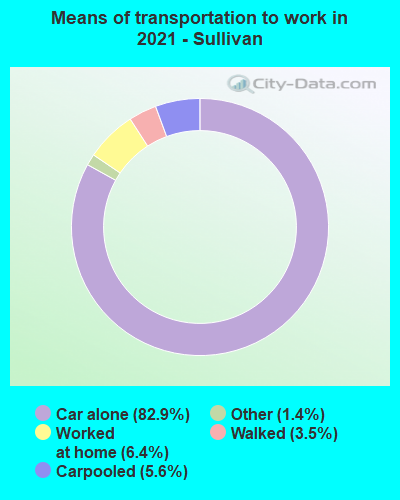
Means of transportation to work:
- Drove a car alone: 1,649 (76.3%)
- Carpooled: 110 (5.1%)
- Bus: 1 (0.0%)
- Taxicab, motorcycle, or other means: 95 (4.4%)
- Walked: 94 (4.3%)
- Worked at home: 206 (9.5%)
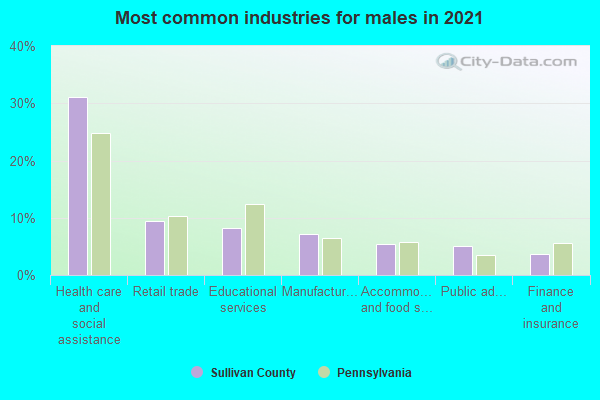
- Health care and social assistance (30%)
- Retail trade (10%)
- Educational services (9%)
- Manufacturing (7%)
- Accommodation and food services (6%)
- Public administration (5%)
- Finance and insurance (4%)
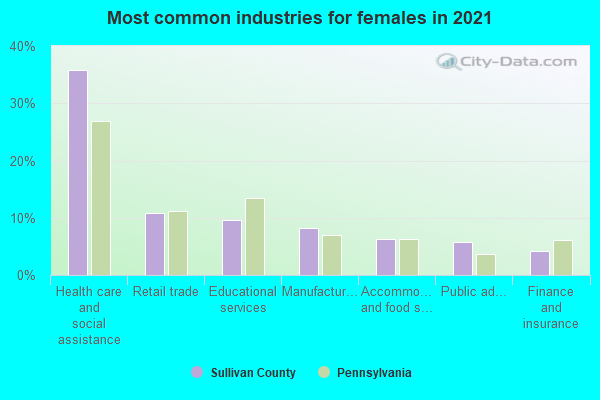
- Health care and social assistance (33%)
- Retail trade (11%)
- Educational services (10%)
- Manufacturing (8%)
- Accommodation and food services (7%)
- Public administration (6%)
- Finance and insurance (4%)
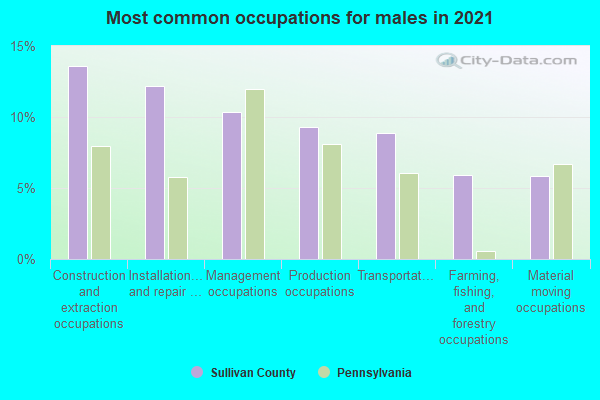
- Construction and extraction occupations (14%)
- Installation, maintenance, and repair occupations (12%)
- Transportation occupations (10%)
- Management occupations (10%)
- Production occupations (9%)
- Farming, fishing, and forestry occupations (7%)
- Material moving occupations (6%)
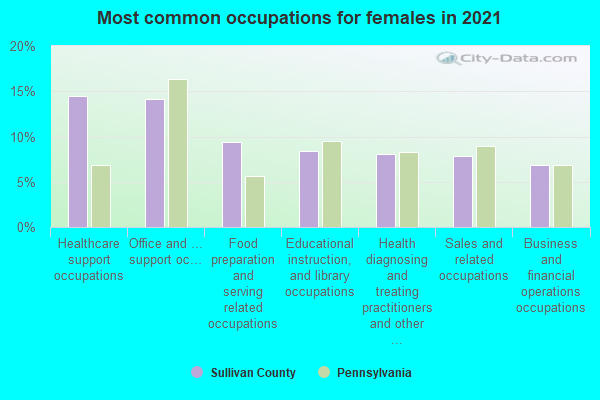
- Office and administrative support occupations (13%)
- Healthcare support occupations (11%)
- Food preparation and serving related occupations (10%)
- Educational instruction, and library occupations (9%)
- Health diagnosing and treating practitioners and other technical occupations (8%)
- Business and financial operations occupations (7%)
- Sales and related occupations (7%)
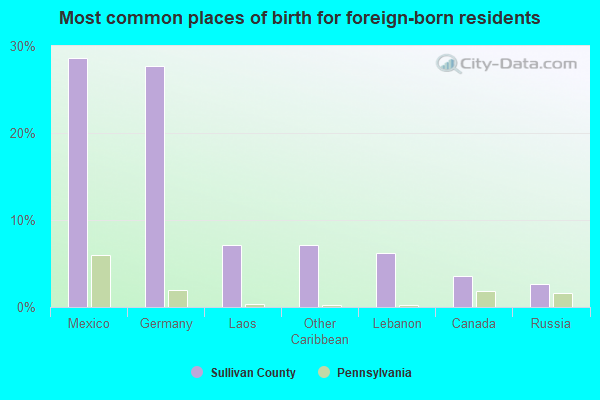
- Mexico (46%)
- Germany (17%)
- Lebanon (9%)
- Scotland (6%)
- Canada (6%)
- Russia (4%)
- England (2%)
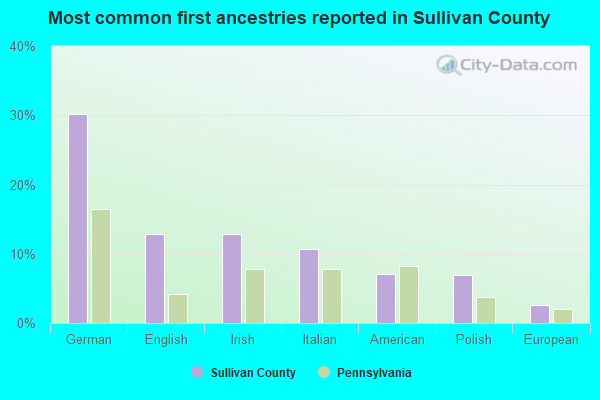
- German (29%)
- English (14%)
- Irish (13%)
- Italian (10%)
- Polish (8%)
- American (6%)
- European (2%)
149 people in nursing facilities/skilled-nursing facilities
People in group quarters in Sullivan County, Pennsylvania in 2000:
- 283 people in job corps and vocational training facilities
- 145 people in nursing homes
- 15 people in other noninstitutional group quarters
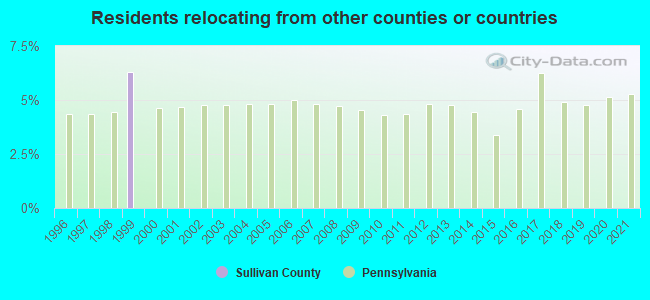
10 or fewer of this county's residents relocated from other counties between 2020 and 2021.1,000 average adjusted gross income)
10 or fewer of this county's residents moved from foreign countries.
10 or fewer of this county's residents relocated from other counties in Pennsylvania.
10 or fewer of this county's residents relocated from other states.
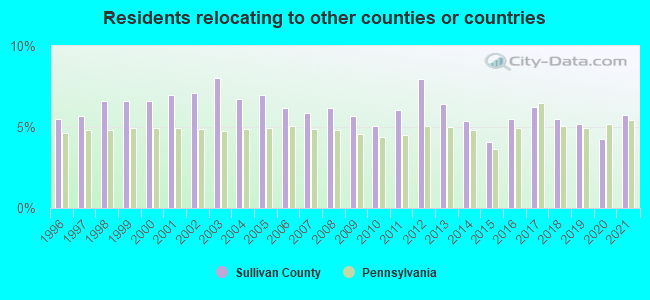
5.75% of this county's 2020 resident taxpayers moved to other counties in 2021 ($56,043 average adjusted gross income)
| Here: | 5.75% |
| Pennsylvania average: | 5.44% |
10 or fewer of this county's residents moved to foreign countries.
4.93% relocated to other counties in Pennsylvania ($47,461 average AGI)
0.82% relocated to other states ($8,582 average AGI)
Sullivan County: 0.82% Pennsylvania average: 2.47%
Top counties to which taxpayers relocated from this county between 2020 and 2021:
| to Bradford County, PA | |
| to Lycoming County, PA |
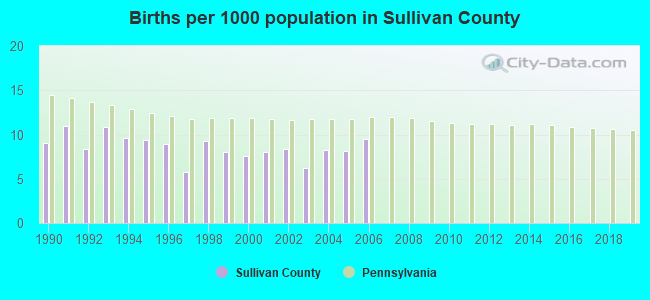
Births per 1000 population from 1990 to 1999: 9.0
Births per 1000 population from 2000 to 2006: 8.0
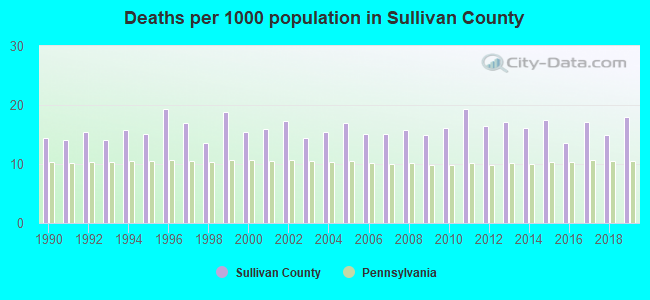
Deaths per 1000 population from 1990 to 1999: 15.7
Deaths per 1000 population from 2000 to 2009: 15.6
Deaths per 1000 population from 2010 to 2020: 16.7
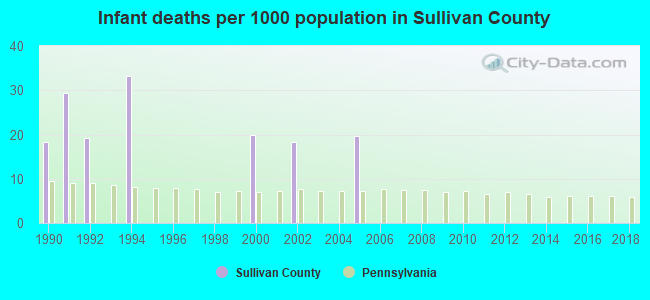
Infant deaths per 1000 live births from 1990 to 1999: 10.0
Infant deaths per 1000 live births from 2000 to 2006: 8.3
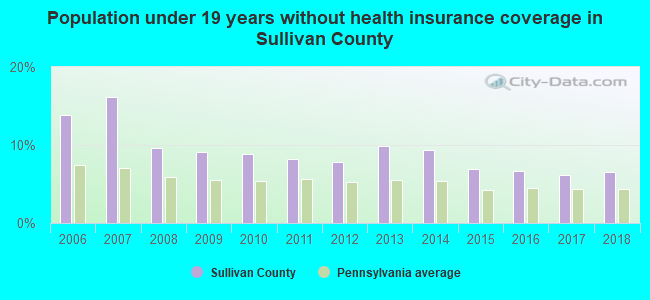
Persons under 19 years old without health insurance coverage in 2018: 6.6%
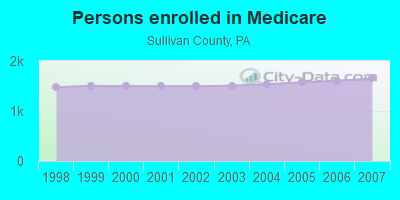
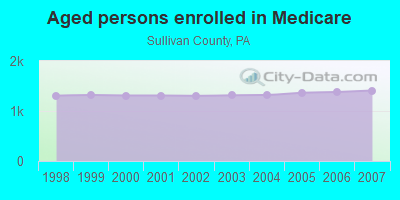
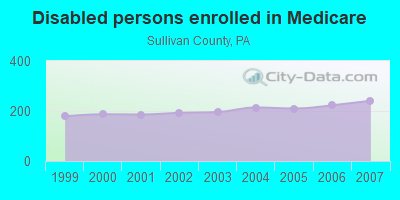
Persons enrolled in hospital insurance and/or supplemental medical insurance (Medicare) in July 1, 2007: 1,651 (1,410 aged, 241 disabled)
Children under 18 without health insurance coverage in 2007: 133 (11%)
Most common underlying causes of death in Sullivan County, Pennsylvania in 1999 - 2019:
- Atherosclerotic heart disease (34)
- Unspecified dementia (16)
- Acute myocardial infarction, unspecified (10)
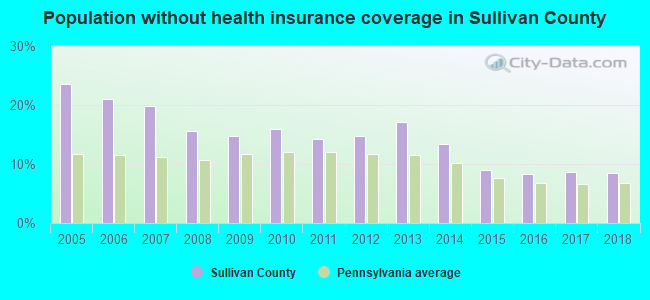
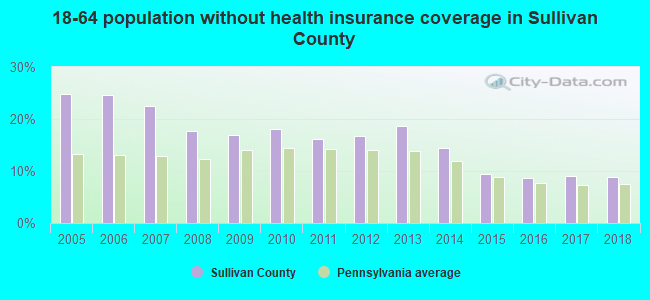
Population without health insurance coverage in 2000: 14%
Children under 18 without health insurance coverage in 2000: 11%
Medical specialist MDs per 100,000 population in 2005: 1,612
Dentists per 100,000 population in 1998: 31
Total deaths per 100,000 population, July 2005 - July 2006: 31
Household type by relationship:
Households: 5,872- Male householders: 1,276 (501 living alone), Female householders: 1,231 (374 living alone)
1,265 spouses (1,247 opposite-sex spouses), 145 unmarried partners, (129 opposite-sex unmarried partners), 1,076 children (969 natural, 57 adopted, 48 stepchildren), 64 grandchildren, 77 brothers or sisters, 100 parents, 35 foster children, 118 other relatives, 103 non-relatives
- In group quarters: 387
Size of family households: 944 2-persons, 254 3-persons, 148 4-persons, 107 5-persons, 21 6-persons, 40 7-or-more-persons.
Size of nonfamily households: 876 1-person, 119 2-persons, 9 3-persons.
414 married couples with children.
135 single-parent households (57 men, 78 women).
97.3% of residents of Sullivan speak English at home.
1.8% of residents speak Spanish at home (35% speak English very well, 3% speak English well, 62% speak English not well).
0.7% of residents speak other Indo-European language at home (29% speak English very well, 71% speak English well).
0.3% of residents speak other language at home (100% speak English very well).
In fiscal year 2004:
Federal Government expenditure: $41,807,000 ($6,519 per capita)
Department of Defense expenditure: $1,242,000
Federal direct payments to individuals for retirement and disability: $21,623,000
Federal other direct payments to individuals: $9,093,000
Federal direct payments not to individuals: $256,000
Federal grants: $7,100,000
Federal procurement contracts: $1,975,000 ($236,000 Department of Defense)
Federal salaries and wages: $1,759,000 ($0,000 Department of Defense)
Federal Government direct loans: $74,000
Federal guaranteed/insured loans: $547,000
Federal Government insurance: $5,481,000
Population change from April 1, 2000 to July 1, 2005:
Births: 233| Here: | 36 per 1000 residents |
| State: | 61 per 1000 residents |
Deaths: 513
| Here: | 80 per 1000 residents |
| State: | 54 per 1000 residents |
Net international migration: +10
| Here: | +2 per 1000 residents |
| State: | +8 per 1000 residents |
Net internal migration: +118
| Here: | |
| State: |
Total withdrawal of fresh water for public supply: 2.89 millions of gallons per day (4% from ground, 96% from surface)
| Here: | 6.4 |
| State: | 6.8 |
| Here: | 4.3 |
| State: | 4.3 |
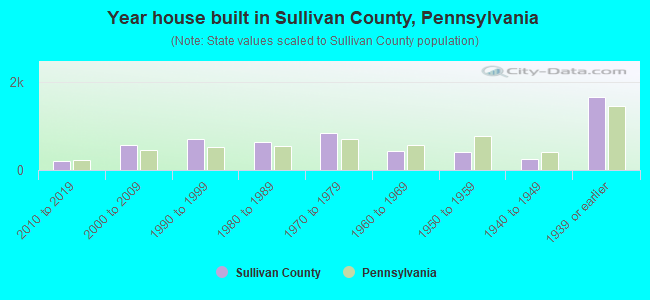
- Year house built in Sullivan County, Pennsylvania
- 72020 or later
- 2492010 to 2019
- 5562000 to 2009
- 6461990 to 1999
- 6451980 to 1989
- 8341970 to 1979
- 4561960 to 1969
- 4371950 to 1959
- 2221940 to 1949
- 1,5751939 or earlier
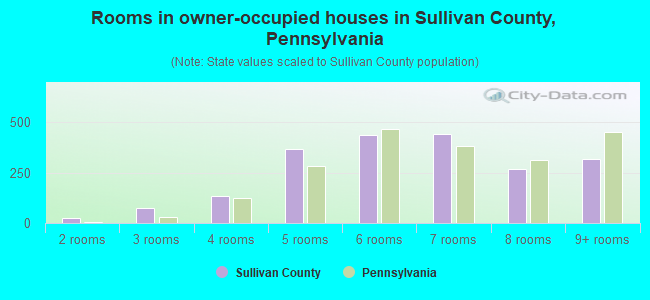
- Rooms in owner-occupied houses in Sullivan County, Pennsylvania
- 81 room
- 292 rooms
- 683 rooms
- 1634 rooms
- 3635 rooms
- 4736 rooms
- 4307 rooms
- 2828 rooms
- 3079+ rooms
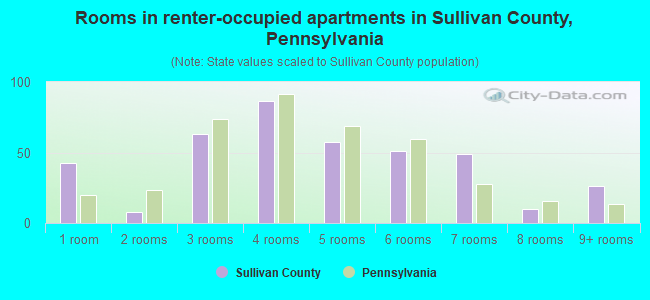
- Rooms in renter-occupied apartments in Sullivan County, Pennsylvania
- 531 room
- 142 rooms
- 503 rooms
- 1004 rooms
- 585 rooms
- 376 rooms
- 427 rooms
- 98 rooms
- 289+ rooms
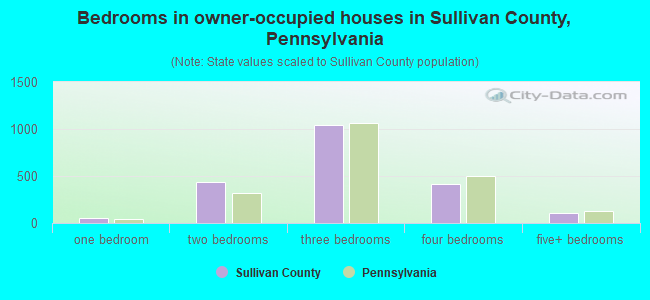
- Bedrooms in owner-occupied houses in Sullivan County, Pennsylvania
- 8no bedroom
- 651 bedroom
- 4442 bedrooms
- 1,0793 bedrooms
- 4224 bedrooms
- 1015+ bedrooms
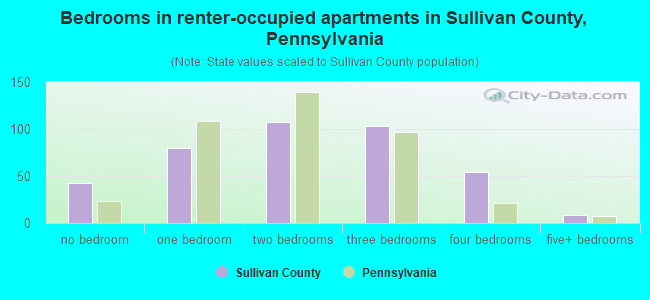
- Bedrooms in renter-occupied apartments in Sullivan County, Pennsylvania
- 54no bedroom
- 751 bedroom
- 1242 bedrooms
- 933 bedrooms
- 434 bedrooms
- 25+ bedrooms
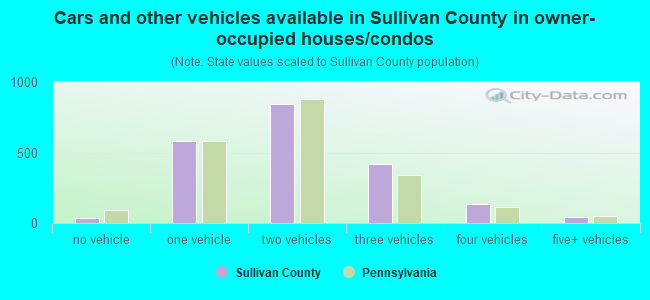
- Cars and other vehicles available in Sullivan County in owner-occupied houses/condos
- 41no vehicle
- 5621 vehicle
- 8732 vehicles
- 4653 vehicles
- 1244 vehicles
- 475+ vehicles
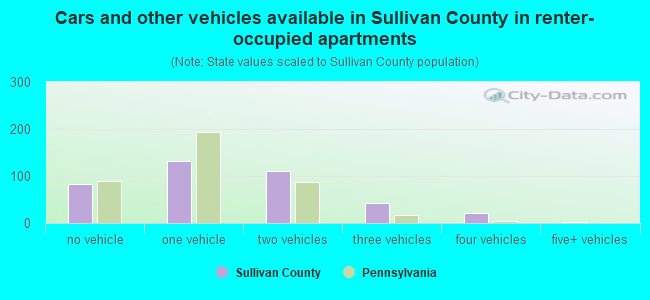
- Cars and other vehicles available in Sullivan County in renter-occupied apartments
- 91no vehicle
- 1451 vehicle
- 922 vehicles
- 283 vehicles
- 314 vehicles
- 35+ vehicles
93.8% of Sullivan County residents lived in the same house 1 years ago.
Out of people who lived in different houses, 17% lived in this county.
Out of people who lived in different counties, 89% lived in Pennsylvania.
| Sullivan County: | 93.8% |
| State average: | 89.3% |
Place of birth for U.S.-born residents:
- This state: 4,685
- Other state: 1,024
- Northeast: 624
- Midwest: 67
- South: 261
- West: 69
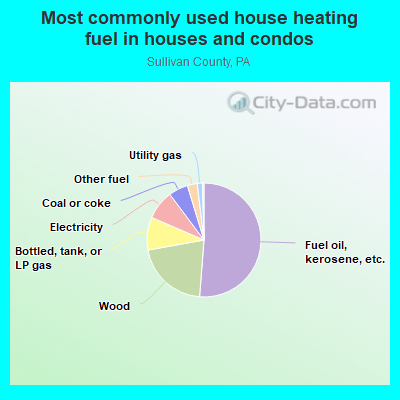
- 49.3%Fuel oil, kerosene, etc.
- 21.3%Wood
- 10.9%Bottled, tank, or LP gas
- 9.4%Electricity
- 5.3%Coal or coke
- 2.5%Other fuel
- 1.2%Utility gas
- 0.2%No fuel used
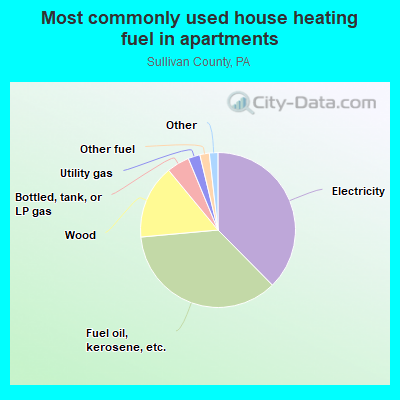
- 45.1%Electricity
- 30.4%Fuel oil, kerosene, etc.
- 12.3%Wood
- 7.3%Bottled, tank, or LP gas
- 2.1%Utility gas
- 1.8%Other fuel
- 0.8%Coal or coke
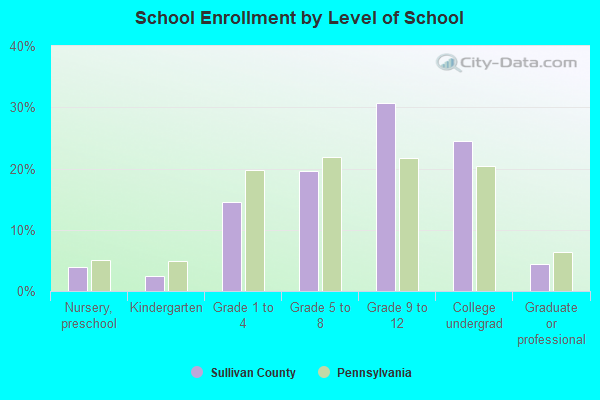
Private vs. public school enrollment:
| Here: | 9.3% |
| Pennsylvania: | 15.7% |
| Here: | 15.1% |
| Pennsylvania: | 13.4% |
| Here: | 32.6% |
| Pennsylvania: | 39.8% |
Sullivan County government finances - Expenditure in 2020:
- Charges - Other: $293,000
Other: $250,000
Natural Resources - Other: $18,000
Natural Resources - Other: $16,000
- Current Operations - Central Staff Services: $1,875,000
Central Staff Services: $1,760,000
Police Protection: $1,432,000
Judicial and Legal Services: $1,053,000
Natural Resources - Other: $949,000
Judicial and Legal Services: $786,000
Public Welfare - Other: $752,000
Public Welfare - Other: $742,000
General - Other: $736,000
Natural Resources - Other: $711,000
Police Protection: $568,000
Health - Other: $501,000
General - Other: $236,000
Parks and Recreation: $214,000
Parks and Recreation: $203,000
Health - Other: $152,000
- Federal Intergovernmental - Natural Resources: $672,000
Natural Resources: $619,000
- General - Interest on Debt: $45,000
Interest on Debt: $40,000
- Long Term Debt - Beginning Outstanding - Unspecified Public Purpose: $1,711,000
Outstanding Unspecified Public Purpose: $1,593,000
Beginning Outstanding - Unspecified Public Purpose: $1,472,000
Outstanding Unspecified Public Purpose: $1,352,000
Retired Unspecified Public Purpose: $120,000
Retired Unspecified Public Purpose: $118,000
- Miscellaneous - General Revenue - Other: $86,000
General Revenue - Other: $68,000
Interest Earnings: $52,000
Interest Earnings: $47,000
- Other Capital Outlay - Central Staff Services: $766,000
Central Staff Services: $222,000
General - Other: $55,000
General - Other: $7,000
- Other Funds - Cash and Securities: $4,853,000
Cash and Securities: $4,277,000
- State Intergovernmental - General Local Government Support: $1,752,000
Other: $1,545,000
General Local Government Support: $1,298,000
Other: $1,054,000
- Tax - Property: $2,823,000
Property: $2,667,000
Other Selective Sales: $50,000
Other Selective Sales: $42,000
Other License: $3,000
- Total Salaries and Wages: $1,921,000
: $1,919,000
Sullivan County government finances - Revenue in 2020:
- Charges - Other: $293,000
Other: $250,000
Natural Resources - Other: $18,000
Natural Resources - Other: $16,000
- Current Operations - Central Staff Services: $1,875,000
Central Staff Services: $1,760,000
Police Protection: $1,432,000
Judicial and Legal Services: $1,053,000
Natural Resources - Other: $949,000
Judicial and Legal Services: $786,000
Public Welfare - Other: $752,000
Public Welfare - Other: $742,000
General - Other: $736,000
Natural Resources - Other: $711,000
Police Protection: $568,000
Health - Other: $501,000
General - Other: $236,000
Parks and Recreation: $214,000
Parks and Recreation: $203,000
Health - Other: $152,000
- Federal Intergovernmental - Natural Resources: $672,000
Natural Resources: $619,000
- General - Interest on Debt: $45,000
Interest on Debt: $40,000
- Long Term Debt - Beginning Outstanding - Unspecified Public Purpose: $1,711,000
Outstanding Unspecified Public Purpose: $1,593,000
Beginning Outstanding - Unspecified Public Purpose: $1,472,000
Outstanding Unspecified Public Purpose: $1,352,000
Retired Unspecified Public Purpose: $120,000
Retired Unspecified Public Purpose: $118,000
- Miscellaneous - General Revenue - Other: $86,000
General Revenue - Other: $68,000
Interest Earnings: $52,000
Interest Earnings: $47,000
- Other Capital Outlay - Central Staff Services: $766,000
Central Staff Services: $222,000
General - Other: $55,000
General - Other: $7,000
- Other Funds - Cash and Securities: $4,853,000
Cash and Securities: $4,277,000
- State Intergovernmental - General Local Government Support: $1,752,000
Other: $1,545,000
General Local Government Support: $1,298,000
Other: $1,054,000
- Tax - Property: $2,823,000
Property: $2,667,000
Other Selective Sales: $50,000
Other Selective Sales: $42,000
Other License: $3,000
- Total Salaries and Wages: $1,921,000
: $1,919,000
Sullivan County government finances - Debt in 2020:
- Charges - Other: $293,000
Other: $250,000
Natural Resources - Other: $18,000
Natural Resources - Other: $16,000
- Current Operations - Central Staff Services: $1,875,000
Central Staff Services: $1,760,000
Police Protection: $1,432,000
Judicial and Legal Services: $1,053,000
Natural Resources - Other: $949,000
Judicial and Legal Services: $786,000
Public Welfare - Other: $752,000
Public Welfare - Other: $742,000
General - Other: $736,000
Natural Resources - Other: $711,000
Police Protection: $568,000
Health - Other: $501,000
General - Other: $236,000
Parks and Recreation: $214,000
Parks and Recreation: $203,000
Health - Other: $152,000
- Federal Intergovernmental - Natural Resources: $672,000
Natural Resources: $619,000
- General - Interest on Debt: $45,000
Interest on Debt: $40,000
- Long Term Debt - Beginning Outstanding - Unspecified Public Purpose: $1,711,000
Outstanding Unspecified Public Purpose: $1,593,000
Beginning Outstanding - Unspecified Public Purpose: $1,472,000
Outstanding Unspecified Public Purpose: $1,352,000
Retired Unspecified Public Purpose: $120,000
Retired Unspecified Public Purpose: $118,000
- Miscellaneous - General Revenue - Other: $86,000
General Revenue - Other: $68,000
Interest Earnings: $52,000
Interest Earnings: $47,000
- Other Capital Outlay - Central Staff Services: $766,000
Central Staff Services: $222,000
General - Other: $55,000
General - Other: $7,000
- Other Funds - Cash and Securities: $4,853,000
Cash and Securities: $4,277,000
- State Intergovernmental - General Local Government Support: $1,752,000
Other: $1,545,000
General Local Government Support: $1,298,000
Other: $1,054,000
- Tax - Property: $2,823,000
Property: $2,667,000
Other Selective Sales: $50,000
Other Selective Sales: $42,000
Other License: $3,000
- Total Salaries and Wages: $1,921,000
: $1,919,000
Sullivan County government finances - Cash and Securities in 2020:
- Charges - Other: $293,000
Other: $250,000
Natural Resources - Other: $18,000
Natural Resources - Other: $16,000
- Current Operations - Central Staff Services: $1,875,000
Central Staff Services: $1,760,000
Police Protection: $1,432,000
Judicial and Legal Services: $1,053,000
Natural Resources - Other: $949,000
Judicial and Legal Services: $786,000
Public Welfare - Other: $752,000
Public Welfare - Other: $742,000
General - Other: $736,000
Natural Resources - Other: $711,000
Police Protection: $568,000
Health - Other: $501,000
General - Other: $236,000
Parks and Recreation: $214,000
Parks and Recreation: $203,000
Health - Other: $152,000
- Federal Intergovernmental - Natural Resources: $672,000
Natural Resources: $619,000
- General - Interest on Debt: $45,000
Interest on Debt: $40,000
- Long Term Debt - Beginning Outstanding - Unspecified Public Purpose: $1,711,000
Outstanding Unspecified Public Purpose: $1,593,000
Beginning Outstanding - Unspecified Public Purpose: $1,472,000
Outstanding Unspecified Public Purpose: $1,352,000
Retired Unspecified Public Purpose: $120,000
Retired Unspecified Public Purpose: $118,000
- Miscellaneous - General Revenue - Other: $86,000
General Revenue - Other: $68,000
Interest Earnings: $52,000
Interest Earnings: $47,000
- Other Capital Outlay - Central Staff Services: $766,000
Central Staff Services: $222,000
General - Other: $55,000
General - Other: $7,000
- Other Funds - Cash and Securities: $4,853,000
Cash and Securities: $4,277,000
- State Intergovernmental - General Local Government Support: $1,752,000
Other: $1,545,000
General Local Government Support: $1,298,000
Other: $1,054,000
- Tax - Property: $2,823,000
Property: $2,667,000
Other Selective Sales: $50,000
Other Selective Sales: $42,000
Other License: $3,000
- Total Salaries and Wages: $1,921,000
: $1,919,000
Supplemental Security Income (SSI) in 2006:
- Total number of recipients: 128
- Number of aged recipients: 13
- Number of blind and disabled recipients: 115
- Number of recipients under 18: 10
- Number of recipients between 18 and 64: 90
- Number of recipients older than 64: 28
- Number of recipients also receiving OASDI: 45
- Amount of payments (thousands of dollars): 48
| Most common first names in Sullivan County, PA among deceased individuals | ||
| Name | Count | Lived (average) |
|---|---|---|
| Mary | 62 | 80.1 years |
| John | 52 | 73.6 years |
| Anna | 30 | 85.3 years |
| Helen | 28 | 81.2 years |
| William | 28 | 77.8 years |
| Joseph | 27 | 72.1 years |
| James | 23 | 74.0 years |
| George | 22 | 76.9 years |
| Robert | 22 | 70.0 years |
| Edward | 18 | 70.4 years |
| Most common last names in Sullivan County, PA among deceased individuals | ||
| Last name | Count | Lived (average) |
|---|---|---|
| Yonkin | 15 | 81.5 years |
| Sick | 13 | 73.4 years |
| Mcdonald | 11 | 74.7 years |
| Smith | 11 | 75.4 years |
| Bahr | 11 | 76.7 years |
| Farrell | 10 | 75.0 years |
| Shaffer | 10 | 77.9 years |
| Kinsley | 9 | 81.2 years |
| Dieffenbach | 8 | 82.6 years |
| Ryan | 8 | 69.3 years |
Businesses in Sullivan County, PA
- Ford: 1
- Subway: 1
- True Value: 1
Sullivan County on our top lists:
- #18 on the list of "Top 101 counties with the highest number of deaths per 1000 residents 2007-2013"