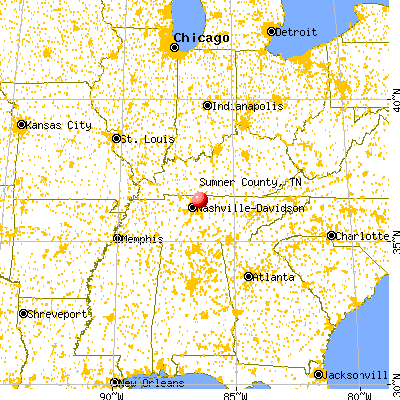
Sumner County, Tennessee (TN)
County owner-occupied free and clear houses and condos in 2010: 12,185
County owner-occupied houses and condos in 2000: 36,970
Renter-occupied apartments: 15,907 (it was 11,971 in 2000)
| % of renters here: | 24% |
| State: | 32% |
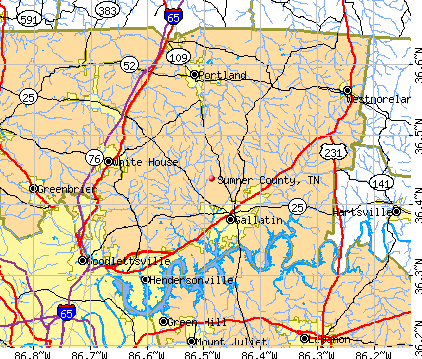
Land area: 529 sq. mi.
Water area: 13.8 sq. mi.
Population density: 385 people per square mile (high).
Industries providing employment: Educational, health and social services (21.6%), Retail trade (13.4%), Professional, scientific, management, administrative, and waste management services (11.2%).
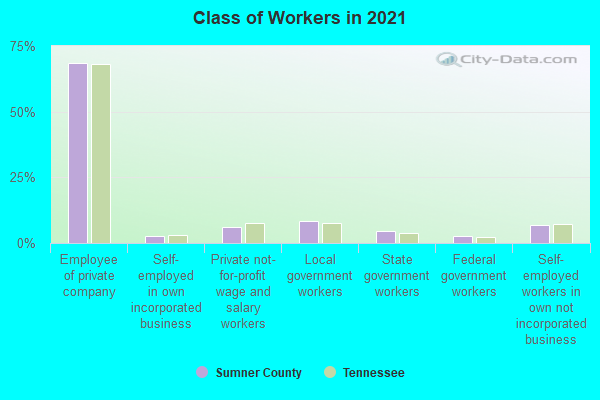
Type of workers:
- Private wage or salary: 80%
- Government: 13%
- Self-employed, not incorporated: 7%
- Unpaid family work: 0%
- OSM Map
- General Map
- Google Map
- MSN Map

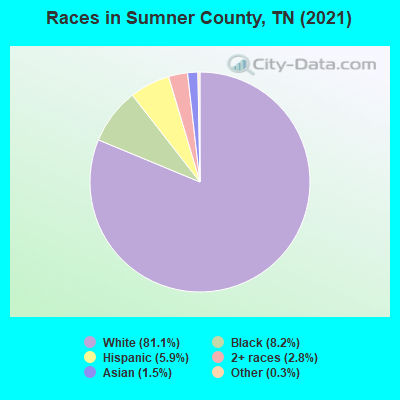
- 163,33780.1%White Non-Hispanic Alone
- 17,5048.6%Black Non-Hispanic Alone
- 12,6496.2%Hispanic or Latino
- 5,9372.9%Two or more races
- 2,7601.4%Asian alone
- 1,4120.7%Some other race alone
- 1460.07%Native Hawaiian and Other
Pacific Islander alone - 1130.06%American Indian and Alaska Native alone
| Median resident age: | 40.4 years |
| Tennessee median age: | 39.2 years |
| Males: 99,320 | |
| Females: 104,538 |

 | Middle Schools in Sumner County (7 replies) |
| Indian Lake/Hendersonville Developments (892 replies) |
| Tennessee's 2020 Census results (70 replies) |
| Sumner County School Choice/Zoning (5 replies) |
| Why doesn't Nashville have a bypass? (103 replies) |
| Looking to Move Northern (country) Nashville (5 replies) |
| Sumner County: | 2.0 people |
| Tennessee: | 2 people |
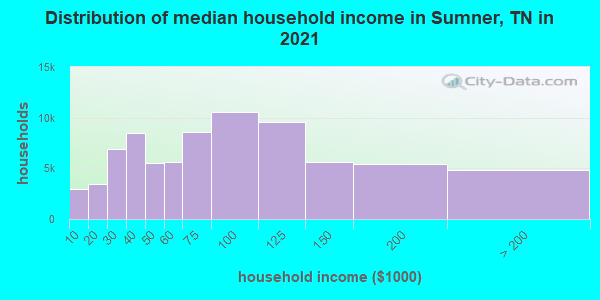
Estimated median household income in 2022: $88,764 ($46,030 in 1999)
| This county: | $88,764 |
| Tennessee: | $65,254 |
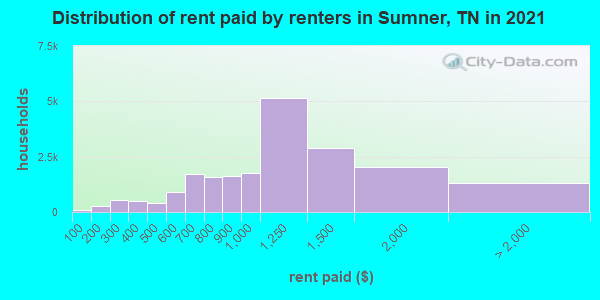
Median contract rent in 2022 for apartments: $1,192 (lower quartile is $833, upper quartile is $1,638)
| This county: | $1192 |
| State: | $884 |
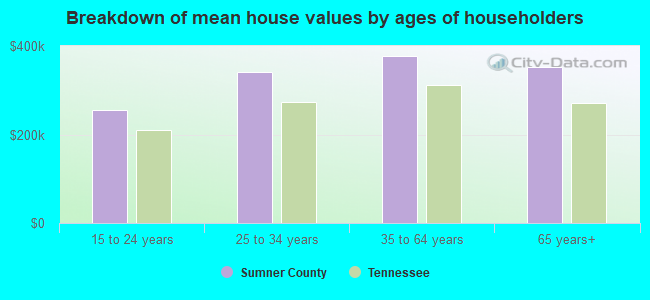
Estimated median house or condo value in 2022: $395,300 (it was $121,000 in 2000)
| Sumner: | $395,300 |
| Tennessee: | $284,800 |
Mean price in 2022:
Median monthly housing costs for homes and condos with a mortgage: $1,762Detached houses: $403,311
Here: $403,311 State: $374,382 Townhouses or other attached units: $319,936
Here: $319,936 State: $354,101 In 2-unit structures: $298,915
Here: $298,915 State: $247,693 In 3-to-4-unit structures: $261,361
Here: $261,361 State: $239,060 In 5-or-more-unit structures: $271,607
Here: $271,607 State: $317,434 Mobile homes: $178,134
Here: $178,134 State: $101,421
Median monthly housing costs for units without a mortgage: $522
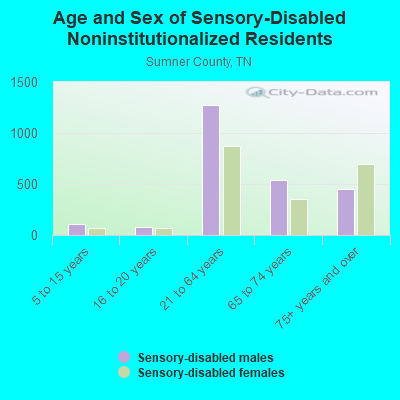
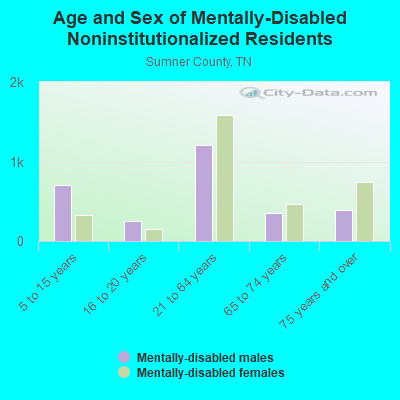
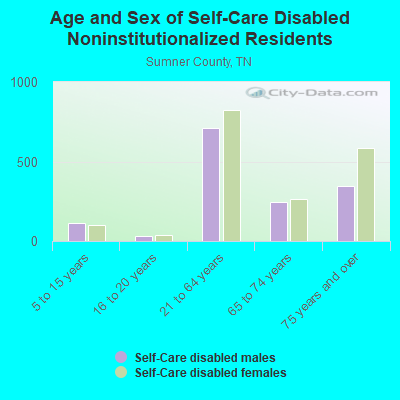
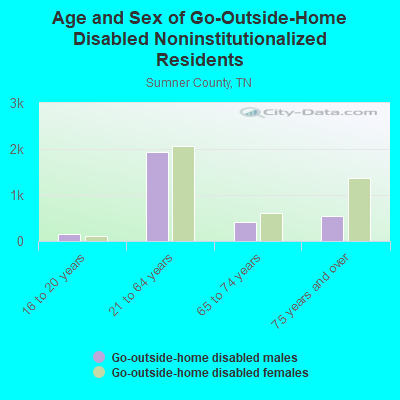
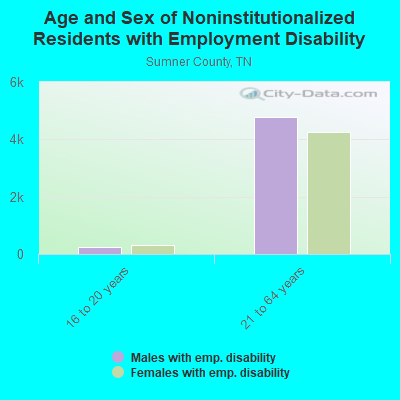
Institutionalized population: 1,194
Crime in 2021 (reported by the sheriff's office or county police, not the county total):
- Murders: 2
- Rapes: 12
- Robberies: 6
- Assaults: 110
- Burglaries: 75
- Thefts: 212
- Auto thefts: 45
Crime in 2020 (reported by the sheriff's office or county police, not the county total):
- Murders: 2
- Rapes: 9
- Robberies: 5
- Assaults: 105
- Burglaries: 80
- Thefts: 242
- Auto thefts: 53
Health of residents in Sumner County based on CDC Behavioral Risk Factor Surveillance System Survey Questionnaires from 2013 to 2021:
General health status score of residents in this county from 1 (poor) to 5 (excellent) is 3.5. This is about average.69.9% of residents exercised in the past month. This is less than average.
42.1% of residents smoked 100+ cigarettes in their lives. This is about average.
48.0% of adult residents drank alcohol in the past 30 days. This is less than average.
65.5% of residents visited a dentist within the past year. This is less than average.
Average weight of males is 202 pounds. This is more than average.
Average weight of females is 168 pounds. This is more than average.
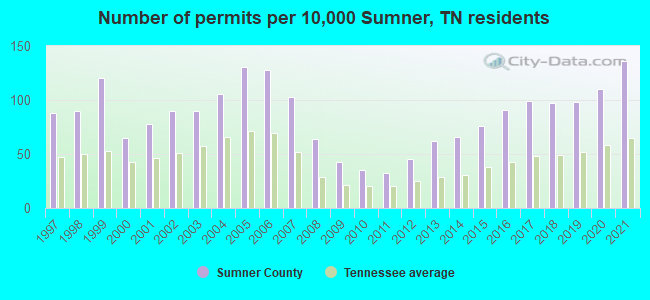
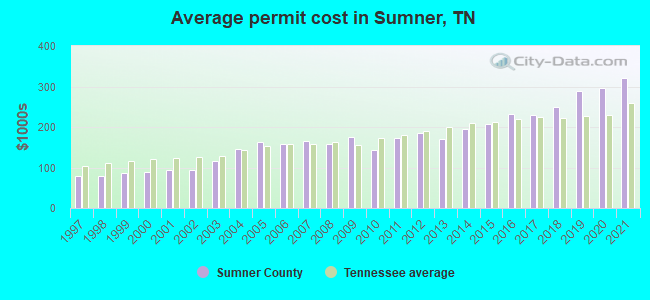
Single-family new house construction building permits:
- 2022: 1609 buildings, average cost: $315,400
- 2021: 1775 buildings, average cost: $319,600
- 2020: 1434 buildings, average cost: $297,300
- 2019: 1284 buildings, average cost: $289,100
- 2018: 1262 buildings, average cost: $249,500
- 2017: 1294 buildings, average cost: $229,300
- 2016: 1187 buildings, average cost: $231,300
- 2015: 996 buildings, average cost: $208,000
- 2014: 865 buildings, average cost: $193,900
- 2013: 813 buildings, average cost: $170,400
- 2012: 589 buildings, average cost: $184,100
- 2011: 422 buildings, average cost: $171,800
- 2010: 452 buildings, average cost: $143,100
- 2009: 564 buildings, average cost: $175,300
- 2008: 841 buildings, average cost: $158,500
- 2007: 1344 buildings, average cost: $166,400
- 2006: 1673 buildings, average cost: $158,800
- 2005: 1703 buildings, average cost: $163,600
- 2004: 1382 buildings, average cost: $144,700
- 2003: 1176 buildings, average cost: $117,100
- 2002: 1171 buildings, average cost: $95,200
- 2001: 1011 buildings, average cost: $93,200
- 2000: 846 buildings, average cost: $88,300
- 1999: 1563 buildings, average cost: $85,800
- 1998: 1180 buildings, average cost: $80,000
- 1997: 1148 buildings, average cost: $78,700
Median real estate property taxes paid for housing units with mortgages in 2022: $1,950 (0.5%)
Median real estate property taxes paid for housing units with no mortgage in 2022: $1,880 (0.5%)

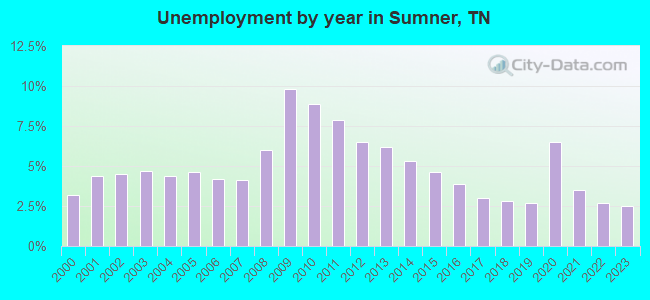
| Sumner County: | 6.4% |
| Tennessee: | 13.3% |
Median age of residents in 2022: 40.4 years old
(Males: 40.2 years old, Females: 40.7 years old)
(Median age for: White residents: 43.2 years old, Black residents: 32.7 years old, American Indian residents: 42.6 years old, Asian residents: 36.6 years old, Hispanic or Latino residents: 27.2 years old, Other race residents: 26.1 years old)
Area name: Nashville-Davidson--Murfreesboro, TN HUD Metro FMR Area
Fair market rent in 2006 for a 1-bedroom apartment in Sumner County is $579 a month.
Fair market rent for a 2-bedroom apartment is $666 a month.
Fair market rent for a 3-bedroom apartment is $864 a month.
Cities in this county include: Hendersonville, Gallatin, Portland, White House, Millersville, Castalian Springs, Bethpage, Shackle Island, Westmoreland, Walnut Grove.
2023 air pollution in Sumner County:
Particulate Matter (PM2.5) Annual: 8.1 µg/m3(standard limit: 15.0 µg/m3). Near U.S. average.
Notable locations in this county outside city limits:
Creek: Mud Creek (A). Display/hide its location on the map
Neighboring counties: Major County, Oklahoma  , Mayes County, Oklahoma , Patrick County, Virginia
  , Ozark County, Missouri , Wythe County, Virginia .
| Here: | 2.4% |
| Tennessee: | 3.0% |
Current college students: 4,410
People 25 years of age or older with a high school degree or higher: 93.7%
People 25 years of age or older with a bachelor's degree or higher: 34.9%
Number of foreign born residents: 7,706 (44.3% naturalized citizens)
| Sumner County: | 3.8% |
| Whole state: | 5.6% |

- Year of entry for the foreign-born population
- 2,9412010 or later
- 2,2052000 to 2009
- 1,7991990 to 1999
- 7481980 to 1989
- 3901970 to 1979
- 382Before 1970
Mean travel time to work (commute): minutes
Percentage of county residents living and working in this county: 97.2%
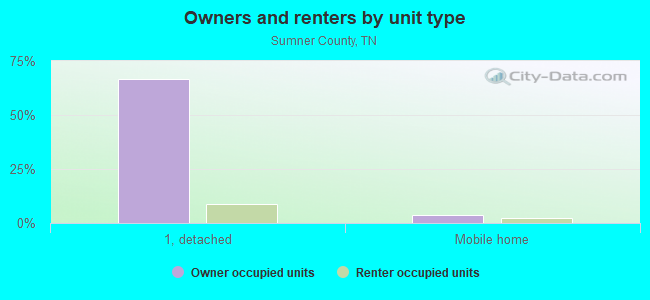
Housing units in structures:
- One, detached: 61,614
- One, attached: 3,133
- Two: 896
- 3 or 4: 1,992
- 5 to 9: 2,429
- 10 to 19: 3,244
- 20 to 49: 2,952
- 50 or more: 2,103
- Mobile homes: 5,026
Housing units in Sumner County with a mortgage: 38,227 (3,238 second mortgage, 51 home equity loan, 2,630 both second mortgage and home equity loan)
Houses without a mortgage: 371
| Here: | 9.3% with mortgage |
| State: | 97.8% with mortgage |
Religion statistics for Sumner County
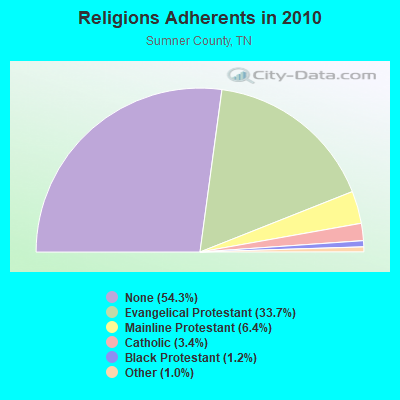
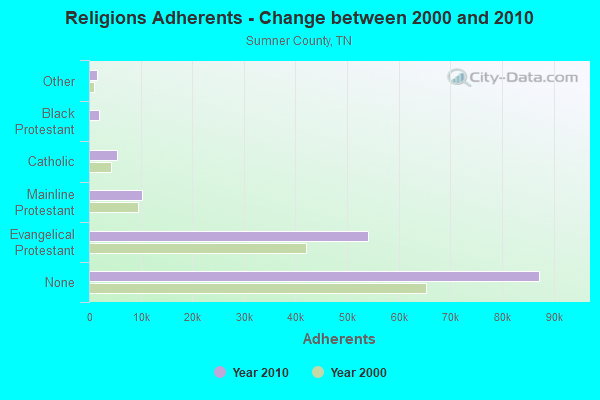
| Religion | Adherents | Congregations |
|---|---|---|
| Evangelical Protestant | 54,140 | 135 |
| Mainline Protestant | 10,205 | 27 |
| Catholic | 5,500 | 2 |
| Black Protestant | 1,961 | 9 |
| Other | 1,579 | 6 |
| None | 87,260 | - |
Source: Clifford Grammich, Kirk Hadaway, Richard Houseal, Dale E.Jones, Alexei Krindatch, Richie Stanley and Richard H.Taylor. 2012. 2010 U.S.Religion Census: Religious Congregations & Membership Study. Association of Statisticians of American Religious Bodies. Jones, Dale E., et al. 2002. Congregations and Membership in the United States 2000. Nashville, TN: Glenmary Research Center.
Food Environment Statistics:
| Sumner County: | 1.77 / 10,000 pop. |
| State: | 1.99 / 10,000 pop. |
| Here: | 0.07 / 10,000 pop. |
| Tennessee: | 0.17 / 10,000 pop. |
| This county: | 0.39 / 10,000 pop. |
| Tennessee: | 0.65 / 10,000 pop. |
| Sumner County: | 4.26 / 10,000 pop. |
| Tennessee: | 5.16 / 10,000 pop. |
| This county: | 5.64 / 10,000 pop. |
| State: | 6.56 / 10,000 pop. |
| Sumner County: | 12.1% |
| Tennessee: | 11.4% |
| Sumner County: | 28.2% |
| State: | 30.2% |
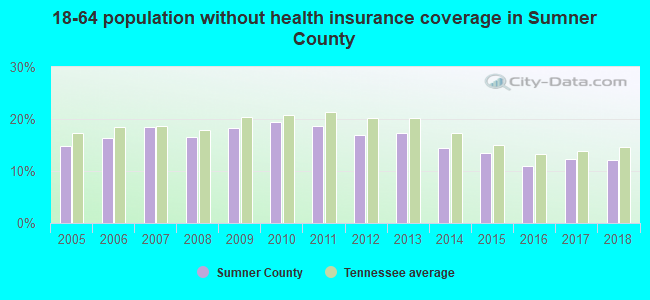
| Here: | 16.7% |
| State: | 13.5% |
Agriculture in Sumner County:
Average size of farms: 99 acresAverage value of agricultural products sold per farm: $13,372
Average value of crops sold per acre for harvested cropland: $224.39
The value of nursery, greenhouse, floriculture, and sod as a percentage of the total market value of agricultural products sold: 12.38%
The value of livestock, poultry, and their products as a percentage of the total market value of agricultural products sold: 45.90%
Average total farm production expenses per farm: $14,237
Harvested cropland as a percentage of land in farms: 32.62%
Average market value of all machinery and equipment per farm: $35,243
The percentage of farms operated by a family or individual: 94.89%
Average age of principal farm operators: 56 years
Average number of cattle and calves per 100 acres of all land in farms: 21.40
Milk cows as a percentage of all cattle and calves: 2.14%
Corn for grain: 5395 harvested acres
All wheat for grain: 3780 harvested acres
Soybeans for beans: 9602 harvested acres
Vegetables: 155 harvested acres
Land in orchards: 61 acres
Tornado activity:
Sumner County historical area-adjusted tornado activity is significantly below Tennessee state average. It is 26894279.6 times below overall U.S. average.Earthquake activity:
Sumner County-area historical earthquake activity is significantly above Tennessee state average. It is 181% greater than the overall U.S. average.On 4/18/2008 at 09:36:59, a magnitude 5.4 (5.1 MB, 4.8 MS, 5.4 MW, 5.2 MW, Class: Moderate, Intensity: VI - VII) earthquake occurred 159.2 miles away from Sumner County center
On 4/18/2008 at 09:36:59, a magnitude 5.2 (5.2 MW, Depth: 8.9 mi) earthquake occurred 159.1 miles away from the county center
On 6/18/2002 at 17:37:15, a magnitude 5.0 (4.3 MB, 4.6 MW, 5.0 LG) earthquake occurred 128.7 miles away from the county center
On 7/27/1980 at 18:52:21, a magnitude 5.2 (5.1 MB, 4.7 MS, 5.0 UK, 5.2 UK) earthquake occurred 185.9 miles away from the county center
On 6/10/1987 at 23:48:54, a magnitude 5.1 (4.9 MB, 4.4 MS, 4.6 MS, 5.1 LG) earthquake occurred 181.8 miles away from Sumner County center
On 4/29/2003 at 08:59:39, a magnitude 4.9 (4.4 MB, 4.6 MW, 4.9 LG, Class: Light, Intensity: IV - V) earthquake occurred 142.8 miles away from the county center
Magnitude types: regional Lg-wave magnitude (LG), body-wave magnitude (MB), surface-wave magnitude (MS), moment magnitude (MW)
Most recent natural disasters:
- Tennessee Covid-19 Pandemic, Incident Period: January 20, 2020, FEMA Id: 4514, Natural disaster type: Other
- Tennessee Severe Storms, Flooding, Tornadoes, and Straight-Line Winds, Incident Period: April 04, 2011, Major Disaster (Presidential) Declared DR-1978: May 09, 2011, FEMA Id: 1978, Natural disaster type: Storm, Tornado, Flood, Wind
- Tennessee Severe Storms, Flooding, Straight-Line Winds, and Tornadoes, Incident Period: April 30, 2010 to May 18, 2010, Major Disaster (Presidential) Declared DR-1909: May 04, 2010, FEMA Id: 1909, Natural disaster type: Storm, Tornado, Flood, Wind
- Tennessee Severe Storms, Tornadoes, Straight-line Winds, and Flooding, Incident Period: February 05, 2008 to February 06, 2008, Major Disaster (Presidential) Declared DR-1745: February 07, 2008, FEMA Id: 1745, Natural disaster type: Storm, Tornado, Flood, Wind
- Tennessee Severe Storms and Tornadoes, Incident Period: April 02, 2006 to April 08, 2006, Major Disaster (Presidential) Declared DR-1634: April 05, 2006, FEMA Id: 1634, Natural disaster type: Storm, Tornado
- Tennessee Hurricane Katrina Evacuation, Incident Period: August 29, 2005 to October 01, 2005, Emergency Declared EM-3217: September 05, 2005, FEMA Id: 3217, Natural disaster type: Hurricane
- Tennessee Severe Storms, Tornadoes and Flooding, Incident Period: May 04, 2003 to May 30, 2003, Major Disaster (Presidential) Declared DR-1464: May 08, 2003, FEMA Id: 1464, Natural disaster type: Storm, Tornado, Flood
- Tennessee Severe Storms, Tornadoes and Flooding, Incident Period: November 09, 2002 to November 12, 2002, Major Disaster (Presidential) Declared DR-1441: November 13, 2002, FEMA Id: 1441, Natural disaster type: Storm, Tornado, Flood
- Tennessee Severe Storms, Tornadoes and Flooding, Incident Period: May 05, 1999 to May 19, 1999, Major Disaster (Presidential) Declared DR-1275: May 12, 1999, FEMA Id: 1275, Natural disaster type: Storm, Tornado, Flood
- Tennessee Severe Storms, Tornadoes and Flooding, Incident Period: April 16, 1998 to May 18, 1998, Major Disaster (Presidential) Declared DR-1215: April 20, 1998, FEMA Id: 1215, Natural disaster type: Storm, Tornado, Flood
- 4 other natural disasters have been reported since 1953.
The number of natural disasters in Sumner County (14) is near the US average (15).
Major Disasters (Presidential) Declared: 12
Emergencies Declared: 1
Causes of natural disasters: Storms: 11, Floods: 10, Tornadoes: 8, Winds: 3, Flash Flood: 1, Hurricane: 1, Ice Storm: 1, Winter Storm: 1, Other: 1 (Note: some incidents may be assigned to more than one category).
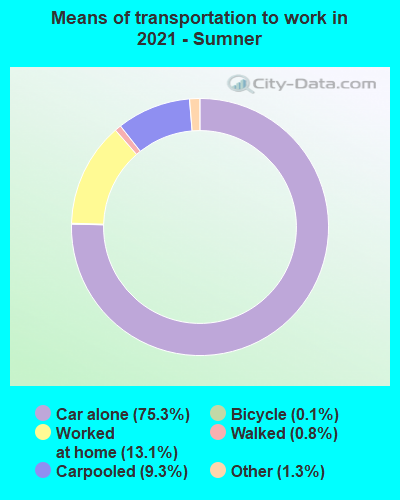
Means of transportation to work:
- Drove a car alone: 54,367 (69.4%)
- Carpooled: 6,807 (8.7%)
- Bus: 54 (0.1%)
- Taxicab, motorcycle, or other means: 1,407 (1.8%)
- Bicycle: 73 (0.1%)
- Walked: 642 (0.8%)
- Worked at home: 17,204 (22.0%)
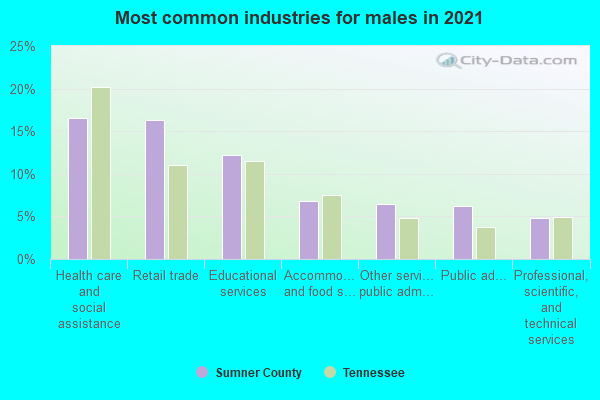
- Health care and social assistance (27%)
- Retail trade (13%)
- Educational services (11%)
- Accommodation and food services (8%)
- Finance and insurance (6%)
- Professional, scientific, and technical services (6%)
- Other services, except public administration (5%)
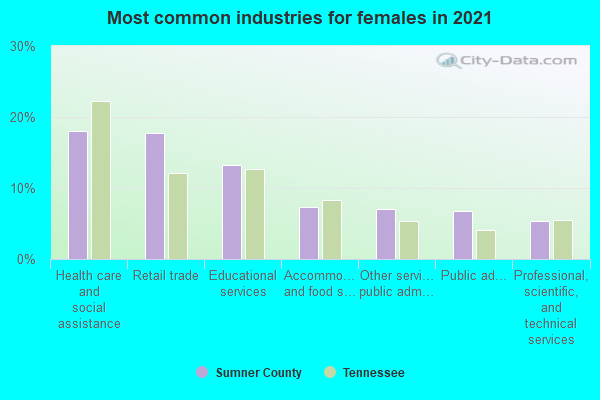
- Health care and social assistance (28%)
- Retail trade (13%)
- Educational services (11%)
- Accommodation and food services (8%)
- Finance and insurance (6%)
- Professional, scientific, and technical services (6%)
- Other services, except public administration (5%)
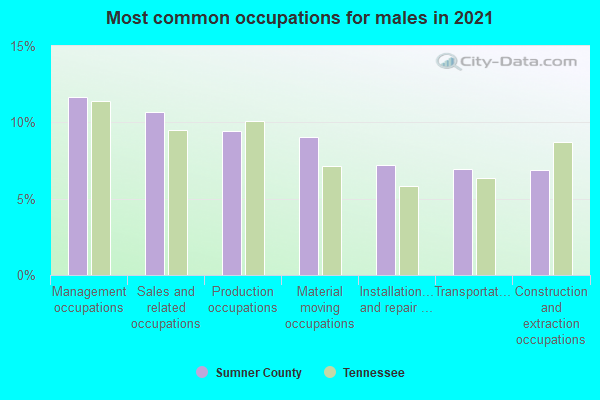
- Management occupations (17%)
- Sales and related occupations (10%)
- Installation, maintenance, and repair occupations (7%)
- Production occupations (7%)
- Construction and extraction occupations (7%)
- Transportation occupations (6%)
- Office and administrative support occupations (5%)
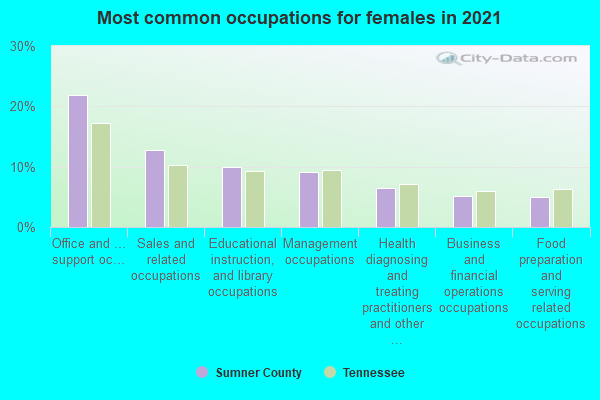
- Office and administrative support occupations (20%)
- Management occupations (11%)
- Educational instruction, and library occupations (11%)
- Health diagnosing and treating practitioners and other technical occupations (9%)
- Sales and related occupations (9%)
- Business and financial operations occupations (6%)
- Food preparation and serving related occupations (5%)
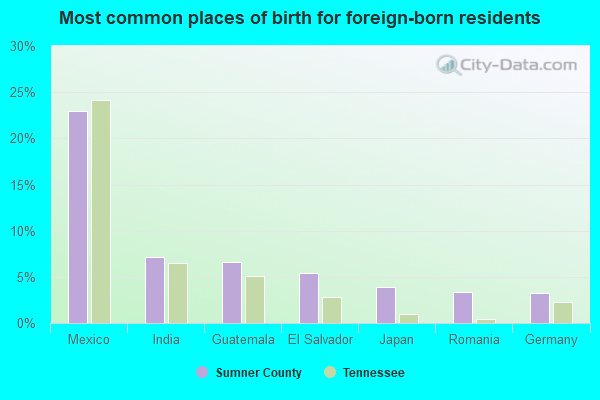
- Mexico (20%)
- El Salvador (7%)
- India (6%)
- Guatemala (4%)
- Romania (4%)
- Venezuela (4%)
- Japan (4%)
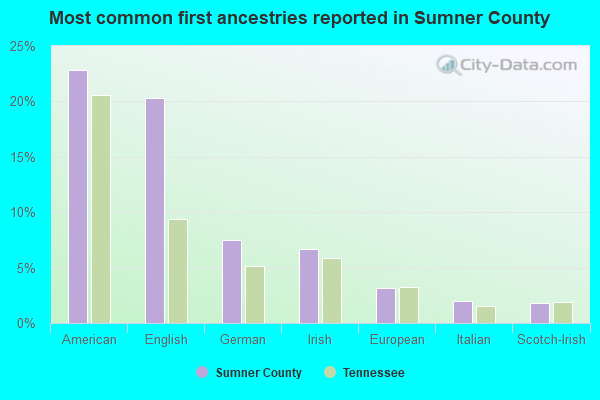
- American (27%)
- English (17%)
- German (7%)
- Irish (6%)
- European (3%)
- Scotch-Irish (2%)
- Scottish (2%)
People in group quarters in Sumner County, Tennessee in 2010:
- 632 people in nursing facilities/skilled-nursing facilities
- 549 people in local jails and other municipal confinement facilities
- 36 people in group homes intended for adults
- 13 people in correctional facilities intended for juveniles
- 13 people in emergency and transitional shelters (with sleeping facilities) for people experiencing homelessness
- 9 people in workers' group living quarters and job corps centers
People in group quarters in Sumner County, Tennessee in 2000:
- 938 people in nursing homes
- 275 people in local jails and other confinement facilities (including police lockups)
- 81 people in other noninstitutional group quarters
- 50 people in homes for the mentally retarded
- 22 people in homes for abused, dependent, and neglected children
- 8 people in agriculture workers' dormitories on farms
- 5 people in wards in general hospitals for patients who have no usual home elsewhere
- 5 people in other workers' dormitories
- 4 people in other nonhousehold living situations
- 3 people in homes or halfway houses for drug/alcohol abuse
10.06% of this county's 2021 resident taxpayers lived in other counties in 2020 ($72,675 average adjusted gross income)
| Here: | 10.06% |
| Tennessee average: | 8.49% |
10 or fewer of this county's residents moved from foreign countries.
5.65% relocated from other counties in Tennessee ($34,393 average AGI)
4.41% relocated from other states ($38,282 average AGI)
Sumner County: 4.41% Tennessee average: 4.34%
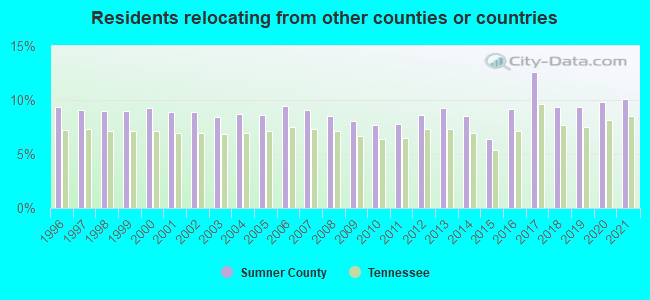
Top counties from which taxpayers relocated into this county between 2020 and 2021:
| from Davidson County, TN | |
| from Robertson County, TN | |
| from Wilson County, TN | |
| from Rutherford County, TN | |
| from Macon County, TN | |
| from Williamson County, TN | |
| from Montgomery County, TN |
8.17% of this county's 2020 resident taxpayers moved to other counties in 2021 ($57,585 average adjusted gross income)
| Here: | 8.17% |
| Tennessee average: | 7.40% |
10 or fewer of this county's residents moved to foreign countries.
5.06% relocated to other counties in Tennessee ($33,766 average AGI)
3.11% relocated to other states ($23,819 average AGI)
Sumner County: 3.11% Tennessee average: 3.20%
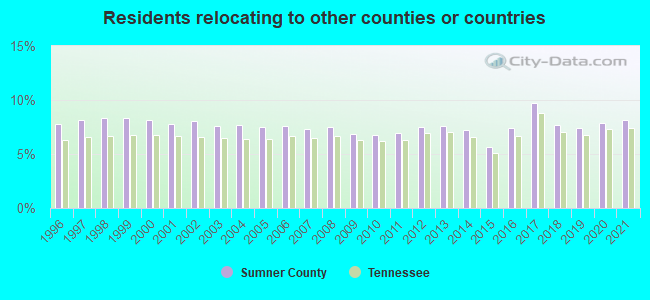
Top counties to which taxpayers relocated from this county between 2020 and 2021:
| to Davidson County, TN | |
| to Robertson County, TN | |
| to Wilson County, TN | |
| to Rutherford County, TN | |
| to Macon County, TN | |
| to Montgomery County, TN | |
| to Simpson County, KY |
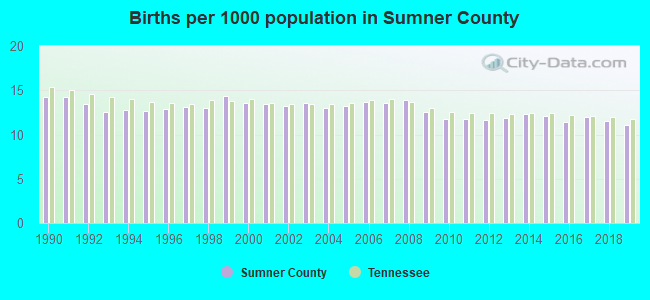
Births per 1000 population from 1990 to 1999: 13.3
Births per 1000 population from 2000 to 2009: 13.4
Births per 1000 population from 2010 to 2022: 9.9
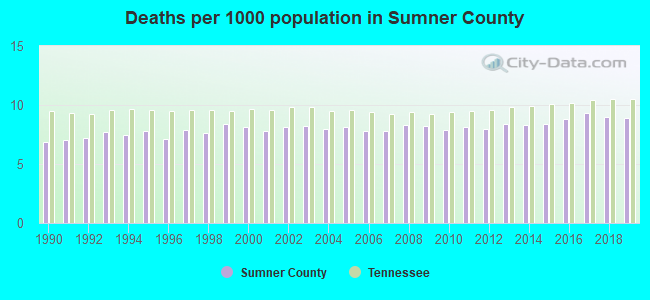
Deaths per 1000 population from 1990 to 1999: 7.5
Deaths per 1000 population from 2000 to 2009: 8.0
Deaths per 1000 population from 2010 to 2020: 8.7
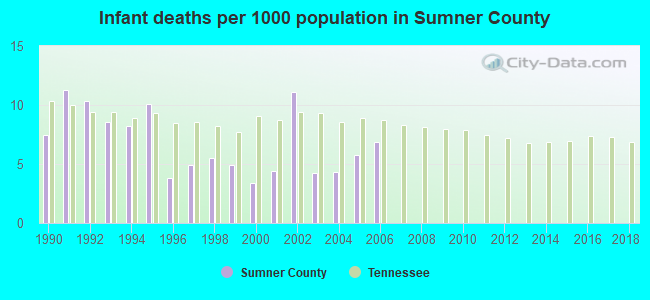
Infant deaths per 1000 live births from 1990 to 1999: 7.5
Infant deaths per 1000 live births from 2000 to 2006: 5.7
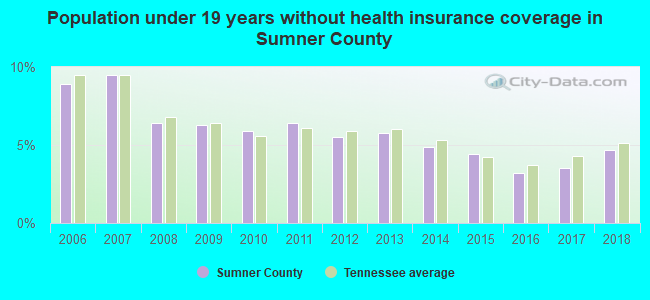
Persons under 19 years old without health insurance coverage in 2018: 4.7%

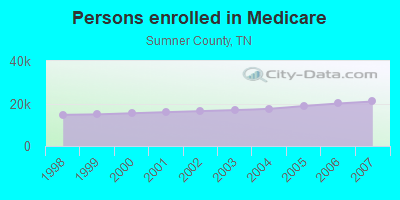
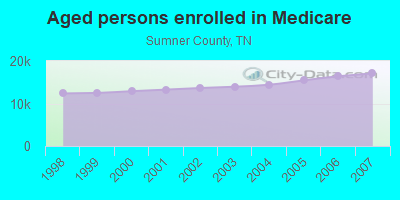
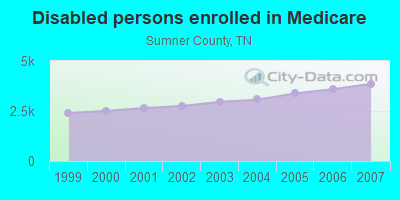
Persons enrolled in hospital insurance and/or supplemental medical insurance (Medicare) in July 1, 2007: 20,949 (17,092 aged, 3,857 disabled)
Children under 18 without health insurance coverage in 2007: 2,379 (6%)
Most common underlying causes of death in Sumner County, Tennessee in 1999 - 2019:
- Bronchus or lung, unspecified - Malignant neoplasms (1,942)
- Atherosclerotic cardiovascular disease, so described (1,545)
- Acute myocardial infarction, unspecified (1,515)
- Atherosclerotic heart disease (1,333)
- Alzheimer disease, unspecified (1,299)
- Chronic obstructive pulmonary disease, unspecified (1,186)
- Stroke, not specified as haemorrhage or infarction (846)
- Unspecified dementia (756)
- Pneumonia, unspecified (559)
- Breast, unspecified - Malignant neoplasms (408)
Population without health insurance coverage in 2000: 10%
Children under 18 without health insurance coverage in 2000: 6%
Short term general hospital admissions per 100,000 population in 2004: 6,594
Short term general hospital beds per 100,000 population in 2004: 131
Emergency room visits per 100,000 population in 2004: 39,069
General practice office based MDs per 100,000 population in 2005: 1,279
Medical specialist MDs per 100,000 population in 2005: 776
Dentists per 100,000 population in 1998: 5
Total births per 100,000 population, July 2005 - July 2006 : 34
Total deaths per 100,000 population, July 2005 - July 2006: 64
Limited-service eating places per 100,000 population in 2005 : 10
Beer, wine & liquor stores per 100,000 population in 2005: 1
Homicides per 1,000,000 population from 2000 to 2006: 30.9. This is less than state average.
Suicides per 1,000,000 population from 2000 to 2006: 141.1. This is more than state average.
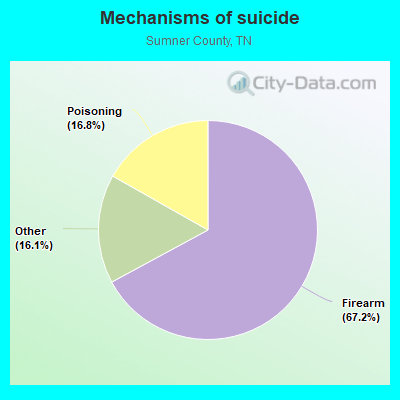
- Firearm - 94.7
- Poisoning - 23.7
- Other - 22.7
Household type by relationship:
Households: 203,858- Male householders: 36,712 (8,438 living alone), Female householders: 42,614 (10,295 living alone)
45,286 spouses (45,116 opposite-sex spouses), 5,280 unmarried partners, (4,924 opposite-sex unmarried partners), 56,344 children (52,308 natural, 1,439 adopted, 2,597 stepchildren), 3,930 grandchildren, 1,644 brothers or sisters, 3,250 parents, 273 foster children, 2,289 other relatives, 4,607 non-relatives
- In group quarters: 1,629
Size of family households: 22,879 2-persons, 12,572 3-persons, 12,274 4-persons, 6,237 5-persons, 1,112 6-persons, 209 7-or-more-persons.
Size of nonfamily households: 18,733 1-person, 4,597 2-persons, 664 3-persons, 49 7-or-more-persons.
33,800 married couples with children.
7,658 single-parent households (1,996 men, 5,662 women).
93.8% of residents of Sumner speak English at home.
3.7% of residents speak Spanish at home (62% speak English very well, 16% speak English well, 16% speak English not well, 6% don't speak English at all).
1.1% of residents speak other Indo-European language at home (80% speak English very well, 10% speak English well, 10% speak English not well).
0.8% of residents speak Asian or Pacific Island language at home (43% speak English very well, 22% speak English well, 34% speak English not well, 2% don't speak English at all).
0.4% of residents speak other language at home (46% speak English very well, 43% speak English well, 12% speak English not well).
In fiscal year 2004:
Federal Government expenditure: $634,623,000 ($4,481 per capita)
Department of Defense expenditure: $22,239,000
Federal direct payments to individuals for retirement and disability: $282,777,000
Federal other direct payments to individuals: $131,405,000
Federal direct payments not to individuals: $1,804,000
Federal grants: $86,991,000
Federal procurement contracts: $100,355,000 ($1,778,000 Department of Defense)
Federal salaries and wages: $31,291,000 ($2,970,000 Department of Defense)
Federal Government direct loans: $1,153,000
Federal guaranteed/insured loans: $161,224,000
Federal Government insurance: $40,036,000
Population change from April 1, 2000 to July 1, 2005:
Births: 9,601| Here: | 66 per 1000 residents |
| State: | 69 per 1000 residents |
Deaths: 5,795
| Here: | 40 per 1000 residents |
| State: | 50 per 1000 residents |
Net international migration: +903
| Here: | +6 per 1000 residents |
| State: | +8 per 1000 residents |
Net internal migration: +10,067
| Here: | +69 per 1000 residents |
| State: | +18 per 1000 residents |
Total withdrawal of fresh water for public supply: 24.60 millions of gallons per day (all from surface)
| Here: | 6.8 |
| State: | 6.5 |
| Here: | 4.5 |
| State: | 4.4 |
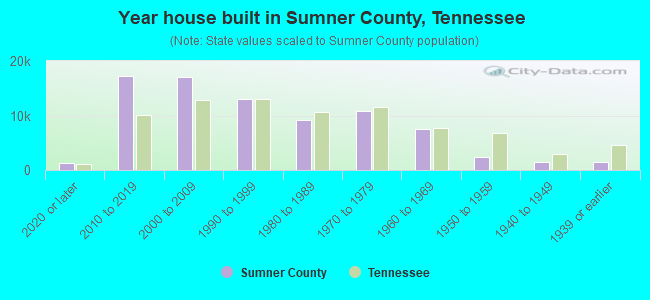
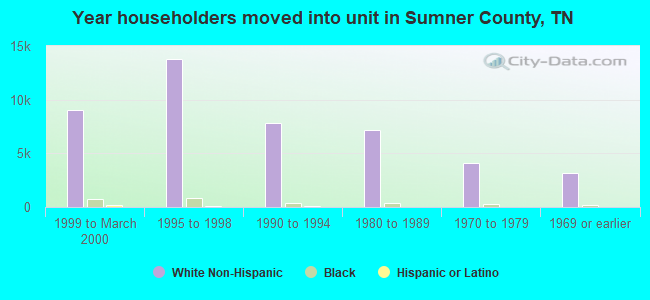
- Year house built in Sumner County, Tennessee
- 2,7182020 or later
- 19,2502010 to 2019
- 15,3432000 to 2009
- 14,0731990 to 1999
- 11,0361980 to 1989
- 9,4711970 to 1979
- 7,1391960 to 1969
- 2,5341950 to 1959
- 4591940 to 1949
- 1,3661939 or earlier

- Rooms in owner-occupied houses in Sumner County, Tennessee
- 1291 room
- 02 rooms
- 4073 rooms
- 1,7894 rooms
- 9,2705 rooms
- 14,9416 rooms
- 8,8247 rooms
- 9,2038 rooms
- 13,7569+ rooms
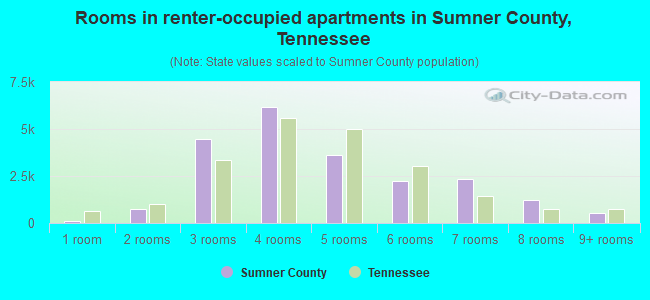
- Rooms in renter-occupied apartments in Sumner County, Tennessee
- 1,4661 room
- 8552 rooms
- 2,0223 rooms
- 6,4344 rooms
- 3,6465 rooms
- 3,5026 rooms
- 2,1947 rooms
- 6928 rooms
- 1969+ rooms
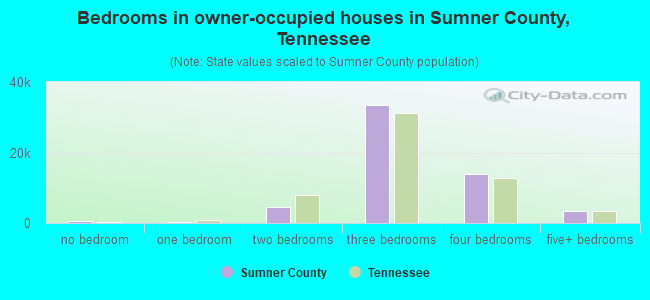
- Bedrooms in owner-occupied houses in Sumner County, Tennessee
- 129no bedroom
- 3981 bedroom
- 4,9902 bedrooms
- 35,2293 bedrooms
- 15,1624 bedrooms
- 2,4115+ bedrooms
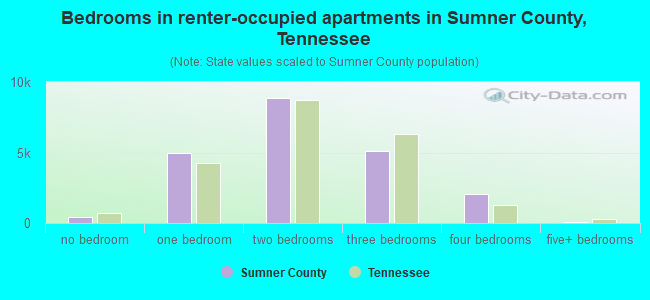
- Bedrooms in renter-occupied apartments in Sumner County, Tennessee
- 1,466no bedroom
- 3,2821 bedroom
- 8,5502 bedrooms
- 6,8643 bedrooms
- 8454 bedrooms
- 05+ bedrooms
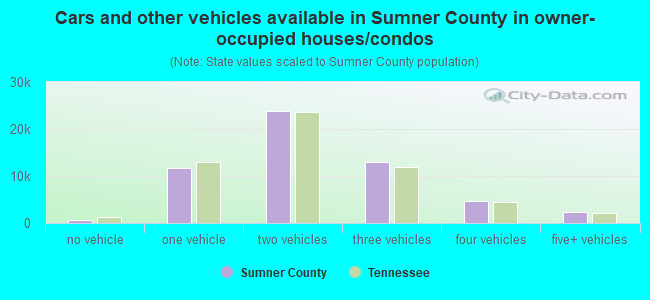
- Cars and other vehicles available in Sumner County in owner-occupied houses/condos
- 1,156no vehicle
- 10,6231 vehicle
- 24,9602 vehicles
- 14,8733 vehicles
- 4,0904 vehicles
- 2,6175+ vehicles
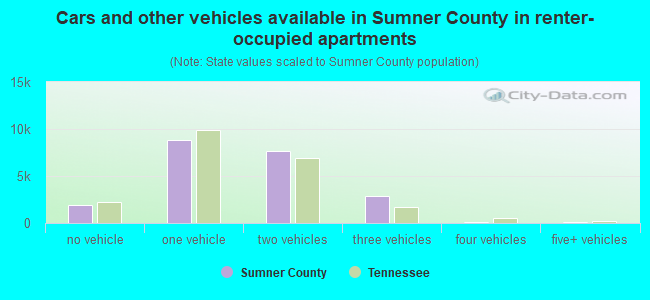
- Cars and other vehicles available in Sumner County in renter-occupied apartments
- 1,056no vehicle
- 9,5971 vehicle
- 6,9122 vehicles
- 3,0243 vehicles
- 3584 vehicles
- 605+ vehicles
87.6% of Sumner County residents lived in the same house 1 years ago.
Out of people who lived in different houses, 32% lived in this county.
Out of people who lived in different counties, 56% lived in Tennessee.
| Sumner County: | 87.6% |
| State average: | 87.0% |
Place of birth for U.S.-born residents:
- This state: 104,688
- Other state: 89,278
- Northeast: 12,611
- Midwest: 30,703
- South: 36,235
- West: 9,729
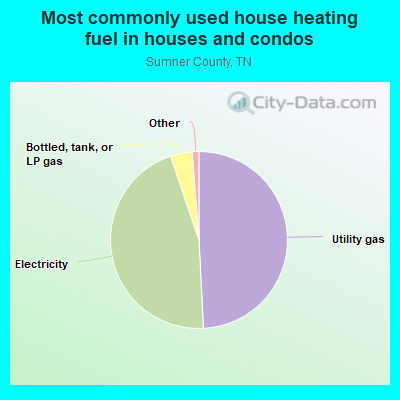
- 49.4%Utility gas
- 45.6%Electricity
- 3.7%Bottled, tank, or LP gas
- 0.6%Wood
- 0.3%No fuel used
- 0.2%Fuel oil, kerosene, etc.
- 0.1%Other fuel
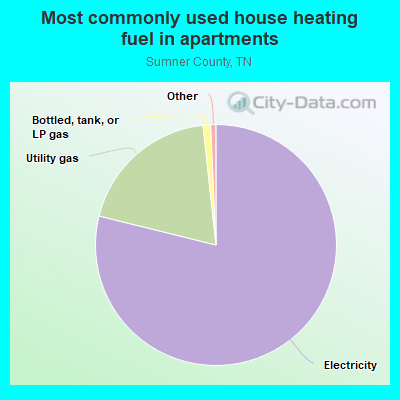
- 80.1%Electricity
- 18.0%Utility gas
- 1.1%Bottled, tank, or LP gas
- 0.7%No fuel used
- 0.2%Wood
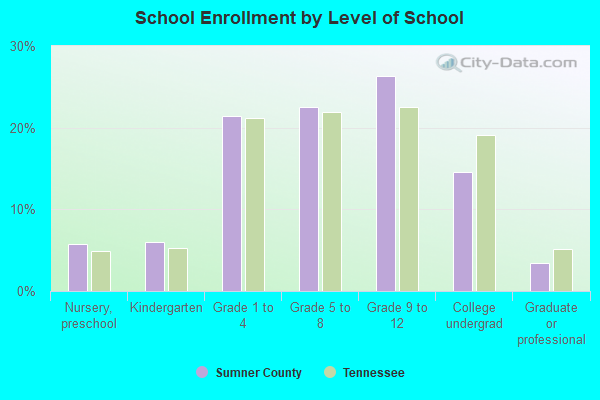
Private vs. public school enrollment:
| Here: | 15.1% |
| Tennessee: | 15.0% |
| Here: | 17.7% |
| Tennessee: | 16.2% |
| Here: | 28.6% |
| Tennessee: | 23.5% |


Sumner County government finances - Expenditure in 2020:
- Bond Funds - Cash and Securities: $120,605,000
Cash and Securities: $23,944,000
- Charges - Elementary and Secondary Education - Other: $22,925,000
Elementary and Secondary Education - Other: $20,504,000
Other: $19,509,000
Other: $17,843,000
Elementary and Secondary Education School Lunch: $4,618,000
Elementary and Secondary Education School Lunch: $4,202,000
Natural Resources - Other: $44,000
Elementary and Secondary Education School Tuition and Transportation: $14,000
Solid Waste Management: $8,000
Elementary and Secondary Education School Tuition and Transportation: $5,000
- Construction - General - Other: $11,680,000
Police Protection: $7,606,000
Health - Other: $849,000
General - Other: $843,000
Elementary and Secondary Education: $790,000
Police Protection: $686,000
Parks and Recreation: $607,000
Elementary and Secondary Education: $256,000
Judicial and Legal Services: $136,000
General Public Buildings: $18,000
Regular Highways: $10,000
Correctional Institutions: $1,000
- Current Operations - Elementary and Secondary Education: $287,663,000
Elementary and Secondary Education: $263,075,000
Regular Highways: $73,139,000
Police Protection: $12,363,000
Correctional Institutions: $11,934,000
Health - Other: $11,800,000
Correctional Institutions: $11,334,000
Police Protection: $10,866,000
Health - Other: $10,617,000
General - Other: $7,789,000
Regular Highways: $7,521,000
General - Other: $6,708,000
Judicial and Legal Services: $5,826,000
Judicial and Legal Services: $5,714,000
Financial Administration: $4,842,000
Financial Administration: $4,260,000
Central Staff Services: $3,617,000
General Public Buildings: $3,288,000
General Public Buildings: $2,329,000
Libraries: $2,310,000
Libraries: $2,167,000
Central Staff Services: $1,799,000
Parks and Recreation: $560,000
Natural Resources - Other: $523,000
Public Welfare - Other: $516,000
Natural Resources - Other: $479,000
Local Fire Protection: $440,000
Corrections - Other: $438,000
Corrections - Other: $432,000
Local Fire Protection: $182,000
Solid Waste Management: $72,000
Public Welfare, Vendor Payments for Other Purposes: $6,000
- Federal Intergovernmental - Education: $257,000
Education: $201,000
Other: $164,000
General Local Government Support: $52,000
Other: $15,000
- General - Interest on Debt: $10,304,000
Interest on Debt: $6,485,000
- Intergovernmental to Local - Other - General - Other: $28,590,000
Other - General - Other: $250,000
Other - Elementary and Secondary Education: $2,000
Other - Local Fire Protection: $2,000
Other - Elementary and Secondary Education: $1,000
- Intergovernmental to State - General - Other: $213,000
Health - Other: $213,000
- Local Intergovernmental - General Local Government Support: $1,218,000
Other: $905,000
Education: $607,000
Education: $491,000
Highways: $264,000
Other: $173,000
- Long Term Debt - Beginning Outstanding - Unspecified Public Purpose: $223,650,000
Outstanding Unspecified Public Purpose: $205,925,000
Beginning Outstanding - Unspecified Public Purpose: $158,010,000
Outstanding Unspecified Public Purpose: $143,460,000
Retired Unspecified Public Purpose: $17,725,000
Retired Unspecified Public Purpose: $14,550,000
- Miscellaneous - Interest Earnings: $3,628,000
Special Assessments: $2,975,000
General Revenue - Other: $2,536,000
General Revenue - Other: $2,158,000
Interest Earnings: $1,696,000
Fines and Forfeits: $1,250,000
Donations From Private Sources: $1,022,000
Donations From Private Sources: $823,000
Fines and Forfeits: $576,000
Sale of Property: $205,000
Sale of Property: $189,000
Rents: $184,000
Rents: $180,000
- Other Capital Outlay - Elementary and Secondary Education: $5,762,000
Elementary and Secondary Education: $4,445,000
Judicial and Legal Services: $3,711,000
General - Other: $3,001,000
General - Other: $2,110,000
Police Protection: $958,000
Regular Highways: $575,000
Regular Highways: $466,000
Financial Administration: $206,000
Judicial and Legal Services: $58,000
Financial Administration: $51,000
Health - Other: $39,000
Libraries: $39,000
Correctional Institutions: $13,000
General Public Building: $11,000
Central Staff Services: $6,000
Parks and Recreation: $6,000
Natural Resources - Other: $2,000
Corrections - Other: $1,000
- Other Funds - Cash and Securities: $59,569,000
Cash and Securities: $34,881,000
- Sinking Funds - Cash and Securities: $22,394,000
Cash and Securities: $20,389,000
- State Intergovernmental - Education: $174,949,000
Education: $162,895,000
Other: $8,220,000
Other: $6,150,000
Highways: $4,092,000
General Local Government Support: $3,914,000
General Local Government Support: $3,001,000
Health and Hospitals: $1,363,000
Health and Hospitals: $1,263,000
Highways: $839,000
Housing and Community Development: $114,000
Housing and Community Development: $15,000
- Tax - Property: $107,174,000
Property: $89,102,000
General Sales and Gross Receipts: $40,044,000
General Sales and Gross Receipts: $12,780,000
Other Selective Sales: $4,394,000
Other Selective Sales: $3,040,000
Occupation and Business License - Other: $2,247,000
Motor Vehicle License: $2,139,000
Other License: $640,000
Public Utilities Sales: $616,000
Public Utilities Sales: $532,000
Other License: $527,000
Alcoholic Beverage Sales: $497,000
Alcoholic Beverage Sales: $459,000
Severance: $227,000
Severance: $210,000
Amusements Sales: $2,000
Alcoholic Beverage License: $1,000
Amusements Sales: $1,000
Alcoholic Beverage License: $1,000
- Total Salaries and Wages: $164,185,000
: $147,955,000
Sumner County government finances - Revenue in 2020:
- Bond Funds - Cash and Securities: $120,605,000
Cash and Securities: $23,944,000
- Charges - Elementary and Secondary Education - Other: $22,925,000
Elementary and Secondary Education - Other: $20,504,000
Other: $19,509,000
Other: $17,843,000
Elementary and Secondary Education School Lunch: $4,618,000
Elementary and Secondary Education School Lunch: $4,202,000
Natural Resources - Other: $44,000
Elementary and Secondary Education School Tuition and Transportation: $14,000
Solid Waste Management: $8,000
Elementary and Secondary Education School Tuition and Transportation: $5,000
- Construction - General - Other: $11,680,000
Police Protection: $7,606,000
Health - Other: $849,000
General - Other: $843,000
Elementary and Secondary Education: $790,000
Police Protection: $686,000
Parks and Recreation: $607,000
Elementary and Secondary Education: $256,000
Judicial and Legal Services: $136,000
General Public Buildings: $18,000
Regular Highways: $10,000
Correctional Institutions: $1,000
- Current Operations - Elementary and Secondary Education: $287,663,000
Elementary and Secondary Education: $263,075,000
Regular Highways: $73,139,000
Police Protection: $12,363,000
Correctional Institutions: $11,934,000
Health - Other: $11,800,000
Correctional Institutions: $11,334,000
Police Protection: $10,866,000
Health - Other: $10,617,000
General - Other: $7,789,000
Regular Highways: $7,521,000
General - Other: $6,708,000
Judicial and Legal Services: $5,826,000
Judicial and Legal Services: $5,714,000
Financial Administration: $4,842,000
Financial Administration: $4,260,000
Central Staff Services: $3,617,000
General Public Buildings: $3,288,000
General Public Buildings: $2,329,000
Libraries: $2,310,000
Libraries: $2,167,000
Central Staff Services: $1,799,000
Parks and Recreation: $560,000
Natural Resources - Other: $523,000
Public Welfare - Other: $516,000
Natural Resources - Other: $479,000
Local Fire Protection: $440,000
Corrections - Other: $438,000
Corrections - Other: $432,000
Local Fire Protection: $182,000
Solid Waste Management: $72,000
Public Welfare, Vendor Payments for Other Purposes: $6,000
- Federal Intergovernmental - Education: $257,000
Education: $201,000
Other: $164,000
General Local Government Support: $52,000
Other: $15,000
- General - Interest on Debt: $10,304,000
Interest on Debt: $6,485,000
- Intergovernmental to Local - Other - General - Other: $28,590,000
Other - General - Other: $250,000
Other - Elementary and Secondary Education: $2,000
Other - Local Fire Protection: $2,000
Other - Elementary and Secondary Education: $1,000
- Intergovernmental to State - General - Other: $213,000
Health - Other: $213,000
- Local Intergovernmental - General Local Government Support: $1,218,000
Other: $905,000
Education: $607,000
Education: $491,000
Highways: $264,000
Other: $173,000
- Long Term Debt - Beginning Outstanding - Unspecified Public Purpose: $223,650,000
Outstanding Unspecified Public Purpose: $205,925,000
Beginning Outstanding - Unspecified Public Purpose: $158,010,000
Outstanding Unspecified Public Purpose: $143,460,000
Retired Unspecified Public Purpose: $17,725,000
Retired Unspecified Public Purpose: $14,550,000
- Miscellaneous - Interest Earnings: $3,628,000
Special Assessments: $2,975,000
General Revenue - Other: $2,536,000
General Revenue - Other: $2,158,000
Interest Earnings: $1,696,000
Fines and Forfeits: $1,250,000
Donations From Private Sources: $1,022,000
Donations From Private Sources: $823,000
Fines and Forfeits: $576,000
Sale of Property: $205,000
Sale of Property: $189,000
Rents: $184,000
Rents: $180,000
- Other Capital Outlay - Elementary and Secondary Education: $5,762,000
Elementary and Secondary Education: $4,445,000
Judicial and Legal Services: $3,711,000
General - Other: $3,001,000
General - Other: $2,110,000
Police Protection: $958,000
Regular Highways: $575,000
Regular Highways: $466,000
Financial Administration: $206,000
Judicial and Legal Services: $58,000
Financial Administration: $51,000
Health - Other: $39,000
Libraries: $39,000
Correctional Institutions: $13,000
General Public Building: $11,000
Central Staff Services: $6,000
Parks and Recreation: $6,000
Natural Resources - Other: $2,000
Corrections - Other: $1,000
- Other Funds - Cash and Securities: $59,569,000
Cash and Securities: $34,881,000
- Sinking Funds - Cash and Securities: $22,394,000
Cash and Securities: $20,389,000
- State Intergovernmental - Education: $174,949,000
Education: $162,895,000
Other: $8,220,000
Other: $6,150,000
Highways: $4,092,000
General Local Government Support: $3,914,000
General Local Government Support: $3,001,000
Health and Hospitals: $1,363,000
Health and Hospitals: $1,263,000
Highways: $839,000
Housing and Community Development: $114,000
Housing and Community Development: $15,000
- Tax - Property: $107,174,000
Property: $89,102,000
General Sales and Gross Receipts: $40,044,000
General Sales and Gross Receipts: $12,780,000
Other Selective Sales: $4,394,000
Other Selective Sales: $3,040,000
Occupation and Business License - Other: $2,247,000
Motor Vehicle License: $2,139,000
Other License: $640,000
Public Utilities Sales: $616,000
Public Utilities Sales: $532,000
Other License: $527,000
Alcoholic Beverage Sales: $497,000
Alcoholic Beverage Sales: $459,000
Severance: $227,000
Severance: $210,000
Amusements Sales: $2,000
Alcoholic Beverage License: $1,000
Amusements Sales: $1,000
Alcoholic Beverage License: $1,000
- Total Salaries and Wages: $164,185,000
: $147,955,000
Sumner County government finances - Debt in 2020:
- Bond Funds - Cash and Securities: $120,605,000
Cash and Securities: $23,944,000
- Charges - Elementary and Secondary Education - Other: $22,925,000
Elementary and Secondary Education - Other: $20,504,000
Other: $19,509,000
Other: $17,843,000
Elementary and Secondary Education School Lunch: $4,618,000
Elementary and Secondary Education School Lunch: $4,202,000
Natural Resources - Other: $44,000
Elementary and Secondary Education School Tuition and Transportation: $14,000
Solid Waste Management: $8,000
Elementary and Secondary Education School Tuition and Transportation: $5,000
- Construction - General - Other: $11,680,000
Police Protection: $7,606,000
Health - Other: $849,000
General - Other: $843,000
Elementary and Secondary Education: $790,000
Police Protection: $686,000
Parks and Recreation: $607,000
Elementary and Secondary Education: $256,000
Judicial and Legal Services: $136,000
General Public Buildings: $18,000
Regular Highways: $10,000
Correctional Institutions: $1,000
- Current Operations - Elementary and Secondary Education: $287,663,000
Elementary and Secondary Education: $263,075,000
Regular Highways: $73,139,000
Police Protection: $12,363,000
Correctional Institutions: $11,934,000
Health - Other: $11,800,000
Correctional Institutions: $11,334,000
Police Protection: $10,866,000
Health - Other: $10,617,000
General - Other: $7,789,000
Regular Highways: $7,521,000
General - Other: $6,708,000
Judicial and Legal Services: $5,826,000
Judicial and Legal Services: $5,714,000
Financial Administration: $4,842,000
Financial Administration: $4,260,000
Central Staff Services: $3,617,000
General Public Buildings: $3,288,000
General Public Buildings: $2,329,000
Libraries: $2,310,000
Libraries: $2,167,000
Central Staff Services: $1,799,000
Parks and Recreation: $560,000
Natural Resources - Other: $523,000
Public Welfare - Other: $516,000
Natural Resources - Other: $479,000
Local Fire Protection: $440,000
Corrections - Other: $438,000
Corrections - Other: $432,000
Local Fire Protection: $182,000
Solid Waste Management: $72,000
Public Welfare, Vendor Payments for Other Purposes: $6,000
- Federal Intergovernmental - Education: $257,000
Education: $201,000
Other: $164,000
General Local Government Support: $52,000
Other: $15,000
- General - Interest on Debt: $10,304,000
Interest on Debt: $6,485,000
- Intergovernmental to Local - Other - General - Other: $28,590,000
Other - General - Other: $250,000
Other - Elementary and Secondary Education: $2,000
Other - Local Fire Protection: $2,000
Other - Elementary and Secondary Education: $1,000
- Intergovernmental to State - General - Other: $213,000
Health - Other: $213,000
- Local Intergovernmental - General Local Government Support: $1,218,000
Other: $905,000
Education: $607,000
Education: $491,000
Highways: $264,000
Other: $173,000
- Long Term Debt - Beginning Outstanding - Unspecified Public Purpose: $223,650,000
Outstanding Unspecified Public Purpose: $205,925,000
Beginning Outstanding - Unspecified Public Purpose: $158,010,000
Outstanding Unspecified Public Purpose: $143,460,000
Retired Unspecified Public Purpose: $17,725,000
Retired Unspecified Public Purpose: $14,550,000
- Miscellaneous - Interest Earnings: $3,628,000
Special Assessments: $2,975,000
General Revenue - Other: $2,536,000
General Revenue - Other: $2,158,000
Interest Earnings: $1,696,000
Fines and Forfeits: $1,250,000
Donations From Private Sources: $1,022,000
Donations From Private Sources: $823,000
Fines and Forfeits: $576,000
Sale of Property: $205,000
Sale of Property: $189,000
Rents: $184,000
Rents: $180,000
- Other Capital Outlay - Elementary and Secondary Education: $5,762,000
Elementary and Secondary Education: $4,445,000
Judicial and Legal Services: $3,711,000
General - Other: $3,001,000
General - Other: $2,110,000
Police Protection: $958,000
Regular Highways: $575,000
Regular Highways: $466,000
Financial Administration: $206,000
Judicial and Legal Services: $58,000
Financial Administration: $51,000
Health - Other: $39,000
Libraries: $39,000
Correctional Institutions: $13,000
General Public Building: $11,000
Central Staff Services: $6,000
Parks and Recreation: $6,000
Natural Resources - Other: $2,000
Corrections - Other: $1,000
- Other Funds - Cash and Securities: $59,569,000
Cash and Securities: $34,881,000
- Sinking Funds - Cash and Securities: $22,394,000
Cash and Securities: $20,389,000
- State Intergovernmental - Education: $174,949,000
Education: $162,895,000
Other: $8,220,000
Other: $6,150,000
Highways: $4,092,000
General Local Government Support: $3,914,000
General Local Government Support: $3,001,000
Health and Hospitals: $1,363,000
Health and Hospitals: $1,263,000
Highways: $839,000
Housing and Community Development: $114,000
Housing and Community Development: $15,000
- Tax - Property: $107,174,000
Property: $89,102,000
General Sales and Gross Receipts: $40,044,000
General Sales and Gross Receipts: $12,780,000
Other Selective Sales: $4,394,000
Other Selective Sales: $3,040,000
Occupation and Business License - Other: $2,247,000
Motor Vehicle License: $2,139,000
Other License: $640,000
Public Utilities Sales: $616,000
Public Utilities Sales: $532,000
Other License: $527,000
Alcoholic Beverage Sales: $497,000
Alcoholic Beverage Sales: $459,000
Severance: $227,000
Severance: $210,000
Amusements Sales: $2,000
Alcoholic Beverage License: $1,000
Amusements Sales: $1,000
Alcoholic Beverage License: $1,000
- Total Salaries and Wages: $164,185,000
: $147,955,000
Sumner County government finances - Cash and Securities in 2020:
- Bond Funds - Cash and Securities: $120,605,000
Cash and Securities: $23,944,000
- Charges - Elementary and Secondary Education - Other: $22,925,000
Elementary and Secondary Education - Other: $20,504,000
Other: $19,509,000
Other: $17,843,000
Elementary and Secondary Education School Lunch: $4,618,000
Elementary and Secondary Education School Lunch: $4,202,000
Natural Resources - Other: $44,000
Elementary and Secondary Education School Tuition and Transportation: $14,000
Solid Waste Management: $8,000
Elementary and Secondary Education School Tuition and Transportation: $5,000
- Construction - General - Other: $11,680,000
Police Protection: $7,606,000
Health - Other: $849,000
General - Other: $843,000
Elementary and Secondary Education: $790,000
Police Protection: $686,000
Parks and Recreation: $607,000
Elementary and Secondary Education: $256,000
Judicial and Legal Services: $136,000
General Public Buildings: $18,000
Regular Highways: $10,000
Correctional Institutions: $1,000
- Current Operations - Elementary and Secondary Education: $287,663,000
Elementary and Secondary Education: $263,075,000
Regular Highways: $73,139,000
Police Protection: $12,363,000
Correctional Institutions: $11,934,000
Health - Other: $11,800,000
Correctional Institutions: $11,334,000
Police Protection: $10,866,000
Health - Other: $10,617,000
General - Other: $7,789,000
Regular Highways: $7,521,000
General - Other: $6,708,000
Judicial and Legal Services: $5,826,000
Judicial and Legal Services: $5,714,000
Financial Administration: $4,842,000
Financial Administration: $4,260,000
Central Staff Services: $3,617,000
General Public Buildings: $3,288,000
General Public Buildings: $2,329,000
Libraries: $2,310,000
Libraries: $2,167,000
Central Staff Services: $1,799,000
Parks and Recreation: $560,000
Natural Resources - Other: $523,000
Public Welfare - Other: $516,000
Natural Resources - Other: $479,000
Local Fire Protection: $440,000
Corrections - Other: $438,000
Corrections - Other: $432,000
Local Fire Protection: $182,000
Solid Waste Management: $72,000
Public Welfare, Vendor Payments for Other Purposes: $6,000
- Federal Intergovernmental - Education: $257,000
Education: $201,000
Other: $164,000
General Local Government Support: $52,000
Other: $15,000
- General - Interest on Debt: $10,304,000
Interest on Debt: $6,485,000
- Intergovernmental to Local - Other - General - Other: $28,590,000
Other - General - Other: $250,000
Other - Elementary and Secondary Education: $2,000
Other - Local Fire Protection: $2,000
Other - Elementary and Secondary Education: $1,000
- Intergovernmental to State - General - Other: $213,000
Health - Other: $213,000
- Local Intergovernmental - General Local Government Support: $1,218,000
Other: $905,000
Education: $607,000
Education: $491,000
Highways: $264,000
Other: $173,000
- Long Term Debt - Beginning Outstanding - Unspecified Public Purpose: $223,650,000
Outstanding Unspecified Public Purpose: $205,925,000
Beginning Outstanding - Unspecified Public Purpose: $158,010,000
Outstanding Unspecified Public Purpose: $143,460,000
Retired Unspecified Public Purpose: $17,725,000
Retired Unspecified Public Purpose: $14,550,000
- Miscellaneous - Interest Earnings: $3,628,000
Special Assessments: $2,975,000
General Revenue - Other: $2,536,000
General Revenue - Other: $2,158,000
Interest Earnings: $1,696,000
Fines and Forfeits: $1,250,000
Donations From Private Sources: $1,022,000
Donations From Private Sources: $823,000
Fines and Forfeits: $576,000
Sale of Property: $205,000
Sale of Property: $189,000
Rents: $184,000
Rents: $180,000
- Other Capital Outlay - Elementary and Secondary Education: $5,762,000
Elementary and Secondary Education: $4,445,000
Judicial and Legal Services: $3,711,000
General - Other: $3,001,000
General - Other: $2,110,000
Police Protection: $958,000
Regular Highways: $575,000
Regular Highways: $466,000
Financial Administration: $206,000
Judicial and Legal Services: $58,000
Financial Administration: $51,000
Health - Other: $39,000
Libraries: $39,000
Correctional Institutions: $13,000
General Public Building: $11,000
Central Staff Services: $6,000
Parks and Recreation: $6,000
Natural Resources - Other: $2,000
Corrections - Other: $1,000
- Other Funds - Cash and Securities: $59,569,000
Cash and Securities: $34,881,000
- Sinking Funds - Cash and Securities: $22,394,000
Cash and Securities: $20,389,000
- State Intergovernmental - Education: $174,949,000
Education: $162,895,000
Other: $8,220,000
Other: $6,150,000
Highways: $4,092,000
General Local Government Support: $3,914,000
General Local Government Support: $3,001,000
Health and Hospitals: $1,363,000
Health and Hospitals: $1,263,000
Highways: $839,000
Housing and Community Development: $114,000
Housing and Community Development: $15,000
- Tax - Property: $107,174,000
Property: $89,102,000
General Sales and Gross Receipts: $40,044,000
General Sales and Gross Receipts: $12,780,000
Other Selective Sales: $4,394,000
Other Selective Sales: $3,040,000
Occupation and Business License - Other: $2,247,000
Motor Vehicle License: $2,139,000
Other License: $640,000
Public Utilities Sales: $616,000
Public Utilities Sales: $532,000
Other License: $527,000
Alcoholic Beverage Sales: $497,000
Alcoholic Beverage Sales: $459,000
Severance: $227,000
Severance: $210,000
Amusements Sales: $2,000
Alcoholic Beverage License: $1,000
Amusements Sales: $1,000
Alcoholic Beverage License: $1,000
- Total Salaries and Wages: $164,185,000
: $147,955,000
Supplemental Security Income (SSI) in 2006:
- Total number of recipients: 2,329
- Number of aged recipients: 254
- Number of blind and disabled recipients: 2,075
- Number of recipients under 18: 377
- Number of recipients between 18 and 64: 1,475
- Number of recipients older than 64: 477
- Number of recipients also receiving OASDI: 976
- Amount of payments (thousands of dollars): 1,014
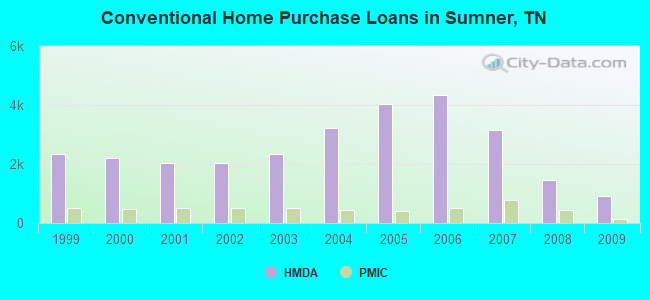
| Home Mortgage Disclosure Act Aggregated Statistics For Year 2009 (Based on 21 full tracts) | ||||||||||||||
| A) FHA, FSA/RHS & VA Home Purchase Loans | B) Conventional Home Purchase Loans | C) Refinancings | D) Home Improvement Loans | E) Loans on Dwellings For 5+ Families | F) Non-occupant Loans on < 5 Family Dwellings (A B C & D) | G) Loans On Manufactured Home Dwelling (A B C & D) | ||||||||
|---|---|---|---|---|---|---|---|---|---|---|---|---|---|---|
| Number | Average Value | Number | Average Value | Number | Average Value | Number | Average Value | Number | Average Value | Number | Average Value | Number | Average Value | |
| LOANS ORIGINATED | 1,133 | $168,967 | 931 | $189,698 | 4,450 | $174,033 | 200 | $44,555 | 3 | $616,667 | 425 | $126,551 | 184 | $52,957 |
| APPLICATIONS APPROVED, NOT ACCEPTED | 42 | $170,333 | 62 | $192,645 | 312 | $173,936 | 22 | $22,409 | 0 | $0 | 15 | $109,733 | 14 | $68,286 |
| APPLICATIONS DENIED | 104 | $162,125 | 104 | $147,087 | 1,242 | $180,561 | 173 | $42,526 | 2 | $288,500 | 58 | $147,052 | 53 | $71,509 |
| APPLICATIONS WITHDRAWN | 153 | $159,745 | 147 | $214,401 | 1,076 | $182,420 | 45 | $79,956 | 1 | $4,903,000 | 47 | $152,404 | 18 | $91,889 |
| FILES CLOSED FOR INCOMPLETENESS | 17 | $151,588 | 15 | $182,600 | 191 | $185,251 | 7 | $122,286 | 0 | $0 | 7 | $120,286 | 3 | $79,333 |
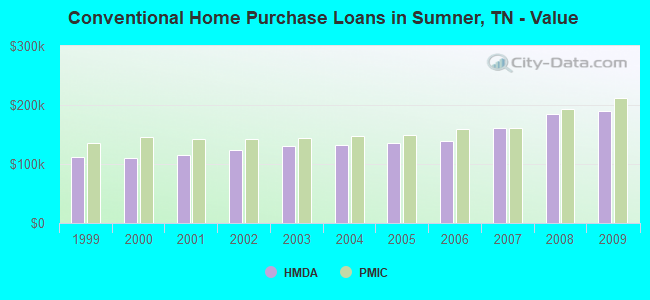
| Private Mortgage Insurance Companies Aggregated Statistics For Year 2009 (Based on 21 full tracts) | ||||||
| A) Conventional Home Purchase Loans | B) Refinancings | C) Non-occupant Loans on < 5 Family Dwellings (A & B) | ||||
|---|---|---|---|---|---|---|
| Number | Average Value | Number | Average Value | Number | Average Value | |
| LOANS ORIGINATED | 144 | $212,042 | 153 | $201,954 | 2 | $87,500 |
| APPLICATIONS APPROVED, NOT ACCEPTED | 34 | $237,676 | 49 | $199,163 | 0 | $0 |
| APPLICATIONS DENIED | 14 | $195,286 | 30 | $208,733 | 6 | $149,833 |
| APPLICATIONS WITHDRAWN | 9 | $201,556 | 12 | $194,667 | 1 | $108,000 |
| FILES CLOSED FOR INCOMPLETENESS | 4 | $291,750 | 6 | $197,167 | 0 | $0 |
| Most common first names in Sumner County, TN among deceased individuals | ||
| Name | Count | Lived (average) |
|---|---|---|
| James | 1,062 | 72.2 years |
| William | 829 | 73.6 years |
| Mary | 753 | 79.3 years |
| John | 664 | 74.7 years |
| Robert | 507 | 71.7 years |
| Charles | 440 | 70.9 years |
| Thomas | 287 | 72.9 years |
| George | 281 | 75.5 years |
| Willie | 273 | 76.6 years |
| Margaret | 239 | 77.8 years |
| Most common last names in Sumner County, TN among deceased individuals | ||
| Last name | Count | Lived (average) |
|---|---|---|
| Jones | 351 | 76.5 years |
| Brown | 343 | 76.6 years |
| Smith | 332 | 71.9 years |
| Johnson | 242 | 76.4 years |
| Williams | 233 | 73.0 years |
| Gregory | 179 | 72.7 years |
| Carter | 170 | 73.5 years |
| Taylor | 164 | 74.5 years |
| Martin | 144 | 75.5 years |
| Harris | 140 | 75.2 years |
| Businesses in Sumner County, TN | ||||
| Name | Count | Name | Count | |
|---|---|---|---|---|
| ALDI | 2 | Justice | 1 | |
| AT&T | 2 | KFC | 3 | |
| Abercrombie & Fitch | 1 | Kincaid | 2 | |
| Abercrombie Kids | 1 | Kmart | 2 | |
| Ace Hardware | 4 | Kohl's | 1 | |
| Advance Auto Parts | 4 | Kroger | 7 | |
| Aeropostale | 1 | La-Z-Boy | 1 | |
| American Eagle Outfitters | 1 | Lane Bryant | 1 | |
| Ann Taylor | 1 | Lane Furniture | 1 | |
| Arby's | 5 | LensCrafters | 1 | |
| AutoZone | 3 | Little Caesars Pizza | 3 | |
| Barnes & Noble | 1 | Lowe's | 2 | |
| Baskin-Robbins | 3 | Macy's | 1 | |
| Bath & Body Works | 2 | Marriott | 1 | |
| Baymont Inn | 1 | MasterBrand Cabinets | 3 | |
| Best Western | 1 | Maurices | 1 | |
| Blockbuster | 2 | McDonald's | 7 | |
| Buffalo Wild Wings | 2 | Motel 6 | 1 | |
| Burger King | 2 | Motherhood Maternity | 2 | |
| CVS | 3 | New Balance | 2 | |
| Cache | 1 | New York & Co | 2 | |
| Chick-Fil-A | 2 | Nike | 12 | |
| Chico's | 1 | Nissan | 1 | |
| Church's Chicken | 1 | Office Depot | 1 | |
| Coldwater Creek | 1 | Pac Sun | 1 | |
| ColorTyme | 1 | Papa John's Pizza | 2 | |
| Comfort Inn | 1 | Payless | 1 | |
| Comfort Suites | 2 | Penske | 1 | |
| Cracker Barrel | 3 | Pizza Hut | 4 | |
| Cricket Wireless | 7 | Publix Super Markets | 3 | |
| Curves | 3 | Qdoba Mexican Grill | 1 | |
| DHL | 1 | Quality | 1 | |
| Dairy Queen | 3 | Quiznos | 3 | |
| Days Inn | 1 | RadioShack | 2 | |
| Deb | 1 | Red Robin | 1 | |
| Decora Cabinetry | 2 | Red Roof Inn | 1 | |
| Discount Tire | 2 | Rite Aid | 4 | |
| Domino's Pizza | 4 | Rodeway Inn | 1 | |
| Dunkin Donuts | 2 | Rue21 | 1 | |
| Express | 1 | SONIC Drive-In | 7 | |
| FedEx | 20 | Sears | 4 | |
| Finish Line | 1 | Shoe Carnival | 1 | |
| Firestone Complete Auto Care | 2 | Spencer Gifts | 1 | |
| Foot Locker | 1 | Sprint Nextel | 4 | |
| Ford | 1 | Staples | 1 | |
| GNC | 3 | Starbucks | 4 | |
| GameStop | 3 | Steak 'n Shake | 1 | |
| Gap | 1 | Subway | 2 | |
| Goodwill | 2 | T-Mobile | 4 | |
| Gymboree | 2 | Taco Bell | 3 | |
| H&R Block | 7 | Talbots | 1 | |
| Hardee's | 3 | Target | 1 | |
| Hilton | 2 | Toyota | 1 | |
| Holiday Inn | 2 | U-Haul | 9 | |
| Hollister Co. | 1 | UPS | 20 | |
| Home Depot | 1 | Vans | 2 | |
| Hot Topic | 1 | Verizon Wireless | 2 | |
| Hyatt | 1 | Victoria's Secret | 2 | |
| Hyundai | 1 | Waffle House | 5 | |
| InTown Suites | 1 | Walgreens | 7 | |
| JCPenney | 1 | Walmart | 2 | |
| JoS. A. Bank | 1 | Wendy's | 5 | |
| Jones New York | 3 | Wet Seal | 1 | |
| Journeys | 1 | YMCA | 1 | |
Sumner County on our top lists:
- #77 on the list of "Top 101 counties with the largest number of people moving in compared to moving out (pop. 50,000+)"
- #83 on the list of "Top 101 counties with the lowest percentage of residents relocating from foreign countries between 2010 and 2011 (pop. 50,000+)"
- #91 on the list of "Top 101 counties with highest percentage of residents voting for Romney (Republican) in the 2012 Presidential Election (pop. 50,000+)"