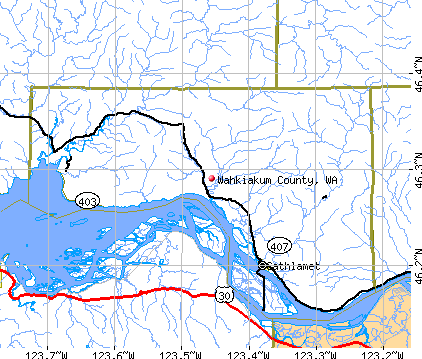
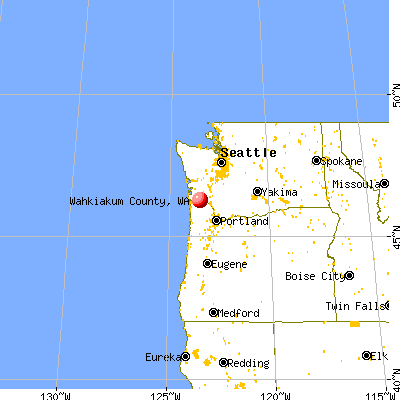
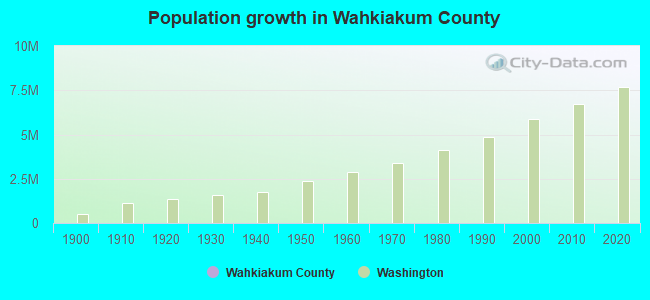
Wahkiakum County, Washington (WA)
County owner-occupied free and clear houses and condos in 2010: 645
County owner-occupied houses and condos in 2000: 1,237
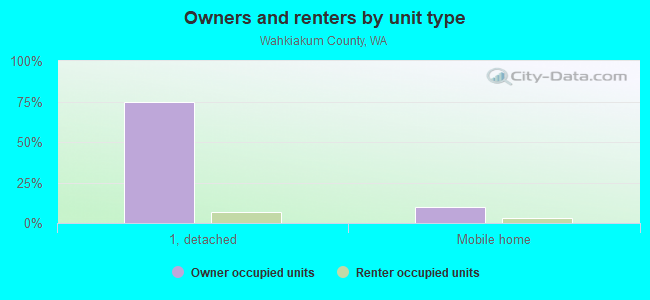
Renter-occupied apartments: 352 (it was 316 in 2000)
| % of renters here: | 20% |
| State: | 36% |
Land area: 264 sq. mi.
Water area: 22.4 sq. mi.
Population density: 17 people per square mile (low).
Industries providing employment: Educational, health and social services (21.6%), Retail trade (16.4%), Construction (14.6%).
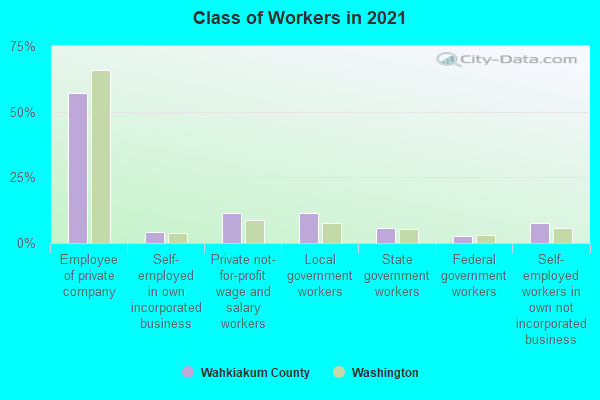
Type of workers:
- Private wage or salary: 72%
- Government: 22%
- Self-employed, not incorporated: 6%
- Unpaid family work: 0%
- OSM Map
- General Map
- Google Map
- MSN Map

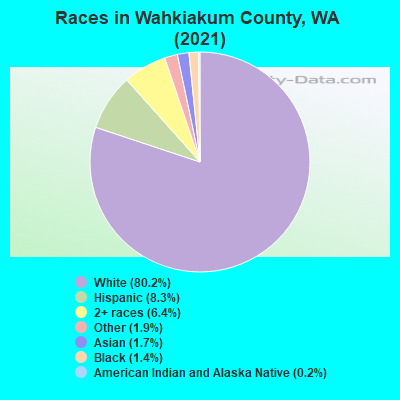
- 3,61980.7%White Non-Hispanic Alone
- 3467.7%Hispanic or Latino
- 2655.9%Two or more races
- 1192.7%Asian alone
- 751.7%Some other race alone
- 451.0%Black Non-Hispanic Alone
- 130.3%American Indian and Alaska Native alone
| Median resident age: | 56.9 years |
| Washington median age: | 38.4 years |
| Males: 2,306 | |
| Females: 2,226 |


| Wahkiakum County: | 2.0 people |
| Washington: | 3 people |
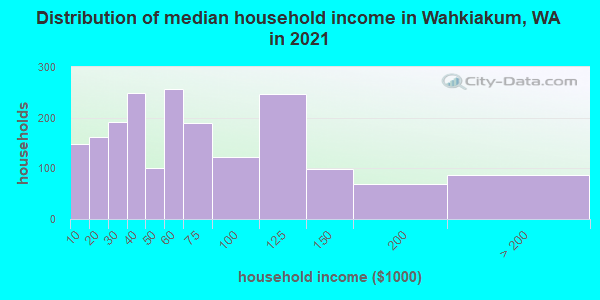
Estimated median household income in 2022: $59,809 ($39,444 in 1999)
| This county: | $59,809 |
| Washington: | $91,306 |
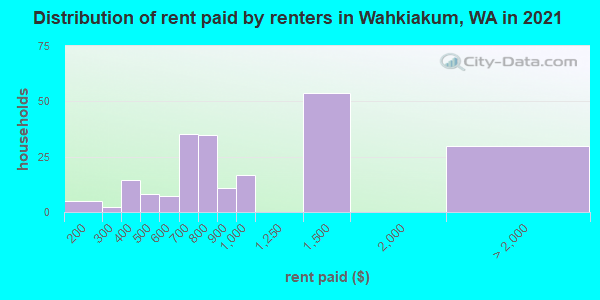
Median contract rent in 2022 for apartments: $965 (lower quartile is $808, upper quartile is $1,293)
| This county: | $965 |
| State: | $1495 |
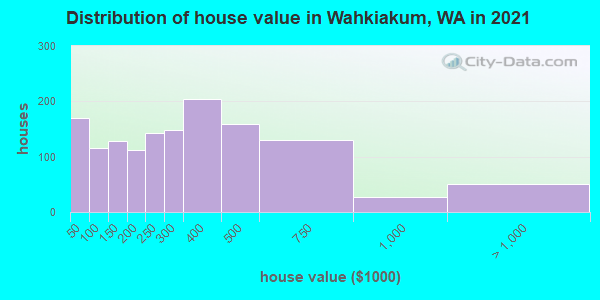
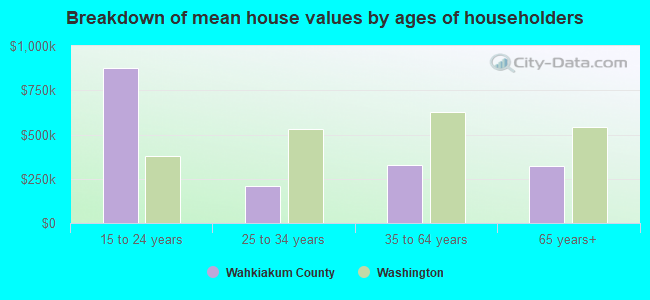
Estimated median house or condo value in 2022: $383,877 (it was $133,700 in 2000)
| Wahkiakum: | $383,877 |
| Washington: | $569,500 |
Median monthly housing costs for homes and condos with a mortgage: $1,610
Median monthly housing costs for units without a mortgage: $480
Institutionalized population: 38
Crime in 2021 (reported by the sheriff's office or county police, not the county total):
- Murders: 0
- Rapes: 5
- Robberies: 2
- Assaults: 2
- Burglaries: 12
- Thefts: 27
- Auto thefts: 3
Crime in 2020 (reported by the sheriff's office or county police, not the county total):
- Murders: 0
- Rapes: 1
- Robberies: 0
- Assaults: 5
- Burglaries: 7
- Thefts: 25
- Auto thefts: 2
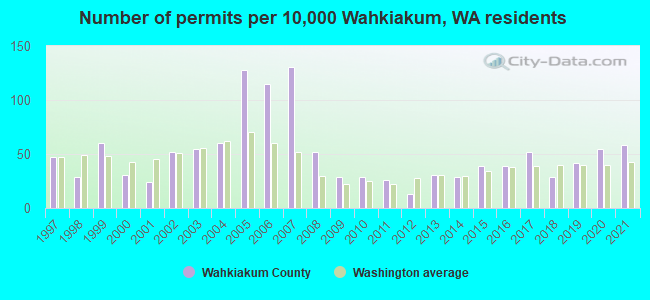
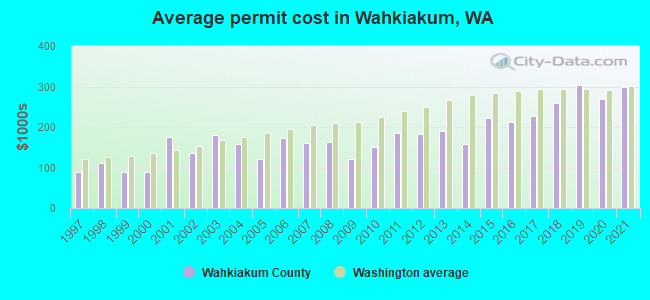
Single-family new house construction building permits:
- 2022: 40 buildings, average cost: $324,300
- 2021: 22 buildings, average cost: $298,500
- 2020: 21 buildings, average cost: $267,700
- 2019: 16 buildings, average cost: $303,100
- 2018: 11 buildings, average cost: $258,600
- 2017: 20 buildings, average cost: $227,100
- 2016: 15 buildings, average cost: $213,300
- 2015: 15 buildings, average cost: $220,800
- 2014: 11 buildings, average cost: $157,100
- 2013: 12 buildings, average cost: $190,600
- 2012: 5 buildings, average cost: $181,700
- 2011: 10 buildings, average cost: $184,800
- 2010: 11 buildings, average cost: $150,400
- 2009: 11 buildings, average cost: $120,700
- 2008: 20 buildings, average cost: $163,200
- 2007: 50 buildings, average cost: $159,500
- 2006: 44 buildings, average cost: $172,900
- 2005: 49 buildings, average cost: $119,600
- 2004: 23 buildings, average cost: $158,400
- 2003: 21 buildings, average cost: $180,900
- 2002: 20 buildings, average cost: $134,800
- 2001: 9 buildings, average cost: $174,800
- 2000: 12 buildings, average cost: $90,000
- 1999: 23 buildings, average cost: $88,700
- 1998: 11 buildings, average cost: $112,100
- 1997: 18 buildings, average cost: $88,900
Median real estate property taxes paid for housing units with mortgages in 2022: $2,095 (0.5%)
Median real estate property taxes paid for housing units with no mortgage in 2022: $2,021 (0.6%)
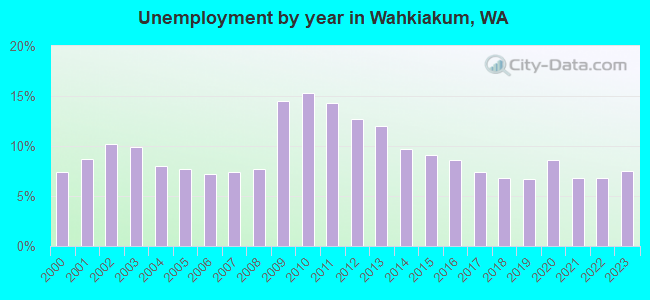
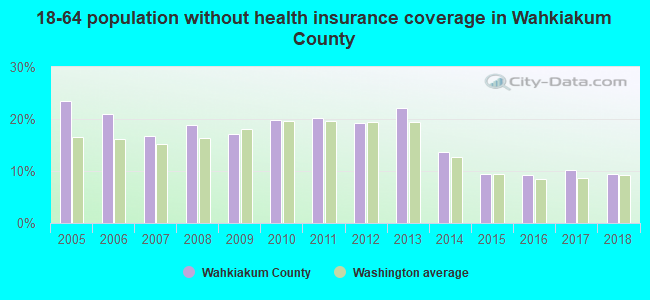
| Wahkiakum County: | 13.8% |
| Washington: | 10.0% |
Median age of residents in 2022: 56.9 years old
(Males: 54.8 years old, Females: 58.0 years old)
(Median age for: White residents: 58.0 years old, Black residents: 14.7 years old, American Indian residents: 73.2 years old, Asian residents: 54.4 years old, Hispanic or Latino residents: 42.5 years old, Other race residents: 61.5 years old)
Fair market rent in 2006 for a 1-bedroom apartment in Wahkiakum County is $504 a month.
Fair market rent for a 2-bedroom apartment is $589 a month.
Fair market rent for a 3-bedroom apartment is $858 a month.
Cities in this county include: Cathlamet-Elochoman, Grays River, Puget Island, Cathlamet, Skamokawa, East Cathlamet, Skamokawa Valley, Rosburg, Deep River, Upper Elochoman.
Neighboring counties: Benton County  , Granite County, Montana , Grant County, Minnesota , Mineral County, Montana , Washington County, Oregon
  , Todd County, Minnesota .
| Here: | 8.4% |
| Washington: | 4.6% |
Current college students: 127
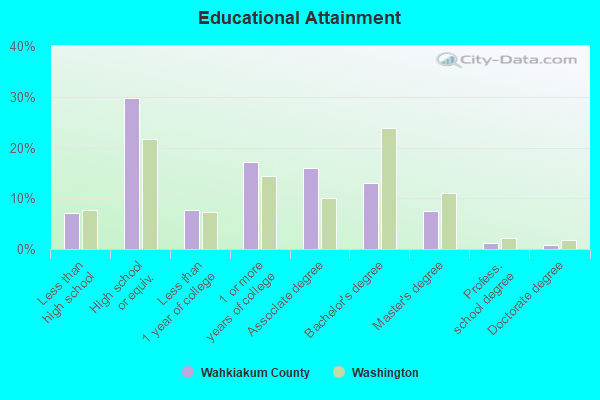
People 25 years of age or older with a high school degree or higher: 92.1%
People 25 years of age or older with a bachelor's degree or higher: 22.1%
Number of foreign born residents: 204 (47.8% naturalized citizens)
| Wahkiakum County: | 4.5% |
| Whole state: | 15.3% |
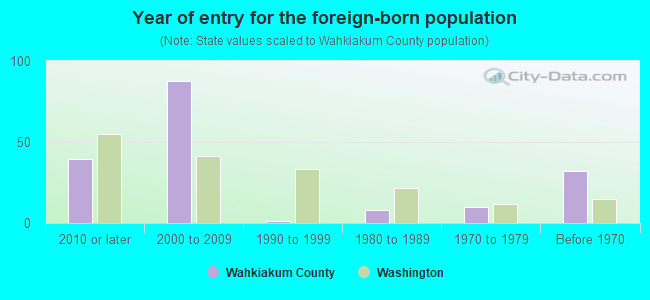
- Year of entry for the foreign-born population
- 242010 or later
- 752000 to 2009
- 11990 to 1999
- 81980 to 1989
- 101970 to 1979
- 32Before 1970
Mean travel time to work (commute): ' minutes
Percentage of county residents living and working in this county: 84.6%
Housing units in structures:
- One, detached: 1,822
- One, attached: 2
- Two: 33
- 3 or 4: 6
- 5 to 9: 5
- 10 to 19: 22
- Mobile homes: 268
- Boats, RVs, vans, etc.: 81
Housing units in Wahkiakum County with a mortgage: 559 (57 second mortgage, 9 home equity loan, 37 both second mortgage and home equity loan)
Houses without a mortgage: 16
| Here: | 97.2% with mortgage |
| State: | 98.0% with mortgage |
Religion statistics for Wahkiakum County
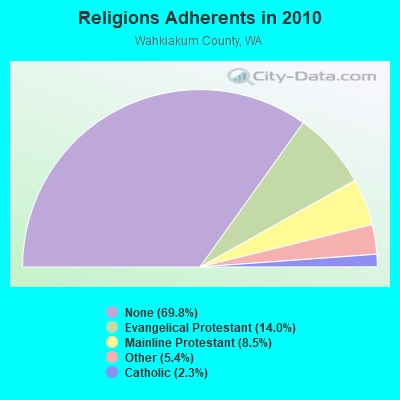
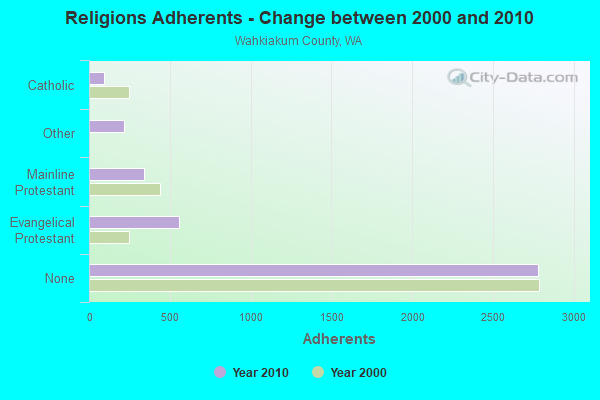
| Religion | Adherents | Congregations |
|---|---|---|
| Evangelical Protestant | 557 | 6 |
| Mainline Protestant | 340 | 5 |
| Other | 215 | 1 |
| Catholic | 90 | 1 |
| None | 2,776 | - |
Source: Clifford Grammich, Kirk Hadaway, Richard Houseal, Dale E.Jones, Alexei Krindatch, Richie Stanley and Richard H.Taylor. 2012. 2010 U.S.Religion Census: Religious Congregations & Membership Study. Association of Statisticians of American Religious Bodies. Jones, Dale E., et al. 2002. Congregations and Membership in the United States 2000. Nashville, TN: Glenmary Research Center.
Food Environment Statistics:
| Wahkiakum County: | 2.48 / 10,000 pop. |
| State: | 2.06 / 10,000 pop. |
| Wahkiakum County: | 7.43 / 10,000 pop. |
| Washington: | 2.67 / 10,000 pop. |
| This county: | 12.38 / 10,000 pop. |
| State: | 8.26 / 10,000 pop. |
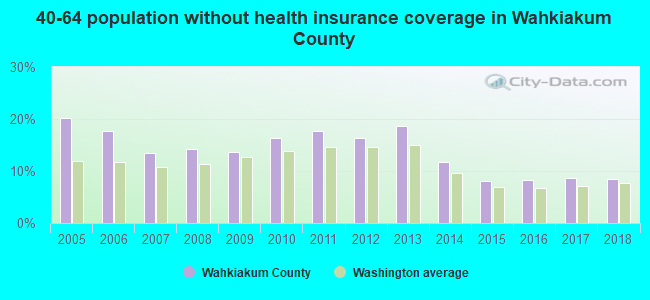
| Wahkiakum County: | 11.7% |
| Washington: | 7.7% |
| Wahkiakum County: | 28.1% |
| State: | 25.7% |
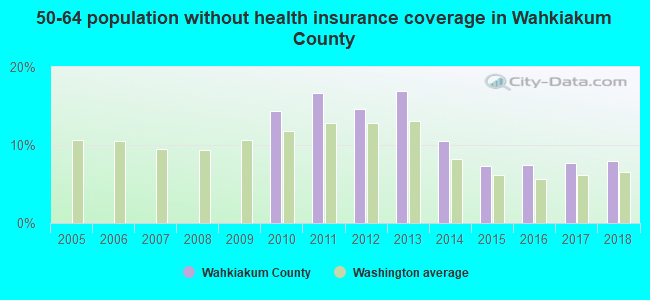
| Here: | 16.0% |
| State: | 13.9% |
Agriculture in Wahkiakum County:
Average size of farms: 99 acresAverage value of agricultural products sold per farm: $23,830
Average value of crops sold per acre for harvested cropland: $26.24
The value of livestock, poultry, and their products as a percentage of the total market value of agricultural products sold: 97.18%
Average total farm production expenses per farm: $19,264
Harvested cropland as a percentage of land in farms: 25.88%
Irrigated harvested cropland as a percentage of land in farms: 5.15%
Average market value of all machinery and equipment per farm: $29,422
The percentage of farms operated by a family or individual: 88.00%
Average age of principal farm operators: 58 years
Average number of cattle and calves per 100 acres of all land in farms: 28.54
Milk cows as a percentage of all cattle and calves: 13.72%
Land in orchards: 3 acres
Earthquake activity:
Wahkiakum County-area historical earthquake activity is significantly above Washington state average. It is 1372% greater than the overall U.S. average.On 4/13/1949 at 19:55:42, a magnitude 7.0 (7.0 UK, Class: Major, Intensity: VIII - XII) earthquake occurred 80.4 miles away from Wahkiakum County center, causing $80,000,000 total damage
On 2/28/2001 at 18:54:32, a magnitude 6.8 (6.8 MD, Depth: 32.2 mi, Class: Strong, Intensity: VII - IX) earthquake occurred 68.8 miles away from the county center
On 2/28/2001 at 18:54:32, a magnitude 6.8 (6.5 MB, 6.6 MS, 6.8 MW) earthquake occurred 69.2 miles away from the county center, causing $2,000,000,000 total damage and $305,000,000 insured losses
On 4/29/1965 at 15:28:43, a magnitude 6.6 (6.6 UK) earthquake occurred 88.8 miles away from the county center, causing $28,000,000 total damage
On 1/31/1922 at 13:17:28, a magnitude 7.6 (7.6 UK) earthquake occurred 400.6 miles away from Wahkiakum County center
On 8/17/1991 at 22:17:14, a magnitude 7.1 (6.2 MB, 7.1 MS, 7.1 MW, 6.8 ML, Depth: 8.4 mi) earthquake occurred 331.5 miles away from the county center
Magnitude types: body-wave magnitude (MB), duration magnitude (MD), local magnitude (ML), surface-wave magnitude (MS), moment magnitude (MW)
Most recent natural disasters:
- Washington Covid-19 Pandemic, Incident Period: January 20, 2020, Major Disaster (Presidential) Declared DR-4481-WA: March 22, 2020, FEMA Id: 4481, Natural disaster type: Other
- Washington Severe Storms, Flooding, Landslides, And Mudslides, Incident Period: January 20, 2020 - February 10, 2020, FEMA Id: 4539, Natural disaster type: Storm, Mudslide, Landslide, Flood
- Washington Severe Winter Storms, Flooding, Landslides, And Mudslides, Incident Period: January 30, 2017 - February 22, 2017, FEMA Id: 4309, Natural disaster type: Winter Storm, Mudslide, Landslide, Flood
- Washington Severe Winter Storm, Straight-Line Winds, Flooding, Landslides, Mudslides, and a Tornado, Incident Period: December 01, 2015 to December 14, 2015, Major Disaster (Presidential) Declared DR-4253: February 02, 2016, FEMA Id: 4253, Natural disaster type: Winter Storm, Tornado, Mudslide, Landslide, Flood, Wind
- Washington Severe Storms, Straight-line Winds, Flooding, Landslides, and Mudslides, Incident Period: November 12, 2015 to November 21, 2015, Major Disaster (Presidential) Declared DR-4249: January 15, 2016, FEMA Id: 4249, Natural disaster type: Storm, Mudslide, Landslide, Flood, Wind
- Washington Severe Winter Storm, Flooding, Landslides, and Mudslides, Incident Period: January 14, 2012 to January 23, 2012, Major Disaster (Presidential) Declared DR-4056: March 05, 2012, FEMA Id: 4056, Natural disaster type: Winter Storm, Mudslide, Landslide, Flood
- Washington Severe Winter Storm, Flooding, Landslides, and Mudslides, Incident Period: January 11, 2011 to January 21, 2011, Major Disaster (Presidential) Declared DR-1963: March 25, 2011, FEMA Id: 1963, Natural disaster type: Winter Storm, Mudslide, Landslide, Flood
- Washington Severe Winter Storm, Landslides, Mudslides, and Flooding, Incident Period: January 06, 2009 to January 16, 2009, Major Disaster (Presidential) Declared DR-1817: January 30, 2009, FEMA Id: 1817, Natural disaster type: Winter Storm, Mudslide, Landslide, Flood
- Washington Severe Winter Storm and Record and Near Record Snow, Incident Period: December 12, 2008 to January 05, 2009, Major Disaster (Presidential) Declared DR-1825: March 02, 2009, FEMA Id: 1825, Natural disaster type: Winter Storm, Snow
- Washington Severe Storms, Flooding, Landslides, and Mudslides, Incident Period: December 01, 2007 to December 17, 2007, Major Disaster (Presidential) Declared DR-1734: December 08, 2007, FEMA Id: 1734, Natural disaster type: Storm, Mudslide, Landslide, Flood
- 15 other natural disasters have been reported since 1953.
The number of natural disasters in Wahkiakum County (25) is a lot greater than the US average (15).
Major Disasters (Presidential) Declared: 22
Emergencies Declared: 1
Causes of natural disasters: Floods: 18, Storms: 13, Mudslides: 12, Landslides: 11, Winter Storms: 7, Winds: 4, Earthquake: 1, Heavy Rain: 1, Hurricane: 1, Snow: 1, Tornado: 1, Volcanic Eruption: 1, Other: 1 (Note: some incidents may be assigned to more than one category).
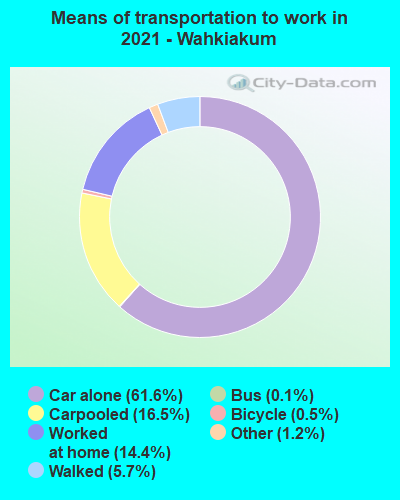
Means of transportation to work:
- Drove a car alone: 570 (57.6%)
- Carpooled: 91 (9.2%)
- Bus: 2 (0.2%)
- Taxicab, motorcycle, or other means: 58 (5.9%)
- Bicycle: 3 (0.3%)
- Walked: 52 (5.3%)
- Worked at home: 228 (23.1%)
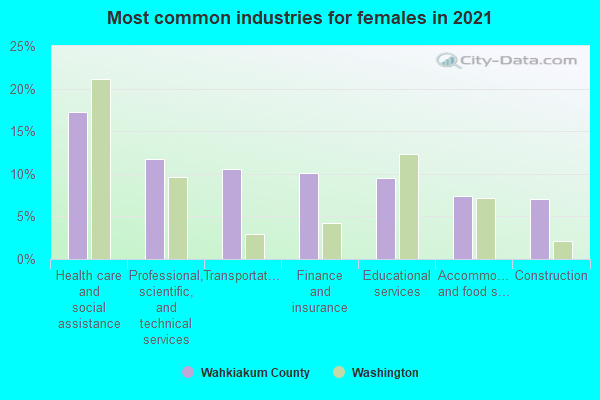
- Health care and social assistance (17%)
- Retail trade (9%)
- Educational services (9%)
- Transportation and warehousing (7%)
- Accommodation and food services (6%)
- Other services, except public administration (6%)
- Construction (5%)
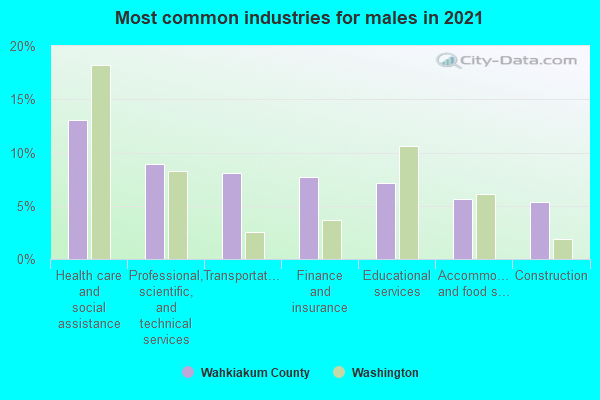
- Health care and social assistance (21%)
- Retail trade (11%)
- Educational services (11%)
- Transportation and warehousing (8%)
- Accommodation and food services (7%)
- Other services, except public administration (7%)
- Construction (6%)
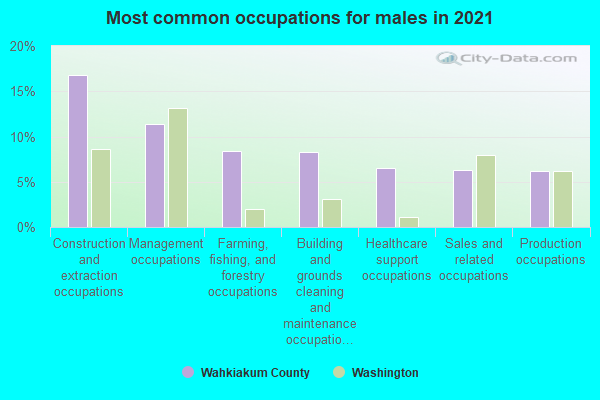
- Construction and extraction occupations (20%)
- Management occupations (14%)
- Sales and related occupations (10%)
- Building and grounds cleaning and maintenance occupations (8%)
- Farming, fishing, and forestry occupations (6%)
- Healthcare support occupations (5%)
- Material moving occupations (5%)
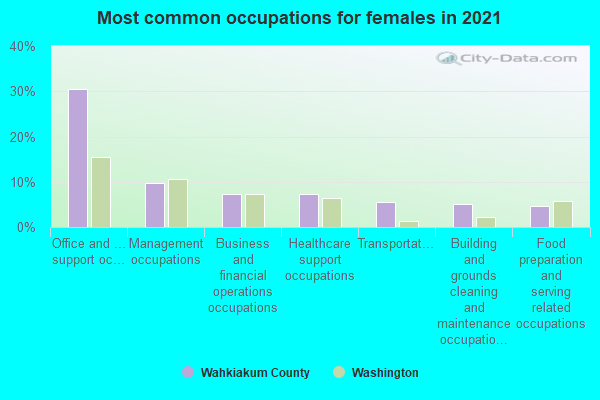
- Office and administrative support occupations (19%)
- Healthcare support occupations (16%)
- Management occupations (12%)
- Building and grounds cleaning and maintenance occupations (7%)
- Business and financial operations occupations (6%)
- Material moving occupations (6%)
- Food preparation and serving related occupations (5%)
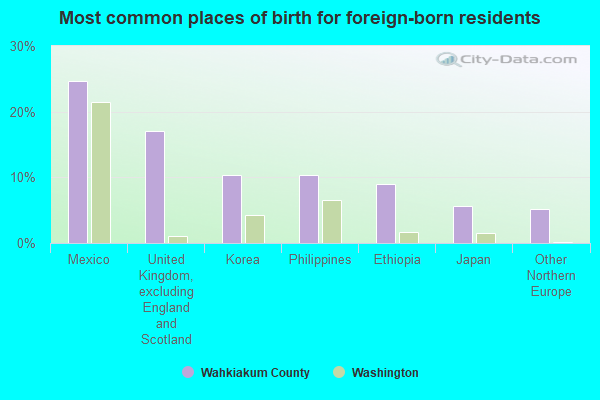
- Mexico (29%)
- United Kingdom, excluding England and Scotland (14%)
- Korea (12%)
- Netherlands (11%)
- Japan (7%)
- Ethiopia (7%)
- Philippines (5%)
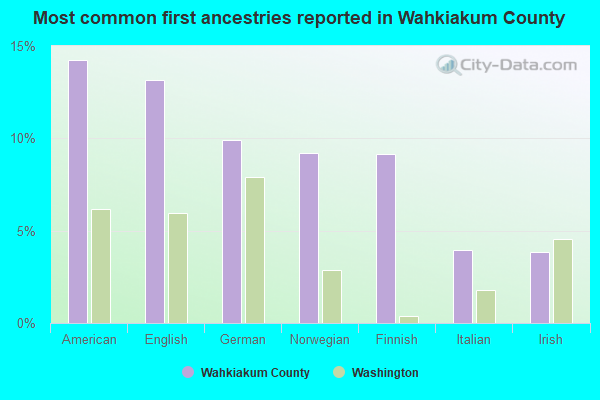
- American (22%)
- English (16%)
- Norwegian (10%)
- German (9%)
- Finnish (6%)
- Scottish (6%)
- European (4%)
People in group quarters in Wahkiakum County, Washington in 2010:
- 32 people in nursing facilities/skilled-nursing facilities
- 6 people in local jails and other municipal confinement facilities
- 6 people in workers' group living quarters and job corps centers
- 4 people in emergency and transitional shelters (with sleeping facilities) for people experiencing homelessness
10 people in local jails and other confinement facilities (including police lockups)
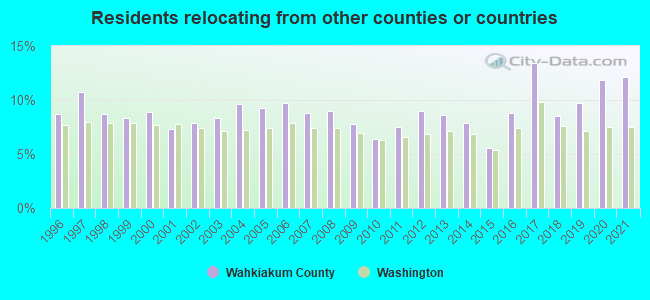
12.13% of this county's 2021 resident taxpayers lived in other counties in 2020 ($100,981 average adjusted gross income)
| Here: | 12.13% |
| Washington average: | 7.53% |
10 or fewer of this county's residents moved from foreign countries.
7.64% relocated from other counties in Washington ($70,718 average AGI)
4.49% relocated from other states ($30,264 average AGI)
Wahkiakum County: 4.49% Washington average: 3.85%
Top counties from which taxpayers relocated into this county between 2020 and 2021:
| from Cowlitz County, WA | |
| from Clark County, WA |
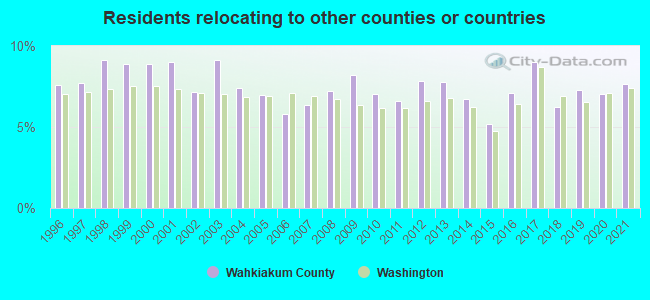
7.67% of this county's 2020 resident taxpayers moved to other counties in 2021 ($47,431 average adjusted gross income)
| Here: | 7.67% |
| Washington average: | 7.40% |
10 or fewer of this county's residents moved to foreign countries.
5.08% relocated to other counties in Washington ($32,323 average AGI)
2.60% relocated to other states ($15,108 average AGI)
Wahkiakum County: 2.60% Washington average: 3.73%
Top counties to which taxpayers relocated from this county between 2020 and 2021:
| to Cowlitz County, WA |
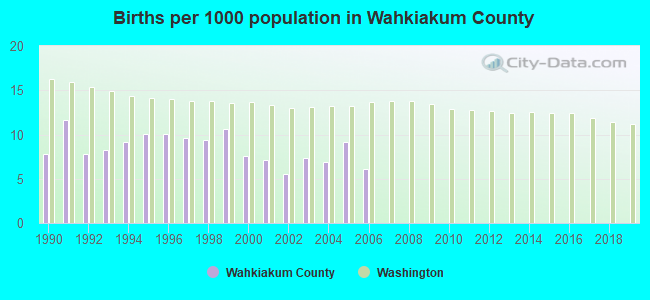
Births per 1000 population from 1990 to 1999: 9.4
Births per 1000 population from 2000 to 2006: 7.1
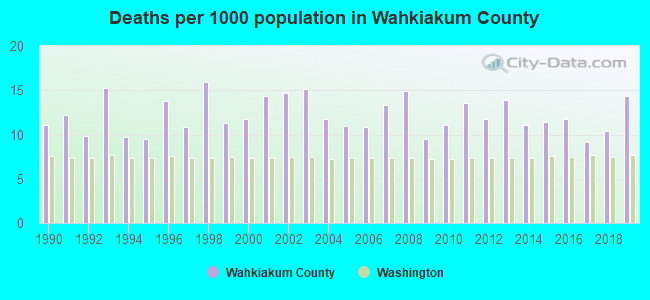
Deaths per 1000 population from 1990 to 1999: 11.9
Deaths per 1000 population from 2000 to 2009: 12.7
Deaths per 1000 population from 2010 to 2020: 11.9
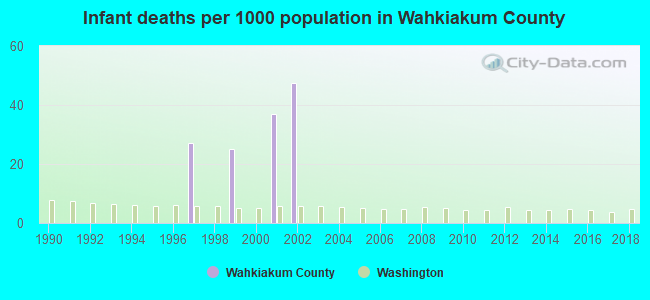
Infant deaths per 1000 live births from 1990 to 1999: 5.2
Infant deaths per 1000 live births from 2000 to 2006: 12.1
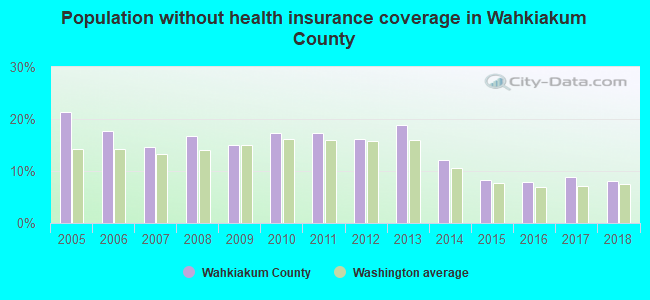
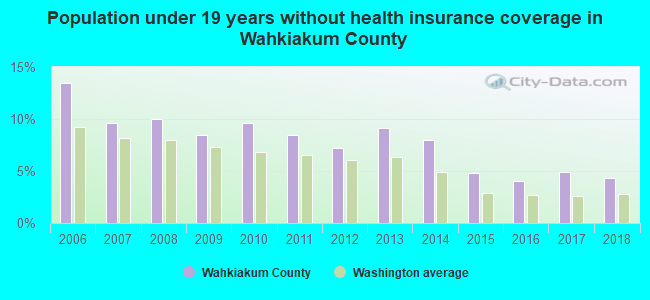
Persons under 19 years old without health insurance coverage in 2018: 4.3%
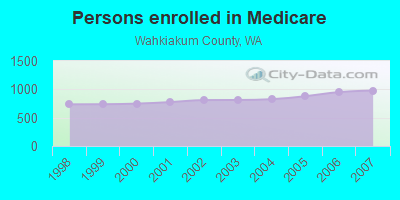
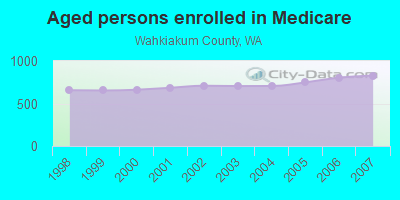
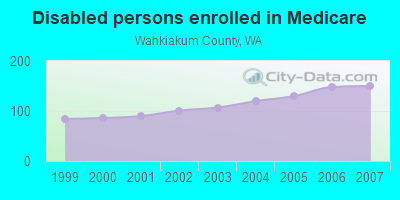
Persons enrolled in hospital insurance and/or supplemental medical insurance (Medicare) in July 1, 2007: 979 (829 aged, 150 disabled)
Children under 18 without health insurance coverage in 2007: 60 (8%)
Most common underlying causes of death in Wahkiakum County, Washington in 1999 - 2019:
- Atherosclerotic heart disease (34)
Population without health insurance coverage in 2000: 15%
Children under 18 without health insurance coverage in 2000: 14%
Medical specialist MDs per 100,000 population in 2005: 1,247
Total births per 100,000 population, July 2005 - July 2006 : 26
Total deaths per 100,000 population, July 2005 - July 2006: 52
Household type by relationship:
Households: 4,532- Male householders: 1,067 (296 living alone), Female householders: 950 (272 living alone)
1,198 spouses (1,198 opposite-sex spouses), 83 unmarried partners, (69 opposite-sex unmarried partners), 781 children (674 natural, 78 adopted, 26 stepchildren), 152 grandchildren, 4 brothers or sisters, 31 parents, 0 foster children, 114 other relatives, 103 non-relatives
- In group quarters: 46
Size of family households: 759 2-persons, 235 3-persons, 145 4-persons, 110 5-persons, 70 6-persons, 20 7-or-more-persons.
Size of nonfamily households: 568 1-person, 103 2-persons, 9 3-persons.
520 married couples with children.
48 single-parent households (6 men, 42 women).
94.9% of residents of Wahkiakum speak English at home.
4.1% of residents speak Spanish at home (100% speak English very well).
0.7% of residents speak other Indo-European language at home (100% speak English very well).
0.4% of residents speak Asian or Pacific Island language at home (79% speak English very well, 21% speak English well).
0.1% of residents speak other language at home (100% speak English very well).
In fiscal year 2004:
Federal Government expenditure: $22,714,000 ($6,049 per capita)
Department of Defense expenditure: $616,000
Federal direct payments to individuals for retirement and disability: $13,266,000
Federal other direct payments to individuals: $5,347,000
Federal direct payments not to individuals: $149,000
Federal grants: $2,449,000
Federal procurement contracts: $742,000 ($0,000 Department of Defense)
Federal salaries and wages: $762,000 ($0,000 Department of Defense)
Federal Government direct loans: $0,000
Federal guaranteed/insured loans: $993,000
Federal Government insurance: $28,052,000
Population change from April 1, 2000 to July 1, 2005:
Births: 145| Here: | 38 per 1000 residents |
| State: | 66 per 1000 residents |
Deaths: 286
| Here: | 74 per 1000 residents |
| State: | 38 per 1000 residents |
Net international migration: 0
| Here: | 0 per 1000 residents |
| State: | +21 per 1000 residents |
Net internal migration: +172
| Here: | +45 per 1000 residents |
| State: | +13 per 1000 residents |
Total withdrawal of fresh water for public supply: 0.31 millions of gallons per day (23% from ground, 77% from surface)
| Here: | 6.5 |
| State: | 6.5 |
| Here: | 4.2 |
| State: | 3.9 |
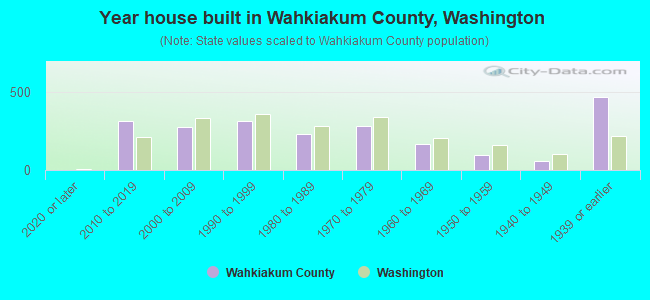
- Year house built in Wahkiakum County, Washington
- 02020 or later
- 3432010 to 2019
- 2532000 to 2009
- 3171990 to 1999
- 1651980 to 1989
- 3461970 to 1979
- 1391960 to 1969
- 1021950 to 1959
- 1021940 to 1949
- 4861939 or earlier
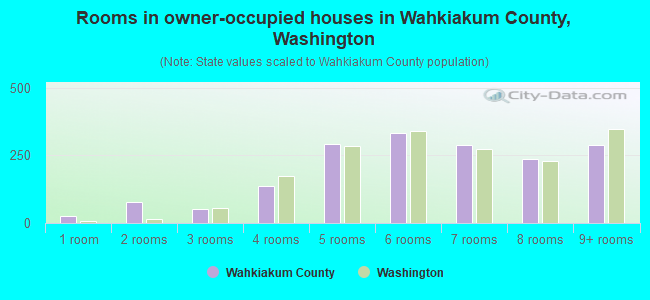
- Rooms in owner-occupied houses in Wahkiakum County, Washington
- 01 room
- 712 rooms
- 533 rooms
- 1134 rooms
- 3115 rooms
- 3336 rooms
- 2727 rooms
- 3148 rooms
- 2679+ rooms
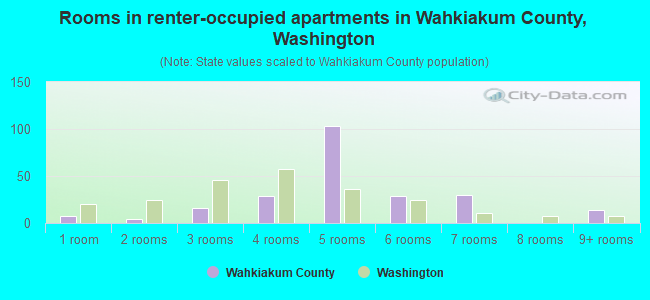
- Rooms in renter-occupied apartments in Wahkiakum County, Washington
- 41 room
- 52 rooms
- 423 rooms
- 1214 rooms
- 705 rooms
- 176 rooms
- 237 rooms
- 08 rooms
- 89+ rooms
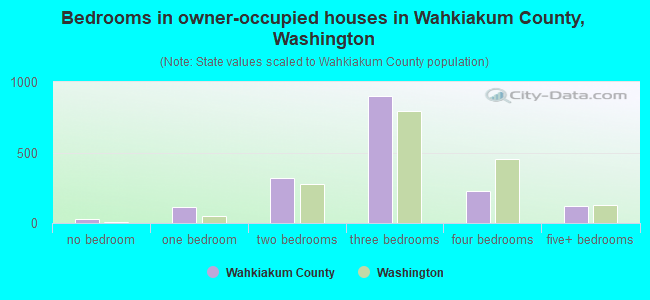
- Bedrooms in owner-occupied houses in Wahkiakum County, Washington
- 0no bedroom
- 911 bedroom
- 3332 bedrooms
- 8973 bedrooms
- 2704 bedrooms
- 1415+ bedrooms
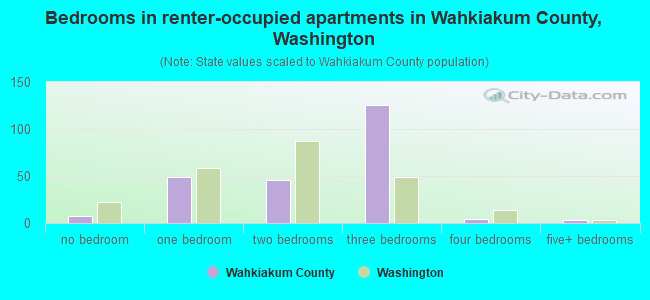
- Bedrooms in renter-occupied apartments in Wahkiakum County, Washington
- 4no bedroom
- 791 bedroom
- 322 bedrooms
- 1653 bedrooms
- 44 bedrooms
- 45+ bedrooms
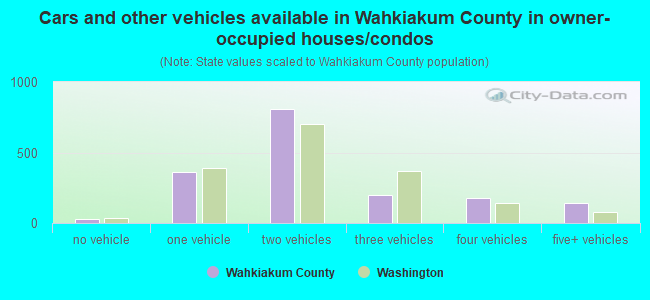
- Cars and other vehicles available in Wahkiakum County in owner-occupied houses/condos
- 25no vehicle
- 4091 vehicle
- 7852 vehicles
- 2293 vehicles
- 1064 vehicles
- 1815+ vehicles
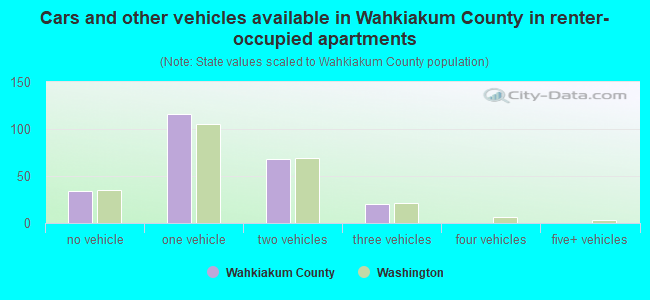
- Cars and other vehicles available in Wahkiakum County in renter-occupied apartments
- 45no vehicle
- 1511 vehicle
- 362 vehicles
- 513 vehicles
- 114 vehicles
- 05+ vehicles
94.4% of Wahkiakum County residents lived in the same house 1 years ago.
Out of people who lived in different houses, 16% lived in this county.
Out of people who lived in different counties, 72% lived in Washington.
| Wahkiakum County: | 94.4% |
| State average: | 85.2% |
Place of birth for U.S.-born residents:
- This state: 1,790
- Other state: 2,506
- Northeast: 138
- Midwest: 404
- South: 217
- West: 1,750
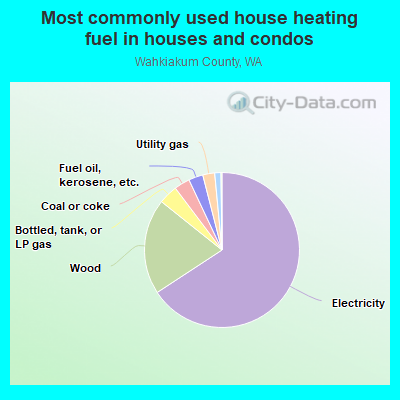
- 70.5%Electricity
- 15.8%Wood
- 3.6%Bottled, tank, or LP gas
- 3.4%Coal or coke
- 3.1%Fuel oil, kerosene, etc.
- 2.0%No fuel used
- 1.0%Utility gas
- 0.5%Other fuel
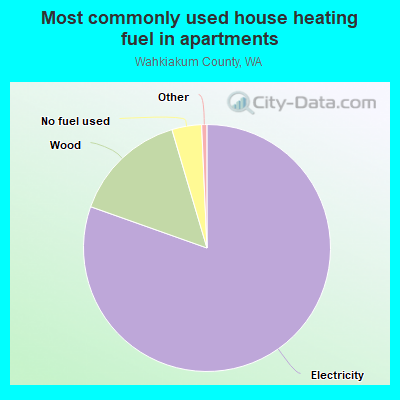
- 66.7%Electricity
- 25.7%Wood
- 4.5%Bottled, tank, or LP gas
- 3.1%No fuel used
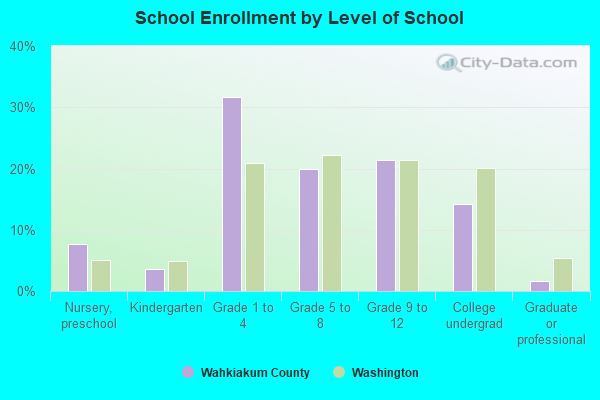
Private vs. public school enrollment:
| Here: | 30.6% |
| Washington: | 12.4% |
| Here: | 5.5% |
| Washington: | 9.2% |
| Here: | 34.2% |
| Washington: | 16.5% |
Wahkiakum County government finances - Expenditure in 2018:
- Charges - Other: $507,000
Solid Waste Management: $46,000
Regular Highways: $26,000
Parks and Recreation: $8,000
- Construction - Regular Highways: $176,000
Parks and Recreation: $40,000
General - Other: $32,000
- Current Operations - Regular Highways: $2,298,000
Health - Other: $1,966,000
Financial Administration: $1,271,000
Police Protection: $1,003,000
Correctional Institutions: $741,000
Judicial and Legal Services: $716,000
Natural Resources - Other: $655,000
General - Other: $478,000
Transit Utilities: $403,000
Central Staff Services: $318,000
General Public Buildings: $252,000
Local Fire Protection: $185,000
Housing and Community Development: $150,000
Solid Waste Management: $129,000
Parks and Recreation: $56,000
Libraries: $8,000
- Federal Intergovernmental - General Local Government Support: $6,000
- General - Interest on Debt: $203,000
- Intergovernmental to Local - Other - Financial Administration: $1,000
- Local Intergovernmental - Other: $194,000
- Long Term Debt - Beginning Outstanding - Unspecified Public Purpose: $5,064,000
Outstanding Unspecified Public Purpose: $4,450,000
Retired Unspecified Public Purpose: $713,000
Issue, Unspecified Public Purpose: $99,000
- Miscellaneous - Sale of Property: $1,447,000
General Revenue - Other: $333,000
Fines and Forfeits: $106,000
Special Assessments: $29,000
Rents: $26,000
Donations From Private Sources: $14,000
Interest Earnings: $0
- Other Capital Outlay - General - Other: $441,000
Housing and Community Development: $137,000
Local Fire Protection: $36,000
Parks and Recreation: $24,000
Police Protection: $19,000
Judicial and Legal Services: $13,000
Health - Other: $9,000
Natural Resources - Other: $4,000
Correctional Institutions: $4,000
Financial Administration: $3,000
- Other Funds - Cash and Securities: $248,000
- Revenue - Transit Utilities: $394,000
- State Intergovernmental - Other: $2,753,000
Health and Hospitals: $1,892,000
Highways: $1,707,000
General Local Government Support: $21,000
- Tax - Property: $1,191,000
Severance: $344,000
General Sales and Gross Receipts: $328,000
Documentary and Stock Transfer: $85,000
Motor Vehicle License: $82,000
Public Utilities Sales: $39,000
Other Selective Sales: $38,000
Occupation and Business License - Other: $33,000
Other License: $28,000
- Total Salaries and Wages: $5,173,000
Wahkiakum County government finances - Revenue in 2018:
- Charges - Other: $507,000
Solid Waste Management: $46,000
Regular Highways: $26,000
Parks and Recreation: $8,000
- Construction - Regular Highways: $176,000
Parks and Recreation: $40,000
General - Other: $32,000
- Current Operations - Regular Highways: $2,298,000
Health - Other: $1,966,000
Financial Administration: $1,271,000
Police Protection: $1,003,000
Correctional Institutions: $741,000
Judicial and Legal Services: $716,000
Natural Resources - Other: $655,000
General - Other: $478,000
Transit Utilities: $403,000
Central Staff Services: $318,000
General Public Buildings: $252,000
Local Fire Protection: $185,000
Housing and Community Development: $150,000
Solid Waste Management: $129,000
Parks and Recreation: $56,000
Libraries: $8,000
- Federal Intergovernmental - General Local Government Support: $6,000
- General - Interest on Debt: $203,000
- Intergovernmental to Local - Other - Financial Administration: $1,000
- Local Intergovernmental - Other: $194,000
- Long Term Debt - Beginning Outstanding - Unspecified Public Purpose: $5,064,000
Outstanding Unspecified Public Purpose: $4,450,000
Retired Unspecified Public Purpose: $713,000
Issue, Unspecified Public Purpose: $99,000
- Miscellaneous - Sale of Property: $1,447,000
General Revenue - Other: $333,000
Fines and Forfeits: $106,000
Special Assessments: $29,000
Rents: $26,000
Donations From Private Sources: $14,000
Interest Earnings: $0
- Other Capital Outlay - General - Other: $441,000
Housing and Community Development: $137,000
Local Fire Protection: $36,000
Parks and Recreation: $24,000
Police Protection: $19,000
Judicial and Legal Services: $13,000
Health - Other: $9,000
Natural Resources - Other: $4,000
Correctional Institutions: $4,000
Financial Administration: $3,000
- Other Funds - Cash and Securities: $248,000
- Revenue - Transit Utilities: $394,000
- State Intergovernmental - Other: $2,753,000
Health and Hospitals: $1,892,000
Highways: $1,707,000
General Local Government Support: $21,000
- Tax - Property: $1,191,000
Severance: $344,000
General Sales and Gross Receipts: $328,000
Documentary and Stock Transfer: $85,000
Motor Vehicle License: $82,000
Public Utilities Sales: $39,000
Other Selective Sales: $38,000
Occupation and Business License - Other: $33,000
Other License: $28,000
- Total Salaries and Wages: $5,173,000
Wahkiakum County government finances - Debt in 2018:
- Charges - Other: $507,000
Solid Waste Management: $46,000
Regular Highways: $26,000
Parks and Recreation: $8,000
- Construction - Regular Highways: $176,000
Parks and Recreation: $40,000
General - Other: $32,000
- Current Operations - Regular Highways: $2,298,000
Health - Other: $1,966,000
Financial Administration: $1,271,000
Police Protection: $1,003,000
Correctional Institutions: $741,000
Judicial and Legal Services: $716,000
Natural Resources - Other: $655,000
General - Other: $478,000
Transit Utilities: $403,000
Central Staff Services: $318,000
General Public Buildings: $252,000
Local Fire Protection: $185,000
Housing and Community Development: $150,000
Solid Waste Management: $129,000
Parks and Recreation: $56,000
Libraries: $8,000
- Federal Intergovernmental - General Local Government Support: $6,000
- General - Interest on Debt: $203,000
- Intergovernmental to Local - Other - Financial Administration: $1,000
- Local Intergovernmental - Other: $194,000
- Long Term Debt - Beginning Outstanding - Unspecified Public Purpose: $5,064,000
Outstanding Unspecified Public Purpose: $4,450,000
Retired Unspecified Public Purpose: $713,000
Issue, Unspecified Public Purpose: $99,000
- Miscellaneous - Sale of Property: $1,447,000
General Revenue - Other: $333,000
Fines and Forfeits: $106,000
Special Assessments: $29,000
Rents: $26,000
Donations From Private Sources: $14,000
Interest Earnings: $0
- Other Capital Outlay - General - Other: $441,000
Housing and Community Development: $137,000
Local Fire Protection: $36,000
Parks and Recreation: $24,000
Police Protection: $19,000
Judicial and Legal Services: $13,000
Health - Other: $9,000
Natural Resources - Other: $4,000
Correctional Institutions: $4,000
Financial Administration: $3,000
- Other Funds - Cash and Securities: $248,000
- Revenue - Transit Utilities: $394,000
- State Intergovernmental - Other: $2,753,000
Health and Hospitals: $1,892,000
Highways: $1,707,000
General Local Government Support: $21,000
- Tax - Property: $1,191,000
Severance: $344,000
General Sales and Gross Receipts: $328,000
Documentary and Stock Transfer: $85,000
Motor Vehicle License: $82,000
Public Utilities Sales: $39,000
Other Selective Sales: $38,000
Occupation and Business License - Other: $33,000
Other License: $28,000
- Total Salaries and Wages: $5,173,000
Wahkiakum County government finances - Cash and Securities in 2018:
- Charges - Other: $507,000
Solid Waste Management: $46,000
Regular Highways: $26,000
Parks and Recreation: $8,000
- Construction - Regular Highways: $176,000
Parks and Recreation: $40,000
General - Other: $32,000
- Current Operations - Regular Highways: $2,298,000
Health - Other: $1,966,000
Financial Administration: $1,271,000
Police Protection: $1,003,000
Correctional Institutions: $741,000
Judicial and Legal Services: $716,000
Natural Resources - Other: $655,000
General - Other: $478,000
Transit Utilities: $403,000
Central Staff Services: $318,000
General Public Buildings: $252,000
Local Fire Protection: $185,000
Housing and Community Development: $150,000
Solid Waste Management: $129,000
Parks and Recreation: $56,000
Libraries: $8,000
- Federal Intergovernmental - General Local Government Support: $6,000
- General - Interest on Debt: $203,000
- Intergovernmental to Local - Other - Financial Administration: $1,000
- Local Intergovernmental - Other: $194,000
- Long Term Debt - Beginning Outstanding - Unspecified Public Purpose: $5,064,000
Outstanding Unspecified Public Purpose: $4,450,000
Retired Unspecified Public Purpose: $713,000
Issue, Unspecified Public Purpose: $99,000
- Miscellaneous - Sale of Property: $1,447,000
General Revenue - Other: $333,000
Fines and Forfeits: $106,000
Special Assessments: $29,000
Rents: $26,000
Donations From Private Sources: $14,000
Interest Earnings: $0
- Other Capital Outlay - General - Other: $441,000
Housing and Community Development: $137,000
Local Fire Protection: $36,000
Parks and Recreation: $24,000
Police Protection: $19,000
Judicial and Legal Services: $13,000
Health - Other: $9,000
Natural Resources - Other: $4,000
Correctional Institutions: $4,000
Financial Administration: $3,000
- Other Funds - Cash and Securities: $248,000
- Revenue - Transit Utilities: $394,000
- State Intergovernmental - Other: $2,753,000
Health and Hospitals: $1,892,000
Highways: $1,707,000
General Local Government Support: $21,000
- Tax - Property: $1,191,000
Severance: $344,000
General Sales and Gross Receipts: $328,000
Documentary and Stock Transfer: $85,000
Motor Vehicle License: $82,000
Public Utilities Sales: $39,000
Other Selective Sales: $38,000
Occupation and Business License - Other: $33,000
Other License: $28,000
- Total Salaries and Wages: $5,173,000
Supplemental Security Income (SSI) in 2006:
- Total number of recipients: 69
- Number of aged recipients: 0
- Number of blind and disabled recipients: 0
- Number of recipients under 18: 0
- Number of recipients between 18 and 64: 54
- Number of recipients older than 64: 0
- Number of recipients also receiving OASDI: 25
- Amount of payments (thousands of dollars): 30
| Most common first names in Wahkiakum County, WA among deceased individuals | ||
| Name | Count | Lived (average) |
|---|---|---|
| John | 24 | 77.8 years |
| George | 21 | 77.8 years |
| William | 15 | 74.3 years |
| Mary | 13 | 85.6 years |
| Robert | 13 | 73.4 years |
| Charles | 12 | 81.7 years |
| Mildred | 11 | 79.4 years |
| Harold | 10 | 80.1 years |
| James | 10 | 69.7 years |
| Walter | 10 | 78.0 years |
| Most common last names in Wahkiakum County, WA among deceased individuals | ||
| Last name | Count | Lived (average) |
|---|---|---|
| Johnson | 21 | 76.2 years |
| Anderson | 13 | 71.3 years |
| Doumit | 9 | 76.4 years |
| Quigley | 9 | 73.2 years |
| Pedersen | 9 | 72.9 years |
| Olson | 9 | 85.0 years |
| Irving | 8 | 84.2 years |
| Witham | 8 | 80.4 years |
| Petersen | 7 | 76.1 years |
| Smith | 7 | 80.4 years |
Businesses in Wahkiakum County, WA
- Ace Hardware: 1
Wahkiakum County on our top lists:
- #83 on the list of "Top 101 counties with highest percentage of residents voting for 3rd party candidates in the 2012 Presidential Election"