Crime rate in Athens-Clarke County, Georgia (GA): murders, rapes, robberies, assaults, burglaries, thefts, auto thefts, arson, law enforcement employees, police officers, crime map

Crime rate in Athens-Clarke County, GA
The 2022 crime rate in Athens-Clarke County, GA is 328 (City-Data.com crime index), which is 1.3 times greater than the U.S. average. It was higher than in 90.3% U.S. cities. The 2022 Athens-Clarke County crime rate rose by 3% compared to 2021. The number of homicides stood at 4. In the last 5 years Athens-Clarke County has seen increasing violent crime and decreasing property crime.See how dangerous Athens-Clarke County, GA is compared to the nearest cities:
(Note: Higher means more crime)
(Note: Higher means more crime)
| Athens-Clarke County: | 327.5 |
| Winterville: | 36.9 |
| Statham: | 55.9 |
| Arcade: | 138.6 |
| Danielsville: | 87.1 |
| Jefferson: | 57.0 |
| Commerce: | 77.4 |
| Winder: | 157.6 |
| Monroe: | 257.3 |
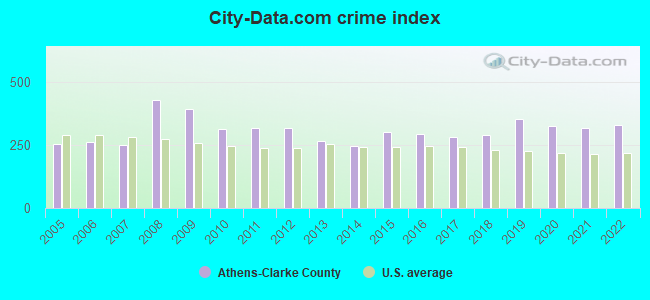
The City-Data.com crime index weighs serious crimes and violent crimes more heavily. Higher means more crime, U.S. average is 246.1. It adjusts for the number of visitors and daily workers commuting into cities.
- means the value is smaller than the state average.- means the value is about the same as the state average.
- means the value is bigger than the state average.
- means the value is much bigger than the state average.
Violent crime rate in 2022
| Athens-Clarke County: | 362.0 |
| U.S. Average: | 219.8 |
Violent crime rate in 2021
| Athens-Clarke County: | 339.5 |
| U.S. Average: | 224.8 |
Violent crime rate in 2020
| Athens-Clarke County: | 316.8 |
| U.S. Average: | 228.2 |
Violent crime rate in 2019
| Athens-Clarke County: | 317.5 |
| U.S. Average: | 219.9 |
Violent crime rate in 2018
| Athens-Clarke County: | 248.8 |
| U.S. Average: | 221.2 |
Violent crime rate in 2017
| Athens-Clarke County: | 237.8 |
| U.S. Average: | 226.2 |
Violent crime rate in 2016
| Athens-Clarke County: | 241.7 |
| U.S. Average: | 227.3 |
Violent crime rate in 2015
| Athens-Clarke County: | 235.8 |
| U.S. Average: | 219.3 |
Violent crime rate in 2014
| Athens-Clarke County: | 173.6 |
| U.S. Average: | 211.1 |
Violent crime rate in 2013
| Athens-Clarke County: | 186.1 |
| U.S. Average: | 214.2 |
Violent crime rate in 2012
| Athens-Clarke County: | 221.4 |
| U.S. Average: | 187.4 |
Violent crime rate in 2011
| Athens-Clarke County: | 198.5 |
| U.S. Average: | 187.1 |
Violent crime rate in 2010
| Athens-Clarke County: | 179.1 |
| U.S. Average: | 195.7 |
Violent crime rate in 2009
| Athens-Clarke County: | 237.0 |
| U.S. Average: | 208.9 |
Violent crime rate in 2008
| Athens-Clarke County: | 261.1 |
| U.S. Average: | 222.5 |
Violent crime rate in 2007
| Athens-Clarke County: | 150.5 |
| U.S. Average: | 229.1 |
Violent crime rate in 2006
| Athens-Clarke County: | 142.8 |
| U.S. Average: | 232.6 |
Violent crime rate in 2005
| Athens-Clarke County: | 134.9 |
| U.S. Average: | 227.0 |
Property crime rate in 2022
| Athens-Clarke County: | 208.1 |
| U.S. Average: | 166.5 |
Property crime rate in 2021
| Athens-Clarke County: | 221.4 |
| U.S. Average: | 157.8 |
Property crime rate in 2020
| Athens-Clarke County: | 250.2 |
| U.S. Average: | 169.6 |
Property crime rate in 2019
| Athens-Clarke County: | 267.4 |
| U.S. Average: | 179.7 |
Property crime rate in 2018
| Athens-Clarke County: | 239.5 |
| U.S. Average: | 190.2 |
Property crime rate in 2017
| Athens-Clarke County: | 257.8 |
| U.S. Average: | 206.4 |
Property crime rate in 2016
| Athens-Clarke County: | 283.1 |
| U.S. Average: | 216.6 |
Property crime rate in 2015
| Athens-Clarke County: | 312.9 |
| U.S. Average: | 221.5 |
Property crime rate in 2014
| Athens-Clarke County: | 265.4 |
| U.S. Average: | 230.8 |
Property crime rate in 2013
| Athens-Clarke County: | 306.4 |
| U.S. Average: | 250.4 |
Property crime rate in 2012
| Athens-Clarke County: | 363.3 |
| U.S. Average: | 267.3 |
Property crime rate in 2011
| Athens-Clarke County: | 402.7 |
| U.S. Average: | 273.5 |
Property crime rate in 2010
| Athens-Clarke County: | 412.3 |
| U.S. Average: | 276.4 |
Property crime rate in 2009
| Athens-Clarke County: | 521.5 |
| U.S. Average: | 285.6 |
Property crime rate in 2008
| Athens-Clarke County: | 539.4 |
| U.S. Average: | 302.2 |
Property crime rate in 2007
| Athens-Clarke County: | 308.1 |
| U.S. Average: | 309.2 |
Property crime rate in 2006
| Athens-Clarke County: | 314.4 |
| U.S. Average: | 317.3 |
Property crime rate in 2005
| Athens-Clarke County: | 309.0 |
| U.S. Average: | 322.3 |


Full-time law enforcement employees in 2021, including police officers: 270 (210 officers - 182 male; 28 female).
| Officers per 1,000 residents here: | 1.65 |
| Georgia average: | 2.45 |
Full-time law enforcement employees in 2020, including police officers: 273 (215 officers - 188 male; 27 female).
| Officers per 1,000 residents here: | 1.68 |
| Georgia average: | 2.63 |
Full-time law enforcement employees in 2019, including police officers: 280 (215 officers - 189 male; 26 female).
| Officers per 1,000 residents here: | 1.69 |
| Georgia average: | 2.58 |
Full-time law enforcement employees in 2018, including police officers: 278 (218 officers - 193 male; 25 female).
| Officers per 1,000 residents here: | 1.72 |
| Georgia average: | 2.75 |
Full-time law enforcement employees in 2017, including police officers: 291 (227 officers - 204 male; 23 female).
| Officers per 1,000 residents here: | 1.82 |
| Georgia average: | 2.65 |
Full-time law enforcement employees in 2016, including police officers: 292 (228 officers - 202 male; 26 female).
| Officers per 1,000 residents here: | 1.84 |
| Georgia average: | 2.55 |
Full-time law enforcement employees in 2015, including police officers: 292 (229 officers - 204 male; 25 female).
| Officers per 1,000 residents here: | 1.89 |
| Georgia average: | 2.48 |
Full-time law enforcement employees in 2014, including police officers: 287 (225 officers - 202 male; 23 female).
| Officers per 1,000 residents here: | 1.85 |
| Georgia average: | 2.60 |
Full-time law enforcement employees in 2013, including police officers: 298 (235 officers - 209 male; 26 female).
| Officers per 1,000 residents here: | 1.96 |
| Georgia average: | 2.73 |
Full-time law enforcement employees in 2012, including police officers: 303 (239 officers - 211 male; 28 female).
| Officers per 1,000 residents here: | 2.03 |
| Georgia average: | 2.77 |
Full-time law enforcement employees in 2011, including police officers: 295 (231 officers - 210 male; 21 female).
| Officers per 1,000 residents here: | 1.97 |
| Georgia average: | 2.78 |
Full-time law enforcement employees in 2010, including police officers: 293 (228 officers - 208 male; 20 female).
| Officers per 1,000 residents here: | 1.97 |
| Georgia average: | 2.86 |
Full-time law enforcement employees in 2009, including police officers: 289 (230 officers - 211 male; 19 female).
| Officers per 1,000 residents here: | 2.01 |
| Georgia average: | 2.73 |
Full-time law enforcement employees in 2008, including police officers: 276 (216 officers - 197 male; 19 female).
| Officers per 1,000 residents here: | 1.90 |
| Georgia average: | 2.72 |
Full-time law enforcement employees in 2007, including police officers: 287 (227 officers - 205 male; 22 female).
| Officers per 1,000 residents here: | 2.00 |
| Georgia average: | 2.72 |
Full-time law enforcement employees in 2006, including police officers: 281 (225 officers - 205 male; 20 female).
| Officers per 1,000 residents here: | 2.11 |
| Georgia average: | 2.56 |
Full-time law enforcement employees in 2005, including police officers: 282 (223 officers - 199 male; 24 female).
| Officers per 1,000 residents here: | 2.11 |
| Georgia average: | 2.53 |
Full-time law enforcement employees in 2004, including police officers: 277 (224 officers - 200 male; 24 female).
| Officers per 1,000 residents here: | 2.15 |
| Georgia average: | 2.62 |
Full-time law enforcement employees in 2003, including police officers: 269 (217 officers - 194 male; 23 female).
| Officers per 1,000 residents here: | 2.08 |
| Georgia average: | 2.76 |


Zip codes: 30601, 30602, 30605, 30606, 30607, 30609, 30622, 30646.