Crime rate in Beech Bottom, West Virginia (WV): murders, rapes, robberies, assaults, burglaries, thefts, auto thefts, arson, crime map
Crime rate in Beech Bottom, WV
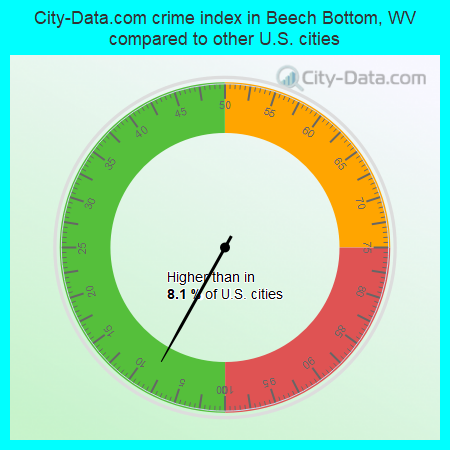
The 2021 crime rate in Beech Bottom, WV is 9 (City-Data.com crime index), which is 28.1 times smaller than the U.S. average. It was higher than in 8.1% U.S. cities. The 2021 Beech Bottom crime rate rose by 3% compared to 2019. In the last 5 years Beech Bottom has seen constant level of violent crime and rise of property crime.See how dangerous Beech Bottom, WV is compared to the nearest cities:
(Note: Higher means more crime)
(Note: Higher means more crime)
| Beech Bottom: | 8.8 |
| Wellsburg: | 5.1 |
| Tiltonsville: | 6.4 |
| West Liberty: | 12.8 |
| Clearview: | 8.8 |
| Mingo Junction: | 21.1 |
| Smithfield: | 8.5 |
| Follansbee: | 28.3 |
| Martins Ferry: | 146.8 |
Type |
2013 |
2014 |
2015 |
2016 |
2017 |
2018 |
2019 |
2021 |
|---|---|---|---|---|---|---|---|---|
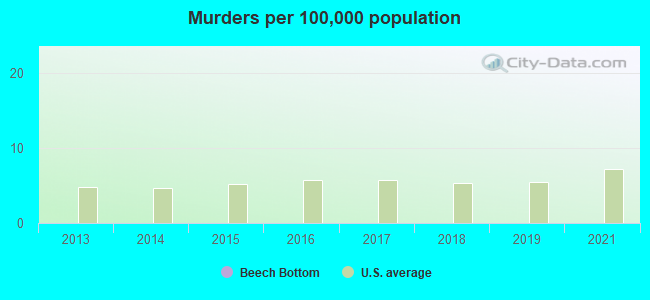
| Murders (per 100,000) | 0 (0.0) | 0 (0.0) | 0 (0.0) | 0 (0.0) | 0 (0.0) | 0 (0.0) | 0 (0.0) | 0 (0.0) |
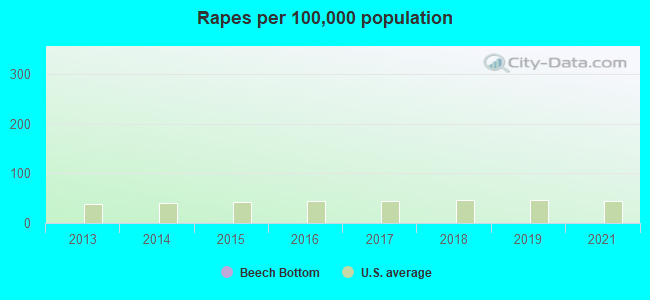
| Rapes (per 100,000) | 0 (0.0) | 0 (0.0) | 0 (0.0) | 0 (0.0) | 0 (0.0) | 0 (0.0) | 0 (0.0) | 0 (0.0) |
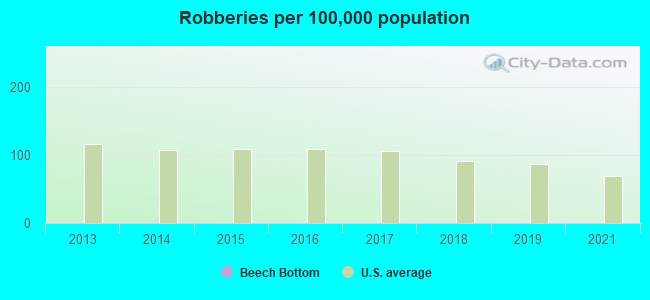
| Robberies (per 100,000) | 0 (0.0) | 0 (0.0) | 0 (0.0) | 0 (0.0) | 0 (0.0) | 0 (0.0) | 0 (0.0) | 0 (0.0) |
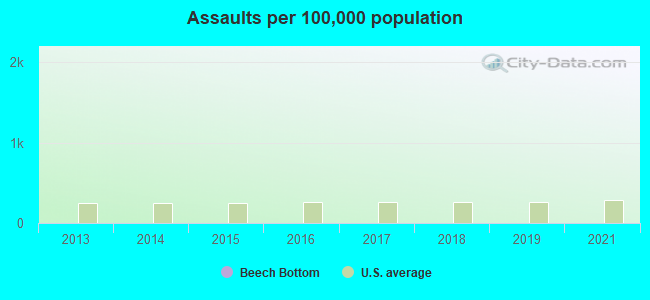
| Assaults (per 100,000) | 0 (0.0) | 0 (0.0) | 0 (0.0) | 0 (0.0) | 0 (0.0) | 0 (0.0) | 0 (0.0) | 0 (0.0) |
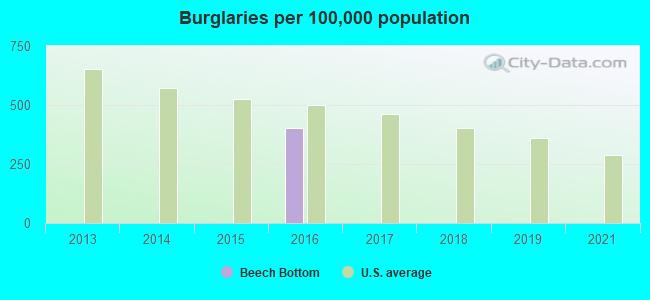
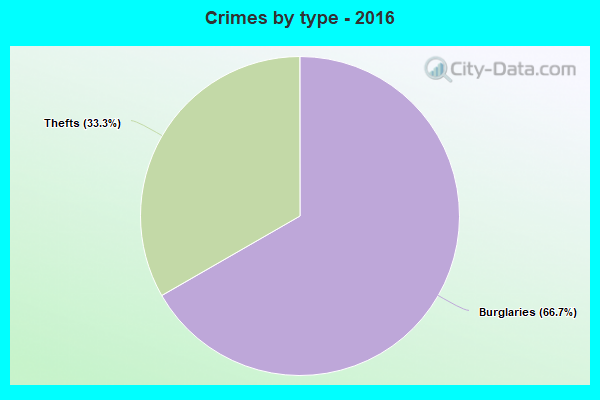
| Burglaries (per 100,000) | 0 (0.0) | 0 (0.0) | 0 (0.0) | 2 (403.2) | 0 (0.0) | 0 (0.0) | 0 (0.0) | 0 (0.0) |
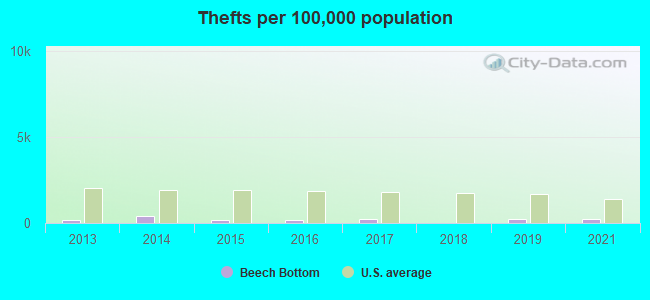
| Thefts (per 100,000) | 1 (194.6) | 2 (390.6) | 1 (199.2) | 1 (201.6) | 1 (205.8) | 0 (0.0) | 1 (212.8) | 1 (219.3) |
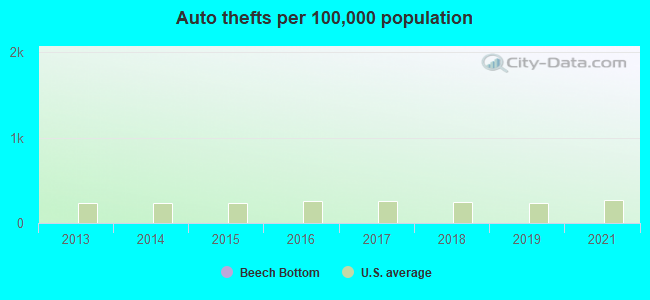
| Auto thefts (per 100,000) | 0 (0.0) | 0 (0.0) | 0 (0.0) | 0 (0.0) | 0 (0.0) | 0 (0.0) | 0 (0.0) | 0 (0.0) |
| Arson (per 100,000) | 0 (0.0) | 0 (0.0) | 0 (0.0) | 0 (0.0) | 0 (0.0) | 0 (0.0) | 0 (0.0) | 0 (0.0) |
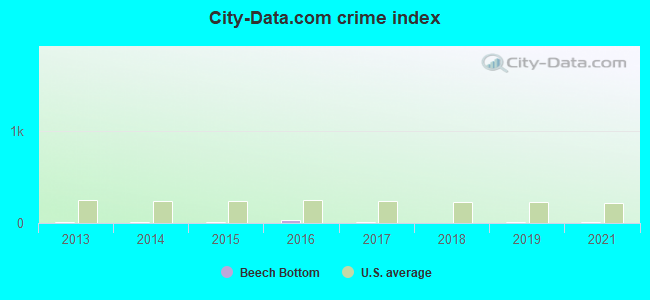
| City-Data.com crime index | 7.8 | 15.6 | 8.0 | 36.3 | 8.2 | 0.0 | 8.5 | 8.8 |
The City-Data.com crime index weighs serious crimes and violent crimes more heavily. Higher means more crime, U.S. average is 246.1. It adjusts for the number of visitors and daily workers commuting into cities.
According to our research of West Virginia and other state lists, there was 1 registered sex offender living in Beech Bottom, West Virginia as of April 24, 2024.
The ratio of all residents to sex offenders in Beech Bottom is 599 to 1.
The ratio of registered sex offenders to all residents in this city is lower than the state average.
Violent crime rate in 2021
| Beech Bottom: | 0.0 |
| U.S. Average: | 224.8 |
Violent crime rate in 2019
| Beech Bottom: | 0.0 |
| U.S. Average: | 219.9 |
Violent crime rate in 2018
| Beech Bottom: | 0.0 |
| U.S. Average: | 221.2 |
Violent crime rate in 2017
| Beech Bottom: | 0.0 |
| U.S. Average: | 226.2 |
Violent crime rate in 2016
| Beech Bottom: | 0.0 |
| U.S. Average: | 227.3 |
Violent crime rate in 2015
| Beech Bottom: | 0.0 |
| U.S. Average: | 219.3 |
Violent crime rate in 2014
| Beech Bottom: | 0.0 |
| U.S. Average: | 211.1 |
Violent crime rate in 2013
| Beech Bottom: | 0.0 |
| U.S. Average: | 214.2 |
Property crime rate in 2021
| Beech Bottom: | 11.0 |
| U.S. Average: | 157.8 |
Property crime rate in 2019
| Beech Bottom: | 10.6 |
| U.S. Average: | 179.7 |
Property crime rate in 2018
| Beech Bottom: | 0.0 |
| U.S. Average: | 190.2 |
Property crime rate in 2017
| Beech Bottom: | 10.3 |
| U.S. Average: | 206.4 |
Property crime rate in 2016
| Beech Bottom: | 90.7 |
| U.S. Average: | 216.6 |
Property crime rate in 2015
| Beech Bottom: | 10.0 |
| U.S. Average: | 221.5 |
Property crime rate in 2014
| Beech Bottom: | 19.5 |
| U.S. Average: | 230.8 |
Property crime rate in 2013
| Beech Bottom: | 9.7 |
| U.S. Average: | 250.4 |