Crime rate in Boise, Idaho (ID): murders, rapes, robberies, assaults, burglaries, thefts, auto thefts, arson, law enforcement employees, police officers, crime map
Crime rate in Boise, ID
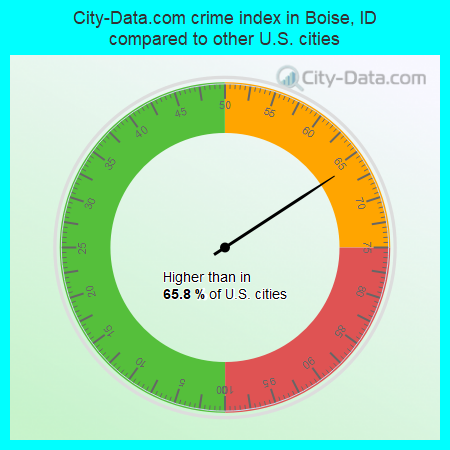
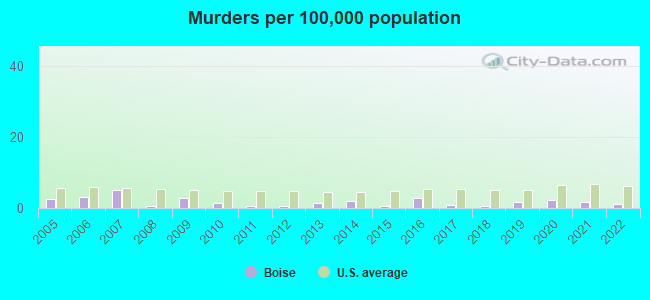
The 2022 crime rate in Boise, ID is 156 (City-Data.com crime index), which is 1.6 times lower than the U.S. average. It was higher than in 65.8% U.S. cities. The 2022 Boise crime rate fell by 19% compared to 2021. The number of homicides stood at 3 - a decrease of 1 compared to 2021. In the last 5 years Boise has seen decreasing violent crime and decreasing property crime.See how dangerous Boise, ID is compared to the nearest cities:
(Note: Higher means more crime)
(Note: Higher means more crime)
| Boise: | 156.5 |
| Garden City: | 307.6 |
| Meridian: | 76.3 |
| Nampa: | 195.6 |
| Middleton: | 147.2 |
| Emmett: | 265.1 |
| Caldwell: | 205.4 |
| Idaho City: | 340.4 |
| Wilder: | 200.6 |
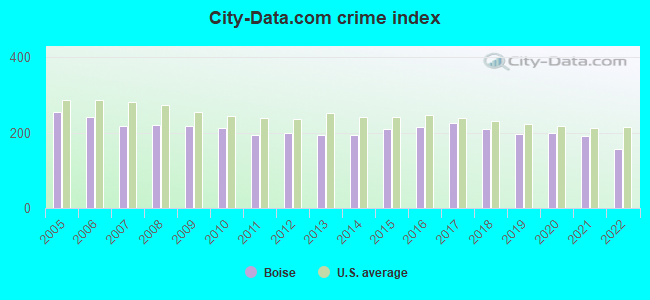
The City-Data.com crime index weighs serious crimes and violent crimes more heavily. Higher means more crime, U.S. average is 246.1. It adjusts for the number of visitors and daily workers commuting into cities.
- means the value is smaller than the state average.- means the value is about the same as the state average.
- means the value is bigger than the state average.
- means the value is much bigger than the state average.
According to our research of Idaho and other state lists, there were 786 registered sex offenders living in Boise, Idaho as of April 25, 2024.
The ratio of all residents to sex offenders in Boise is 284 to 1.
The ratio of registered sex offenders to all residents in this city is near the state average.
Violent crime rate in 2022
| Boise: | 164.4 |
| U.S. Average: | 219.8 |
Violent crime rate in 2021
| Boise: | 208.7 |
| U.S. Average: | 224.8 |
Violent crime rate in 2020
| Boise: | 200.9 |
| U.S. Average: | 228.2 |
Violent crime rate in 2019
| Boise: | 198.4 |
| U.S. Average: | 219.9 |
Violent crime rate in 2018
| Boise: | 193.4 |
| U.S. Average: | 221.2 |
Violent crime rate in 2017
| Boise: | 190.8 |
| U.S. Average: | 226.2 |
Violent crime rate in 2016
| Boise: | 185.3 |
| U.S. Average: | 227.3 |
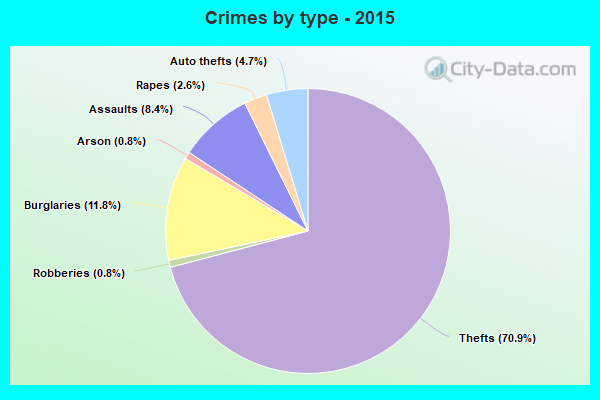
Violent crime rate in 2015
| Boise: | 189.4 |
| U.S. Average: | 219.3 |
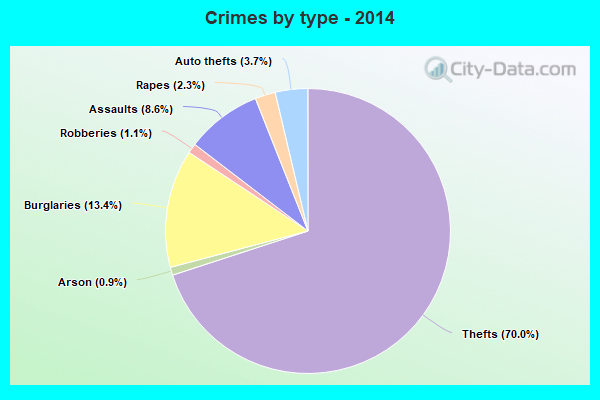
Violent crime rate in 2014
| Boise: | 174.8 |
| U.S. Average: | 211.1 |
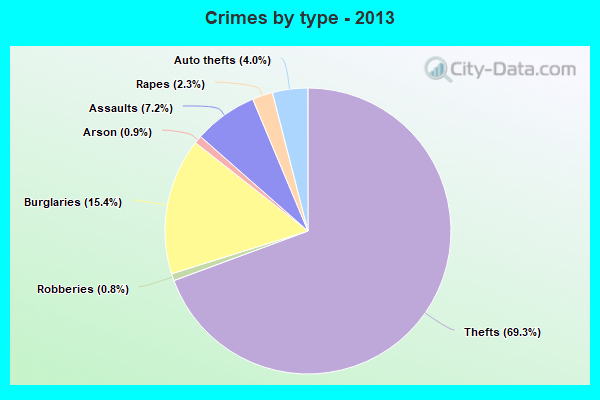
Violent crime rate in 2013
| Boise: | 161.0 |
| U.S. Average: | 214.2 |
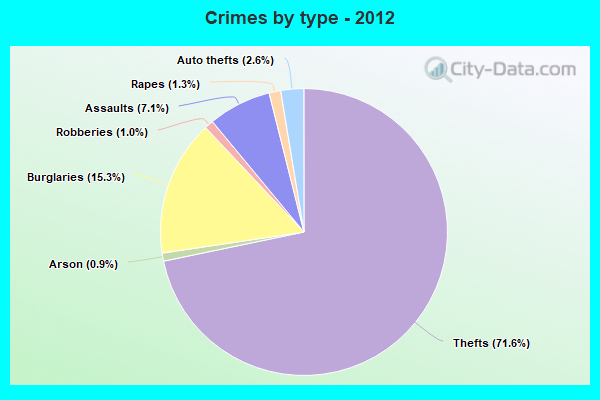
Violent crime rate in 2012
| Boise: | 154.6 |
| U.S. Average: | 187.4 |
Violent crime rate in 2011
| Boise: | 140.9 |
| U.S. Average: | 187.1 |
Violent crime rate in 2010
| Boise: | 157.0 |
| U.S. Average: | 195.7 |
Violent crime rate in 2009
| Boise: | 165.2 |
| U.S. Average: | 208.9 |
Violent crime rate in 2008
| Boise: | 158.0 |
| U.S. Average: | 222.5 |
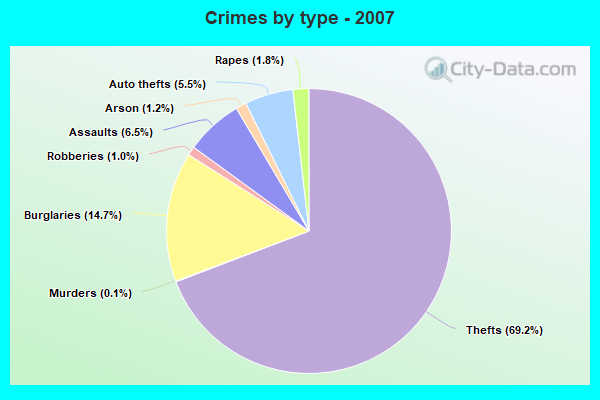
Violent crime rate in 2007
| Boise: | 169.1 |
| U.S. Average: | 229.1 |
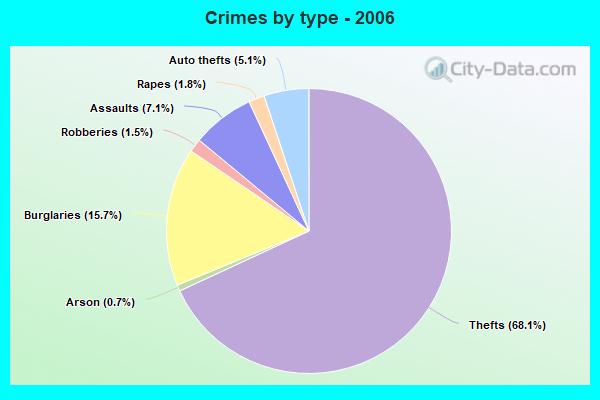
Violent crime rate in 2006
| Boise: | 195.8 |
| U.S. Average: | 232.6 |
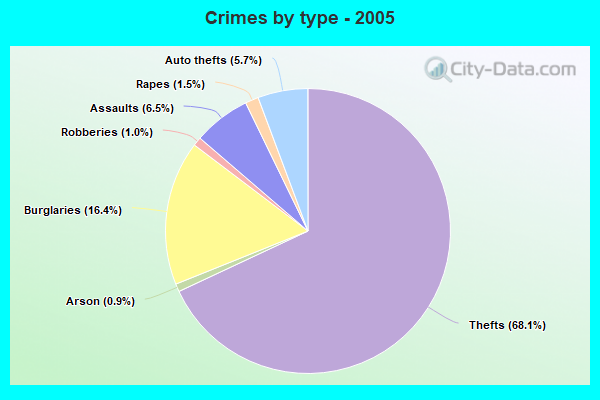
Violent crime rate in 2005
| Boise: | 188.4 |
| U.S. Average: | 227.0 |
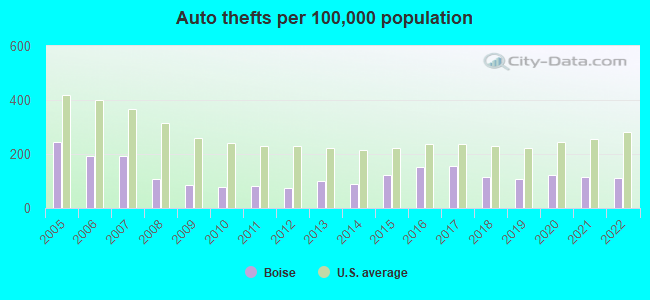
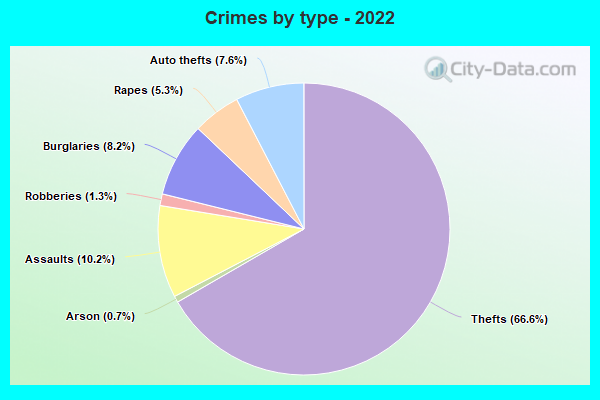
Property crime rate in 2022
| Boise: | 89.2 |
| U.S. Average: | 166.5 |
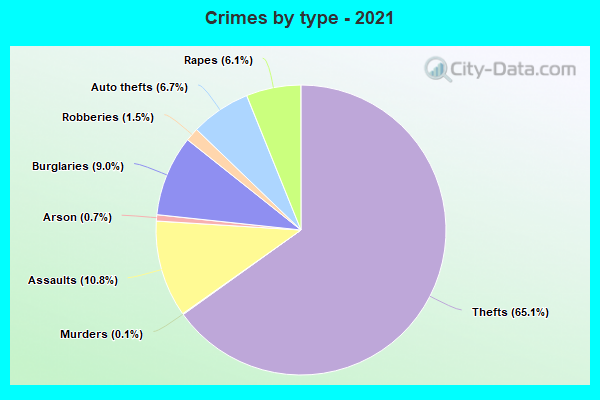
Property crime rate in 2021
| Boise: | 101.9 |
| U.S. Average: | 157.8 |
Property crime rate in 2020
| Boise: | 127.6 |
| U.S. Average: | 169.6 |
Property crime rate in 2019
| Boise: | 122.6 |
| U.S. Average: | 179.7 |
Property crime rate in 2018
| Boise: | 154.0 |
| U.S. Average: | 190.2 |
Property crime rate in 2017
| Boise: | 187.5 |
| U.S. Average: | 206.4 |
Property crime rate in 2016
| Boise: | 181.2 |
| U.S. Average: | 216.6 |
Property crime rate in 2015
| Boise: | 172.0 |
| U.S. Average: | 221.5 |
Property crime rate in 2014
| Boise: | 161.3 |
| U.S. Average: | 230.8 |
Property crime rate in 2013
| Boise: | 178.7 |
| U.S. Average: | 250.4 |
Property crime rate in 2012
| Boise: | 199.5 |
| U.S. Average: | 267.3 |
Property crime rate in 2011
| Boise: | 198.2 |
| U.S. Average: | 273.5 |
Property crime rate in 2010
| Boise: | 212.4 |
| U.S. Average: | 276.4 |
Property crime rate in 2009
| Boise: | 227.3 |
| U.S. Average: | 285.6 |
Property crime rate in 2008
| Boise: | 238.4 |
| U.S. Average: | 302.2 |
Property crime rate in 2007
| Boise: | 209.5 |
| U.S. Average: | 309.2 |
Property crime rate in 2006
| Boise: | 229.7 |
| U.S. Average: | 317.3 |
Property crime rate in 2005
| Boise: | 266.4 |
| U.S. Average: | 322.3 |
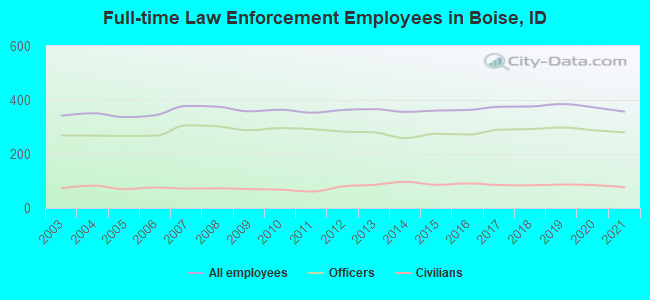
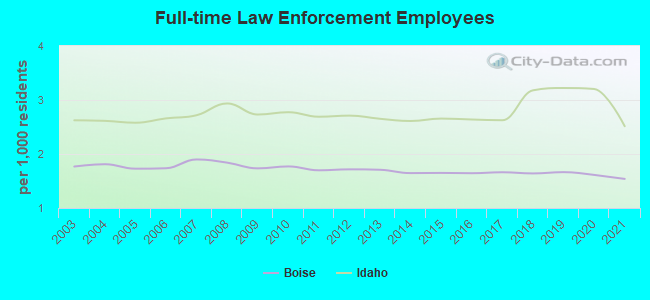
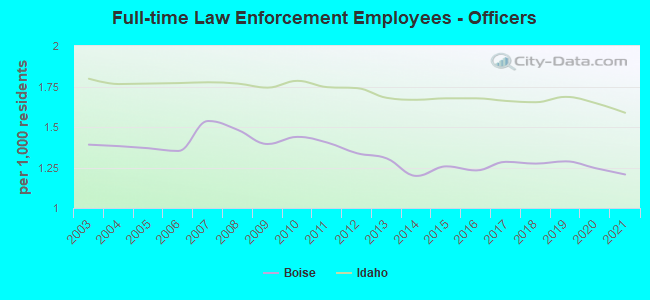
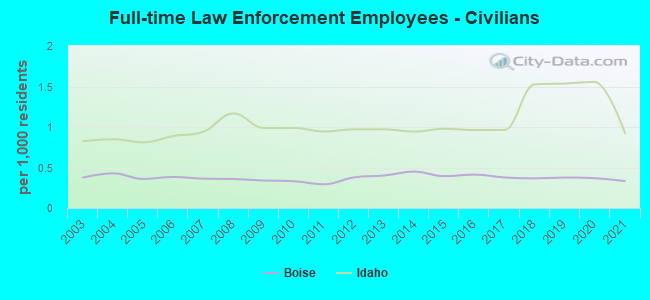
Full-time law enforcement employees in 2021, including police officers: 357 (280 officers - 249 male; 31 female).
| Officers per 1,000 residents here: | 1.21 |
| Idaho average: | 1.59 |
Full-time law enforcement employees in 2020, including police officers: 373 (288 officers - 257 male; 31 female).
| Officers per 1,000 residents here: | 1.25 |
| Idaho average: | 1.65 |
Full-time law enforcement employees in 2019, including police officers: 385 (298 officers - 263 male; 35 female).
| Officers per 1,000 residents here: | 1.29 |
| Idaho average: | 1.69 |
Full-time law enforcement employees in 2018, including police officers: 376 (292 officers - 260 male; 32 female).
| Officers per 1,000 residents here: | 1.27 |
| Idaho average: | 1.65 |
Full-time law enforcement employees in 2017, including police officers: 375 (290 officers - 258 male; 32 female).
| Officers per 1,000 residents here: | 1.29 |
| Idaho average: | 1.66 |
Full-time law enforcement employees in 2016, including police officers: 363 (272 officers - 240 male; 32 female).
| Officers per 1,000 residents here: | 1.23 |
| Idaho average: | 1.68 |
Full-time law enforcement employees in 2015, including police officers: 361 (275 officers - 244 male; 31 female).
| Officers per 1,000 residents here: | 1.26 |
| Idaho average: | 1.68 |
Full-time law enforcement employees in 2014, including police officers: 356 (259 officers - 234 male; 25 female).
| Officers per 1,000 residents here: | 1.20 |
| Idaho average: | 1.67 |
Full-time law enforcement employees in 2013, including police officers: 366 (280 officers - 257 male; 23 female).
| Officers per 1,000 residents here: | 1.31 |
| Idaho average: | 1.68 |
Full-time law enforcement employees in 2012, including police officers: 363 (283 officers - 258 male; 25 female).
| Officers per 1,000 residents here: | 1.34 |
| Idaho average: | 1.74 |
Full-time law enforcement employees in 2011, including police officers: 353 (292 officers - 268 male; 24 female).
| Officers per 1,000 residents here: | 1.40 |
| Idaho average: | 1.75 |
Full-time law enforcement employees in 2010, including police officers: 364 (296 officers - 269 male; 27 female).
| Officers per 1,000 residents here: | 1.44 |
| Idaho average: | 1.78 |
Full-time law enforcement employees in 2009, including police officers: 358 (288 officers - 263 male; 25 female).
| Officers per 1,000 residents here: | 1.40 |
| Idaho average: | 1.74 |
Full-time law enforcement employees in 2008, including police officers: 375 (302 officers - 277 male; 25 female).
| Officers per 1,000 residents here: | 1.48 |
| Idaho average: | 1.77 |
Full-time law enforcement employees in 2007, including police officers: 378 (306 officers - 283 male; 23 female).
| Officers per 1,000 residents here: | 1.54 |
| Idaho average: | 1.78 |
Full-time law enforcement employees in 2006, including police officers: 344 (268 officers - 248 male; 20 female).
| Officers per 1,000 residents here: | 1.35 |
| Idaho average: | 1.77 |
Full-time law enforcement employees in 2005, including police officers: 337 (267 officers - 247 male; 20 female).
| Officers per 1,000 residents here: | 1.37 |
| Idaho average: | 1.77 |
Full-time law enforcement employees in 2004, including police officers: 351 (268 officers - 248 male; 20 female).
| Officers per 1,000 residents here: | 1.38 |
| Idaho average: | 1.76 |
Full-time law enforcement employees in 2003, including police officers: 342 (269 officers - 250 male; 19 female).
| Officers per 1,000 residents here: | 1.39 |
| Idaho average: | 1.80 |

Zip codes: 83616, 83634, 83642, 83646, 83702, 83703, 83704, 83705, 83706, 83709, 83712, 83713, 83714, 83716.