Crime rate in Columbia, Missouri (MO): murders, rapes, robberies, assaults, burglaries, thefts, auto thefts, arson, law enforcement employees, police officers, crime map
Crime rate in Columbia, MO
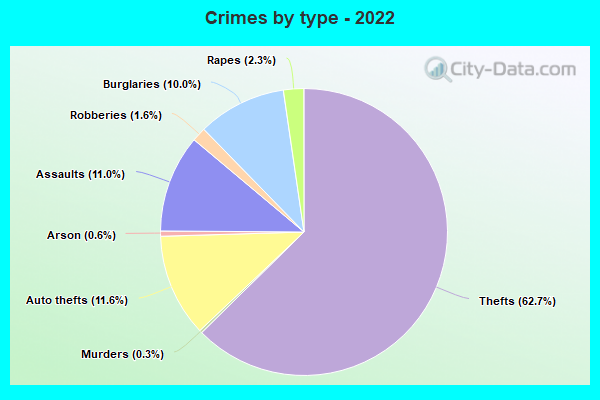
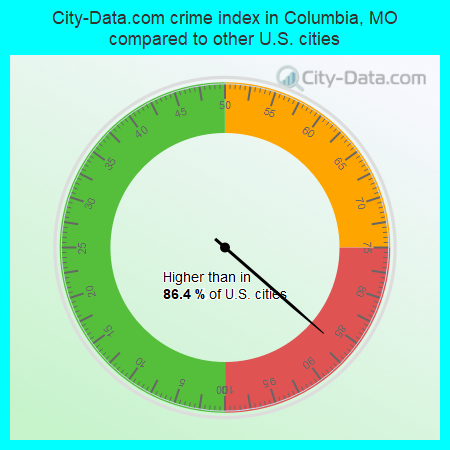
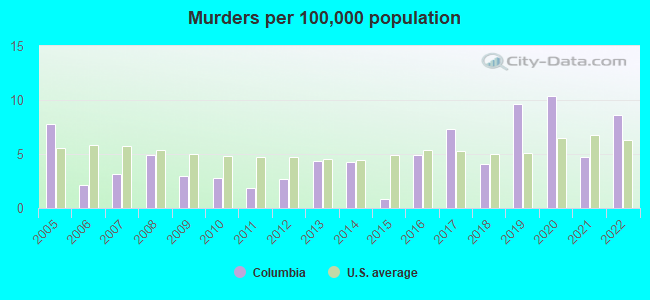
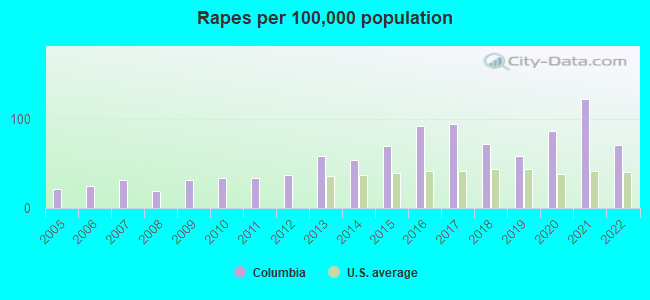
The 2022 crime rate in Columbia, MO is 286 (City-Data.com crime index), which is comparable to the U.S. average. It was higher than in 86.4% U.S. cities. The 2022 Columbia crime rate fell by 7% compared to 2021. The number of homicides stood at 11 - an increase of 5 compared to 2021. In the last 5 years Columbia has seen rise of violent crime and decline of property crime.See how dangerous Columbia, MO is compared to the nearest cities:
(Note: Higher means more crime)
(Note: Higher means more crime)
| Columbia: | 285.8 |
| Ashland: | 85.5 |
| Hallsville: | 15.4 |
| Sturgeon: | 70.5 |
| Centralia: | 94.1 |
| Fulton: | 155.3 |
| Boonville: | 177.6 |
| Fayette: | 118.2 |
| Holts Summit: | 46.4 |
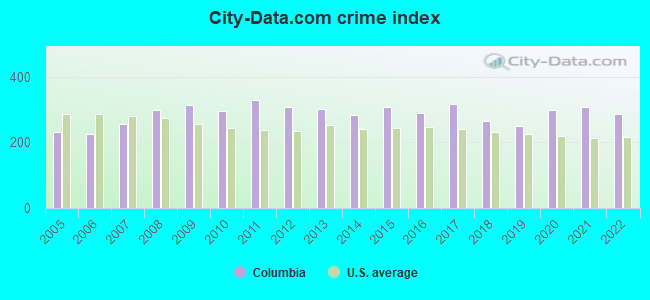
The City-Data.com crime index weighs serious crimes and violent crimes more heavily. Higher means more crime, U.S. average is 246.1. It adjusts for the number of visitors and daily workers commuting into cities.
- means the value is smaller than the state average.- means the value is about the same as the state average.
- means the value is bigger than the state average.
- means the value is much bigger than the state average.
According to our research of Missouri and other state lists, there were 321 registered sex offenders living in Columbia, Missouri as of April 24, 2024.
The ratio of all residents to sex offenders in Columbia is 367 to 1.
The ratio of registered sex offenders to all residents in this city is near the state average.
Violent crime rate in 2022
| Columbia: | 284.3 |
| U.S. Average: | 219.8 |
Violent crime rate in 2021
| Columbia: | 323.1 |
| U.S. Average: | 224.8 |
Violent crime rate in 2020
| Columbia: | 286.8 |
| U.S. Average: | 228.2 |
Violent crime rate in 2019
| Columbia: | 204.8 |
| U.S. Average: | 219.9 |
Violent crime rate in 2018
| Columbia: | 222.5 |
| U.S. Average: | 221.2 |
Violent crime rate in 2017
| Columbia: | 306.7 |
| U.S. Average: | 226.2 |
Violent crime rate in 2016
| Columbia: | 266.6 |
| U.S. Average: | 227.3 |
Violent crime rate in 2015
| Columbia: | 288.0 |
| U.S. Average: | 219.3 |
Violent crime rate in 2014
| Columbia: | 208.8 |
| U.S. Average: | 211.1 |
Violent crime rate in 2013
| Columbia: | 217.3 |
| U.S. Average: | 214.2 |
Violent crime rate in 2012
| Columbia: | 237.7 |
| U.S. Average: | 187.4 |
Violent crime rate in 2011
| Columbia: | 287.0 |
| U.S. Average: | 187.1 |
Violent crime rate in 2010
| Columbia: | 265.4 |
| U.S. Average: | 195.7 |
Violent crime rate in 2009
| Columbia: | 264.2 |
| U.S. Average: | 208.9 |
Violent crime rate in 2008
| Columbia: | 210.8 |
| U.S. Average: | 222.5 |
Violent crime rate in 2007
| Columbia: | 262.4 |
| U.S. Average: | 229.1 |
Violent crime rate in 2006
| Columbia: | 202.2 |
| U.S. Average: | 232.6 |
Violent crime rate in 2005
| Columbia: | 218.9 |
| U.S. Average: | 227.0 |
Property crime rate in 2022
| Columbia: | 213.2 |
| U.S. Average: | 166.5 |
Property crime rate in 2021
| Columbia: | 199.9 |
| U.S. Average: | 157.8 |
Property crime rate in 2020
| Columbia: | 219.1 |
| U.S. Average: | 169.6 |
Property crime rate in 2019
| Columbia: | 215.8 |
| U.S. Average: | 179.7 |
Property crime rate in 2018
| Columbia: | 230.7 |
| U.S. Average: | 190.2 |
Property crime rate in 2017
| Columbia: | 230.2 |
| U.S. Average: | 206.4 |
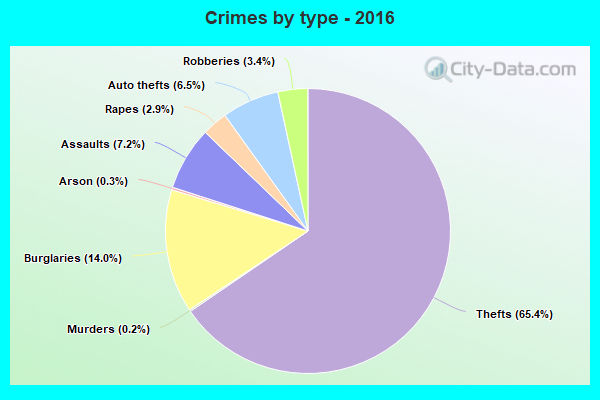
Property crime rate in 2016
| Columbia: | 219.9 |
| U.S. Average: | 216.6 |
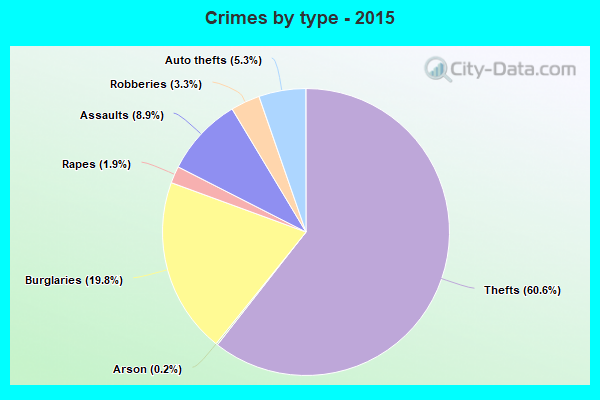
Property crime rate in 2015
| Columbia: | 277.7 |
| U.S. Average: | 221.5 |
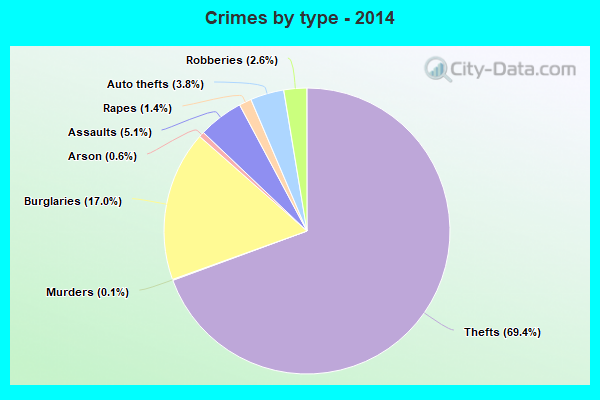
Property crime rate in 2014
| Columbia: | 281.4 |
| U.S. Average: | 230.8 |
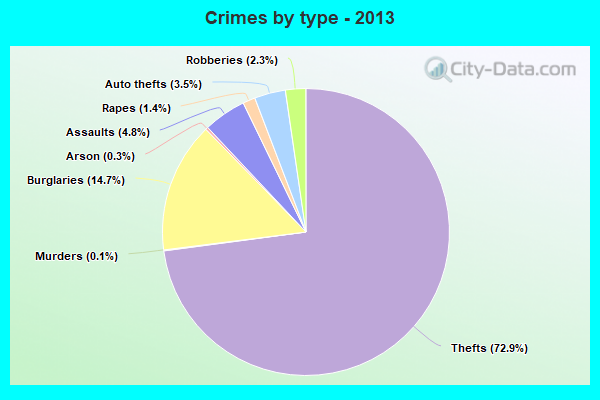
Property crime rate in 2013
| Columbia: | 296.7 |
| U.S. Average: | 250.4 |
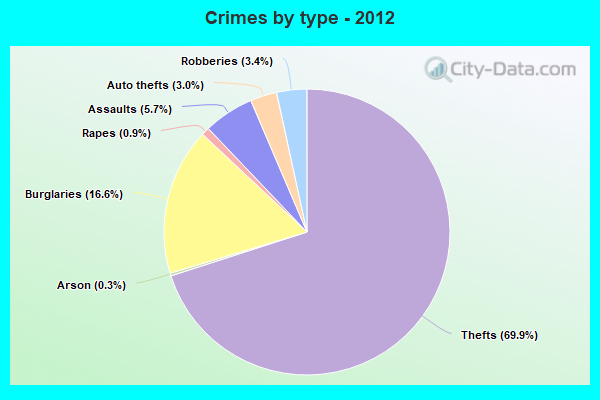
Property crime rate in 2012
| Columbia: | 310.0 |
| U.S. Average: | 267.3 |
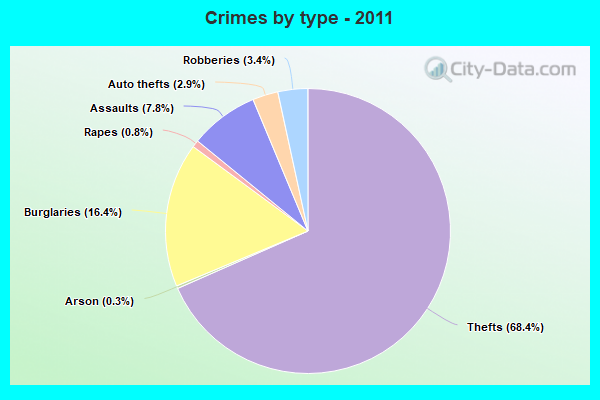
Property crime rate in 2011
| Columbia: | 318.7 |
| U.S. Average: | 273.5 |
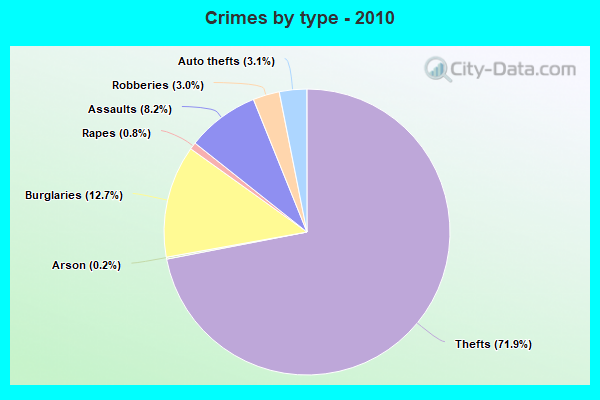
Property crime rate in 2010
| Columbia: | 264.6 |
| U.S. Average: | 276.4 |
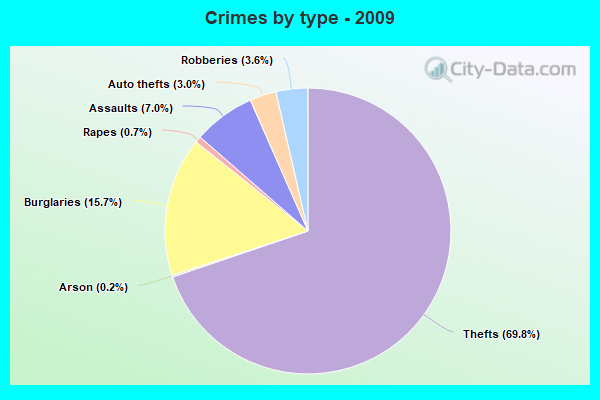
Property crime rate in 2009
| Columbia: | 304.4 |
| U.S. Average: | 285.6 |
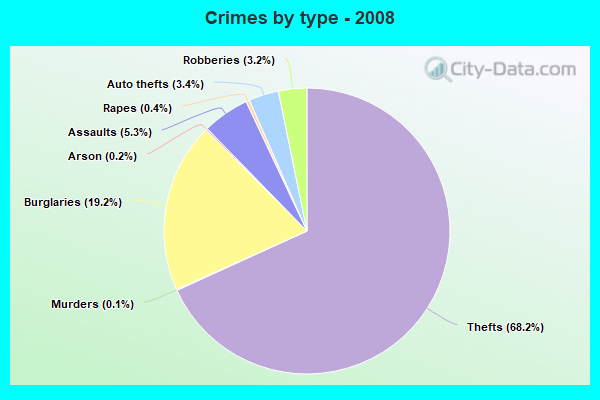
Property crime rate in 2008
| Columbia: | 334.2 |
| U.S. Average: | 302.2 |
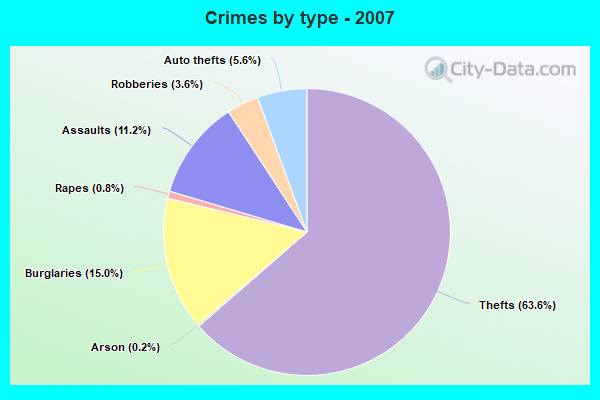
Property crime rate in 2007
| Columbia: | 221.8 |
| U.S. Average: | 309.2 |
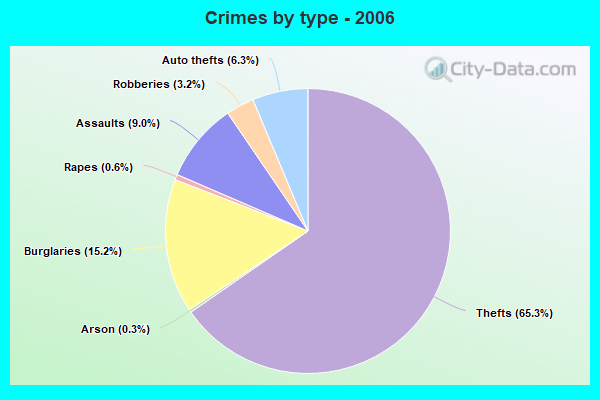
Property crime rate in 2006
| Columbia: | 214.6 |
| U.S. Average: | 317.3 |
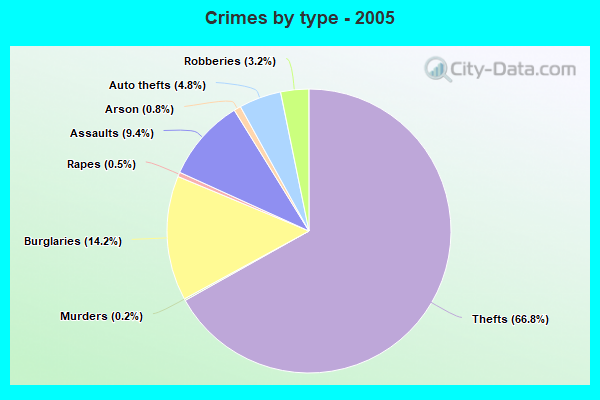
Property crime rate in 2005
| Columbia: | 208.7 |
| U.S. Average: | 322.3 |

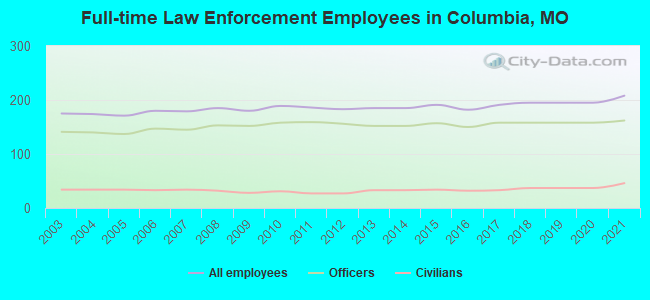
Full-time law enforcement employees in 2021, including police officers: 208 (162 officers - 145 male; 17 female).
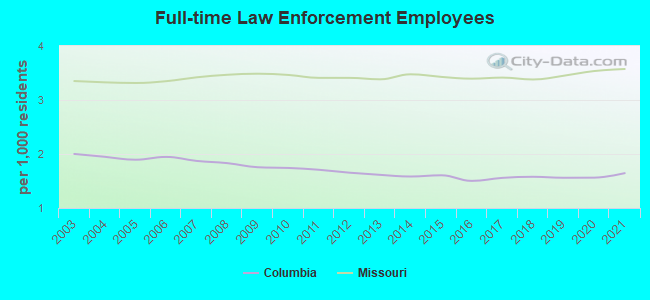
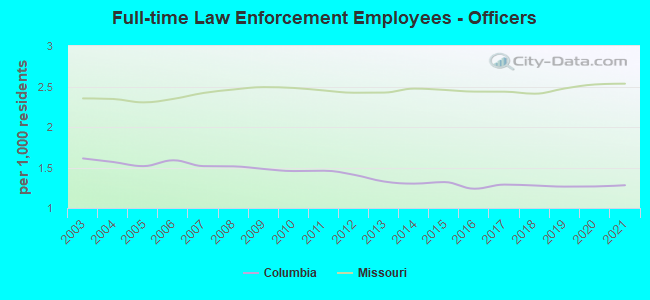
| Officers per 1,000 residents here: | 1.28 |
| Missouri average: | 2.54 |
Full-time law enforcement employees in 2020, including police officers: 195 (158 officers - 134 male; 24 female).
| Officers per 1,000 residents here: | 1.27 |
| Missouri average: | 2.53 |
Full-time law enforcement employees in 2019, including police officers: 195 (158 officers - 134 male; 24 female).
| Officers per 1,000 residents here: | 1.26 |
| Missouri average: | 2.48 |
Full-time law enforcement employees in 2018, including police officers: 195 (158 officers - 134 male; 24 female).
| Officers per 1,000 residents here: | 1.28 |
| Missouri average: | 2.41 |
Full-time law enforcement employees in 2017, including police officers: 191 (158 officers - 136 male; 22 female).
| Officers per 1,000 residents here: | 1.29 |
| Missouri average: | 2.44 |
Full-time law enforcement employees in 2016, including police officers: 182 (150 officers - 131 male; 19 female).
| Officers per 1,000 residents here: | 1.24 |
| Missouri average: | 2.44 |
Full-time law enforcement employees in 2015, including police officers: 191 (157 officers - 135 male; 22 female).
| Officers per 1,000 residents here: | 1.32 |
| Missouri average: | 2.46 |
Full-time law enforcement employees in 2014, including police officers: 185 (152 officers - 128 male; 24 female).
| Officers per 1,000 residents here: | 1.30 |
| Missouri average: | 2.47 |
Full-time law enforcement employees in 2013, including police officers: 185 (152 officers - 128 male; 24 female).
| Officers per 1,000 residents here: | 1.33 |
| Missouri average: | 2.42 |
Full-time law enforcement employees in 2012, including police officers: 183 (156 officers - 129 male; 27 female).
| Officers per 1,000 residents here: | 1.41 |
| Missouri average: | 2.42 |
Full-time law enforcement employees in 2011, including police officers: 186 (159 officers - 134 male; 25 female).
| Officers per 1,000 residents here: | 1.46 |
| Missouri average: | 2.45 |
Full-time law enforcement employees in 2010, including police officers: 189 (158 officers - 131 male; 27 female).
| Officers per 1,000 residents here: | 1.46 |
| Missouri average: | 2.48 |
Full-time law enforcement employees in 2009, including police officers: 180 (152 officers - 126 male; 26 female).
| Officers per 1,000 residents here: | 1.48 |
| Missouri average: | 2.49 |
Full-time law enforcement employees in 2008, including police officers: 185 (153 officers - 127 male; 26 female).
| Officers per 1,000 residents here: | 1.51 |
| Missouri average: | 2.46 |
Full-time law enforcement employees in 2007, including police officers: 179 (145 officers - 121 male; 24 female).
| Officers per 1,000 residents here: | 1.52 |
| Missouri average: | 2.42 |
Full-time law enforcement employees in 2006, including police officers: 180 (147 officers - 123 male; 24 female).
| Officers per 1,000 residents here: | 1.59 |
| Missouri average: | 2.35 |
Full-time law enforcement employees in 2005, including police officers: 171 (137 officers - 116 male; 21 female).
| Officers per 1,000 residents here: | 1.52 |
| Missouri average: | 2.30 |
Full-time law enforcement employees in 2004, including police officers: 174 (140 officers - 118 male; 22 female).
| Officers per 1,000 residents here: | 1.57 |
| Missouri average: | 2.35 |
Full-time law enforcement employees in 2003, including police officers: 175 (141 officers - 119 male; 22 female).
| Officers per 1,000 residents here: | 1.61 |
| Missouri average: | 2.35 |