Crime rate in Fargo, North Dakota (ND): murders, rapes, robberies, assaults, burglaries, thefts, auto thefts, arson, law enforcement employees, police officers, crime map
Crime rate in Fargo, ND
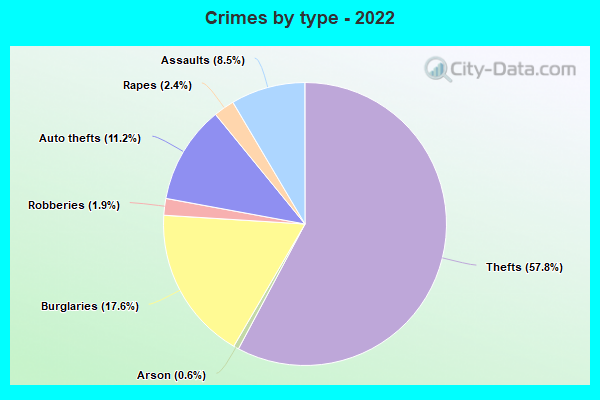
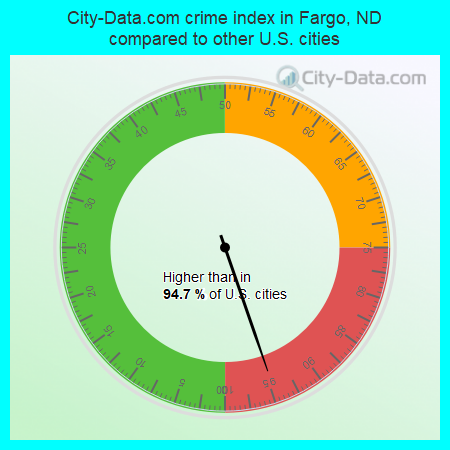
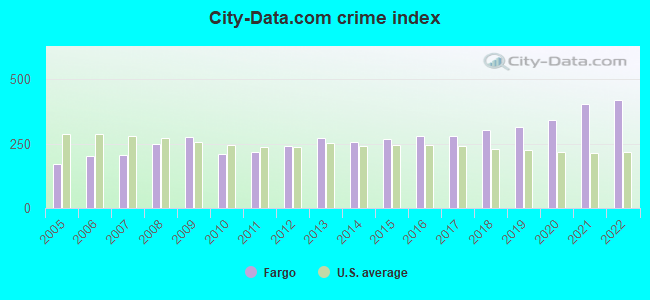
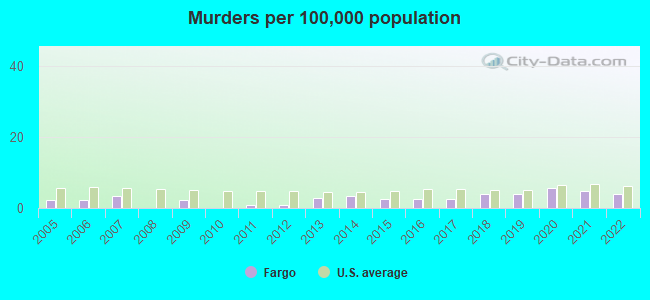
The 2022 crime rate in Fargo, ND is 420 (City-Data.com crime index), which is 1.7 times higher than the U.S. average. It was higher than in 94.7% U.S. cities. The 2022 Fargo crime rate rose by 4% compared to 2021. The number of homicides stood at 5 - a decrease of 1 compared to 2021. In the last 5 years Fargo has seen rise of violent crime and increasing property crime.See how dangerous Fargo, ND is compared to the nearest cities:
(Note: Higher means more crime)
(Note: Higher means more crime)
| Fargo: | 419.8 |
| Moorhead: | 243.5 |
| West Fargo: | 124.7 |
| Dilworth: | 268.0 |
| Glyndon: | 55.6 |
| Hawley: | 101.9 |
| Barnesville: | 8.2 |
| Ada: | 48.2 |
| Lake Park: | 137.3 |
The City-Data.com crime index weighs serious crimes and violent crimes more heavily. Higher means more crime, U.S. average is 246.1. It adjusts for the number of visitors and daily workers commuting into cities.
- means the value is smaller than the state average.- means the value is about the same as the state average.
- means the value is bigger than the state average.
- means the value is much bigger than the state average.
According to our research of North Dakota and other state lists, there were 318 registered sex offenders living in Fargo, North Dakota as of April 24, 2024.
The ratio of all residents to sex offenders in Fargo is 375 to 1.
The ratio of registered sex offenders to all residents in this city is near the state average.
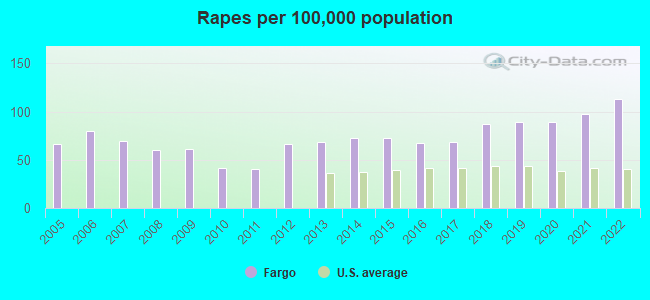
Violent crime rate in 2022
| Fargo: | 370.5 |
| U.S. Average: | 219.8 |
Violent crime rate in 2021
| Fargo: | 315.0 |
| U.S. Average: | 224.8 |
Violent crime rate in 2020
| Fargo: | 285.6 |
| U.S. Average: | 228.2 |
Violent crime rate in 2019
| Fargo: | 278.2 |
| U.S. Average: | 219.9 |
Violent crime rate in 2018
| Fargo: | 260.2 |
| U.S. Average: | 221.2 |
Violent crime rate in 2017
| Fargo: | 239.4 |
| U.S. Average: | 226.2 |
Violent crime rate in 2016
| Fargo: | 231.0 |
| U.S. Average: | 227.3 |
Violent crime rate in 2015
| Fargo: | 219.0 |
| U.S. Average: | 219.3 |
Violent crime rate in 2014
| Fargo: | 220.9 |
| U.S. Average: | 211.1 |
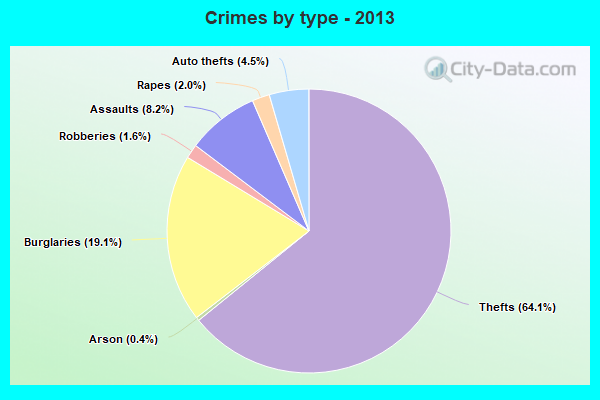
Violent crime rate in 2013
| Fargo: | 234.9 |
| U.S. Average: | 214.2 |
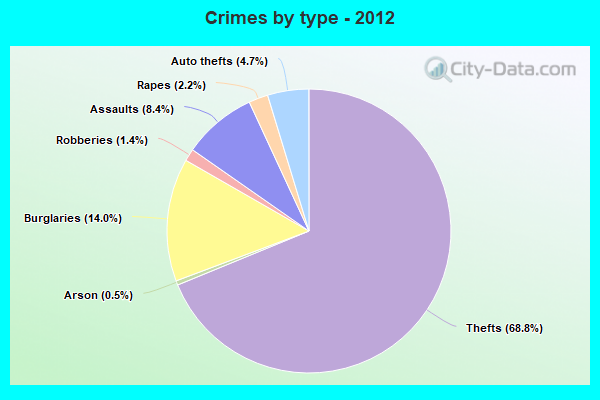
Violent crime rate in 2012
| Fargo: | 214.0 |
| U.S. Average: | 187.4 |
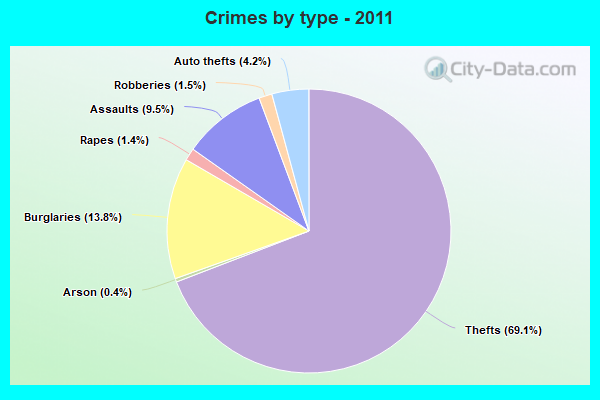
Violent crime rate in 2011
| Fargo: | 200.8 |
| U.S. Average: | 187.1 |
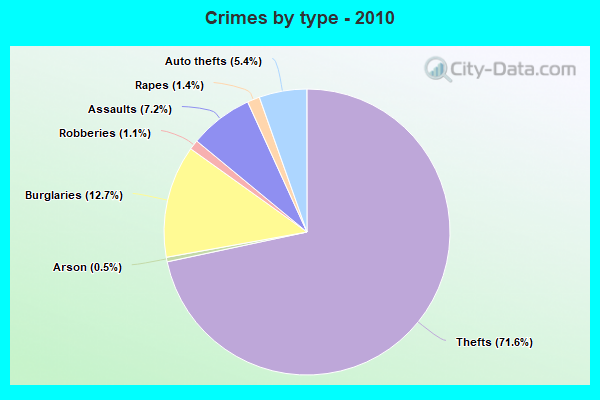
Violent crime rate in 2010
| Fargo: | 163.9 |
| U.S. Average: | 195.7 |
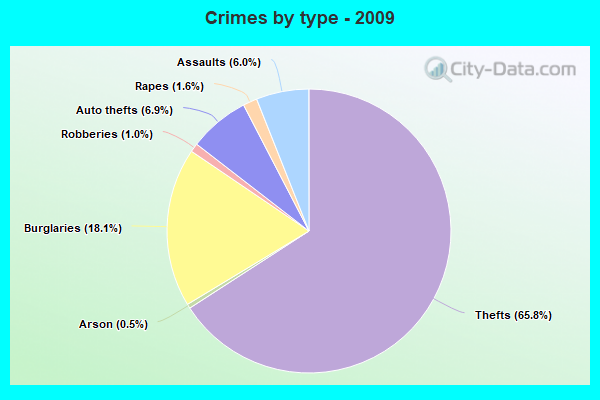
Violent crime rate in 2009
| Fargo: | 197.2 |
| U.S. Average: | 208.9 |
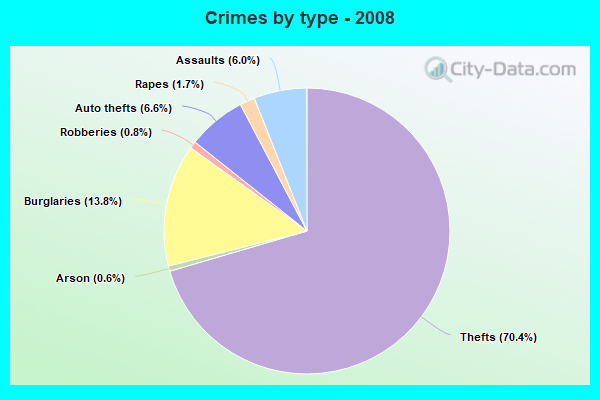
Violent crime rate in 2008
| Fargo: | 179.3 |
| U.S. Average: | 222.5 |
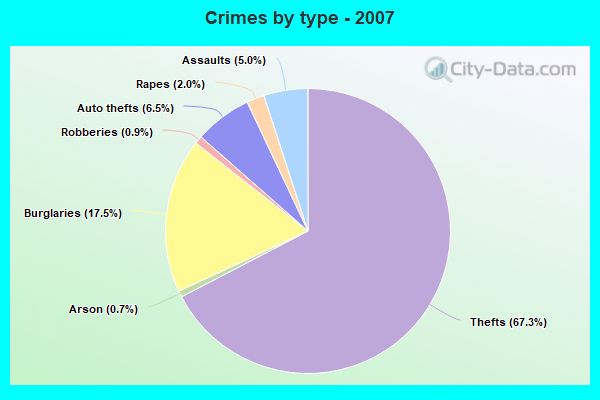
Violent crime rate in 2007
| Fargo: | 140.4 |
| U.S. Average: | 229.1 |
Violent crime rate in 2006
| Fargo: | 139.6 |
| U.S. Average: | 232.6 |
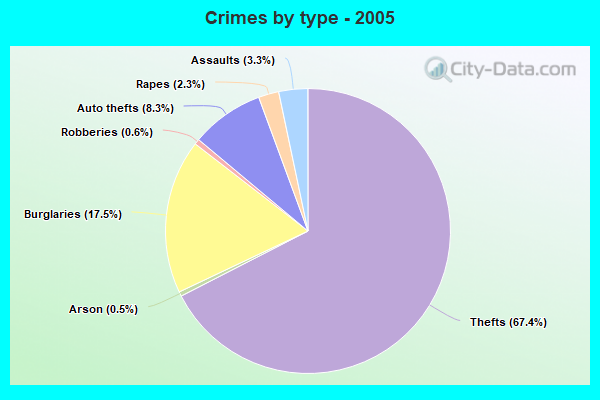
Violent crime rate in 2005
| Fargo: | 102.1 |
| U.S. Average: | 227.0 |
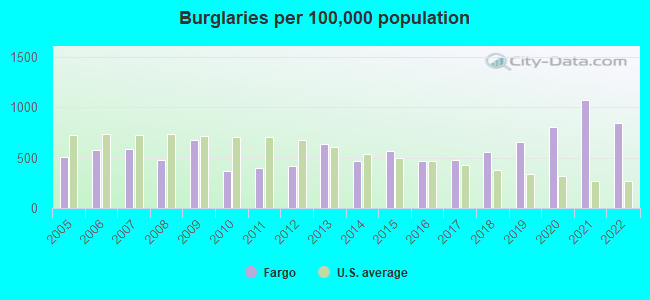
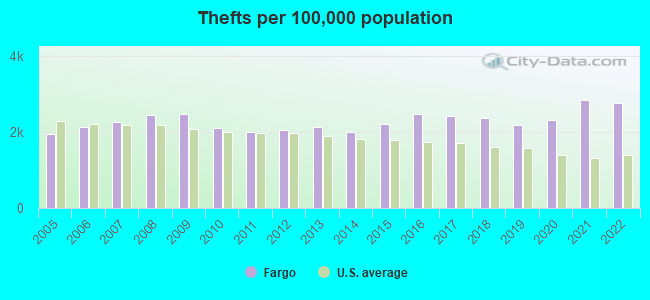
Property crime rate in 2022
| Fargo: | 387.4 |
| U.S. Average: | 166.5 |
Property crime rate in 2021
| Fargo: | 426.4 |
| U.S. Average: | 157.8 |
Property crime rate in 2020
| Fargo: | 331.6 |
| U.S. Average: | 169.6 |
Property crime rate in 2019
| Fargo: | 285.7 |
| U.S. Average: | 179.7 |
Property crime rate in 2018
| Fargo: | 267.3 |
| U.S. Average: | 190.2 |
Property crime rate in 2017
| Fargo: | 253.9 |
| U.S. Average: | 206.4 |
Property crime rate in 2016
| Fargo: | 255.5 |
| U.S. Average: | 216.6 |
Property crime rate in 2015
| Fargo: | 256.1 |
| U.S. Average: | 221.5 |
Property crime rate in 2014
| Fargo: | 219.7 |
| U.S. Average: | 230.8 |
Property crime rate in 2013
| Fargo: | 255.4 |
| U.S. Average: | 250.4 |
Property crime rate in 2012
| Fargo: | 207.2 |
| U.S. Average: | 267.3 |
Property crime rate in 2011
| Fargo: | 197.0 |
| U.S. Average: | 273.5 |
Property crime rate in 2010
| Fargo: | 202.5 |
| U.S. Average: | 276.4 |
Property crime rate in 2009
| Fargo: | 298.8 |
| U.S. Average: | 285.6 |
Property crime rate in 2008
| Fargo: | 251.4 |
| U.S. Average: | 302.2 |
Property crime rate in 2007
| Fargo: | 213.2 |
| U.S. Average: | 309.2 |
Property crime rate in 2006
| Fargo: | 209.9 |
| U.S. Average: | 317.3 |
Property crime rate in 2005
| Fargo: | 188.5 |
| U.S. Average: | 322.3 |

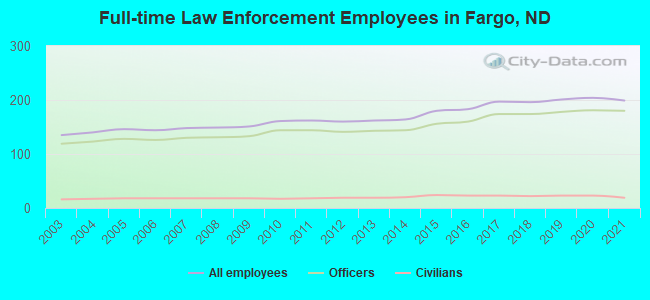
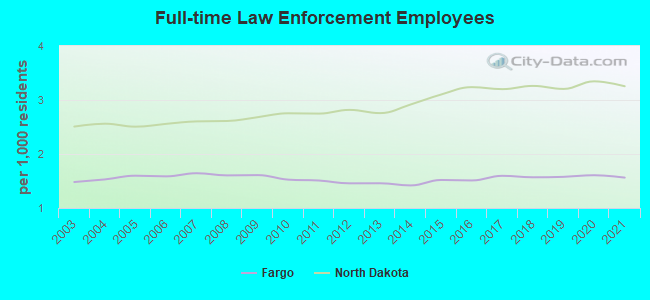
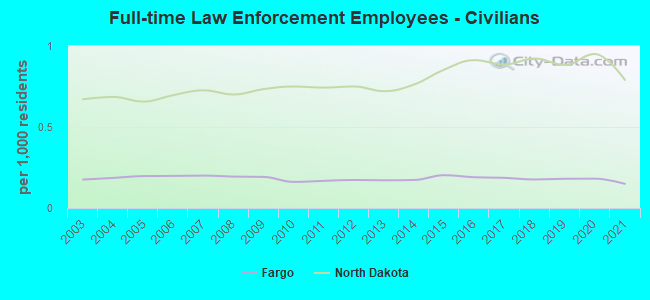
Full-time law enforcement employees in 2021, including police officers: 199 (180 officers - 155 male; 25 female).
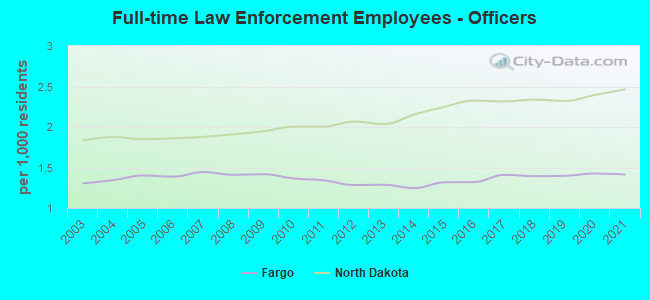
| Officers per 1,000 residents here: | 1.41 |
| North Dakota average: | 2.46 |
Full-time law enforcement employees in 2020, including police officers: 204 (181 officers - 157 male; 24 female).
| Officers per 1,000 residents here: | 1.43 |
| North Dakota average: | 2.40 |
Full-time law enforcement employees in 2019, including police officers: 201 (178 officers - 155 male; 23 female).
| Officers per 1,000 residents here: | 1.40 |
| North Dakota average: | 2.32 |
Full-time law enforcement employees in 2018, including police officers: 196 (174 officers - 151 male; 23 female).
| Officers per 1,000 residents here: | 1.39 |
| North Dakota average: | 2.34 |
Full-time law enforcement employees in 2017, including police officers: 197 (174 officers - 149 male; 25 female).
| Officers per 1,000 residents here: | 1.41 |
| North Dakota average: | 2.32 |
Full-time law enforcement employees in 2016, including police officers: 183 (160 officers - 140 male; 20 female).
| Officers per 1,000 residents here: | 1.32 |
| North Dakota average: | 2.33 |
Full-time law enforcement employees in 2015, including police officers: 180 (156 officers - 135 male; 21 female).
| Officers per 1,000 residents here: | 1.32 |
| North Dakota average: | 2.25 |
Full-time law enforcement employees in 2014, including police officers: 164 (144 officers - 123 male; 21 female).
| Officers per 1,000 residents here: | 1.24 |
| North Dakota average: | 2.15 |
Full-time law enforcement employees in 2013, including police officers: 162 (143 officers - 120 male; 23 female).
| Officers per 1,000 residents here: | 1.29 |
| North Dakota average: | 2.04 |
Full-time law enforcement employees in 2012, including police officers: 160 (141 officers - 120 male; 21 female).
| Officers per 1,000 residents here: | 1.28 |
| North Dakota average: | 2.07 |
Full-time law enforcement employees in 2011, including police officers: 162 (144 officers - 118 male; 26 female).
| Officers per 1,000 residents here: | 1.34 |
| North Dakota average: | 2.01 |
Full-time law enforcement employees in 2010, including police officers: 161 (144 officers - 121 male; 23 female).
| Officers per 1,000 residents here: | 1.36 |
| North Dakota average: | 2.00 |
Full-time law enforcement employees in 2009, including police officers: 151 (133 officers - 112 male; 21 female).
| Officers per 1,000 residents here: | 1.42 |
| North Dakota average: | 1.95 |
Full-time law enforcement employees in 2008, including police officers: 149 (131 officers - 108 male; 23 female).
| Officers per 1,000 residents here: | 1.41 |
| North Dakota average: | 1.91 |
Full-time law enforcement employees in 2007, including police officers: 148 (130 officers - 109 male; 21 female).
| Officers per 1,000 residents here: | 1.44 |
| North Dakota average: | 1.88 |
Full-time law enforcement employees in 2006, including police officers: 144 (126 officers - 106 male; 20 female).
| Officers per 1,000 residents here: | 1.39 |
| North Dakota average: | 1.86 |
Full-time law enforcement employees in 2005, including police officers: 146 (128 officers - 109 male; 19 female).
| Officers per 1,000 residents here: | 1.40 |
| North Dakota average: | 1.85 |
Full-time law enforcement employees in 2004, including police officers: 140 (123 officers - 107 male; 16 female).
| Officers per 1,000 residents here: | 1.34 |
| North Dakota average: | 1.88 |
Full-time law enforcement employees in 2003, including police officers: 135 (119 officers - 102 male; 17 female).
| Officers per 1,000 residents here: | 1.31 |
| North Dakota average: | 1.84 |