Crime rate in Hamilton, Ohio (OH): murders, rapes, robberies, assaults, burglaries, thefts, auto thefts, arson, law enforcement employees, police officers, crime map
Crime rate in Hamilton, OH
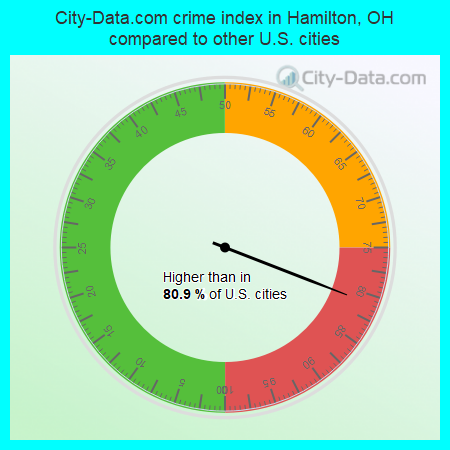
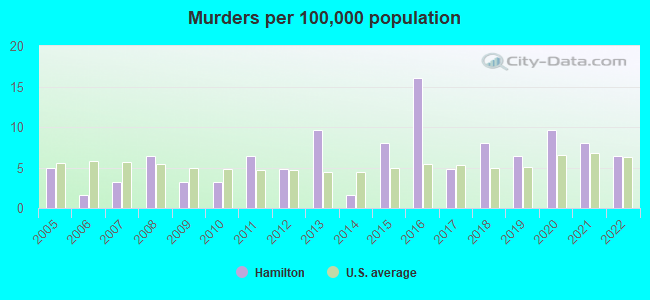
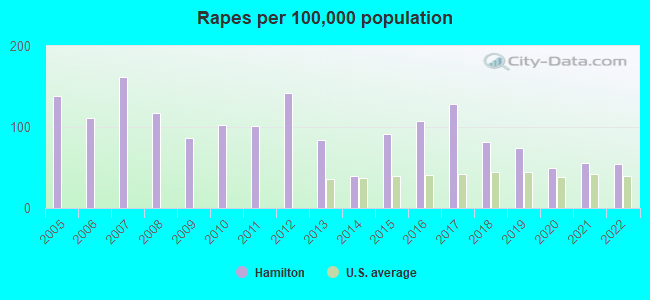
The 2022 crime rate in Hamilton, OH is 236 (City-Data.com crime index), which is comparable to the U.S. average. It was higher than in 80.9% U.S. cities. The 2022 Hamilton crime rate fell by 35% compared to 2021. The number of homicides stood at 4 - a decrease of 1 compared to 2021. In the last 5 years Hamilton has seen decline of violent crime and decreasing property crime.See how dangerous Hamilton, OH is compared to the nearest cities:
(Note: Higher means more crime)
(Note: Higher means more crime)
| Hamilton: | 236.4 |
| New Miami: | 6.8 |
| Fairfield: | 44.9 |
| Ross: | 41.1 |
| Forest Park: | 212.2 |
| Trenton: | 130.6 |
| Springdale: | 1.5 |
| Greenhills: | 109.9 |
| Glendale: | 15.4 |
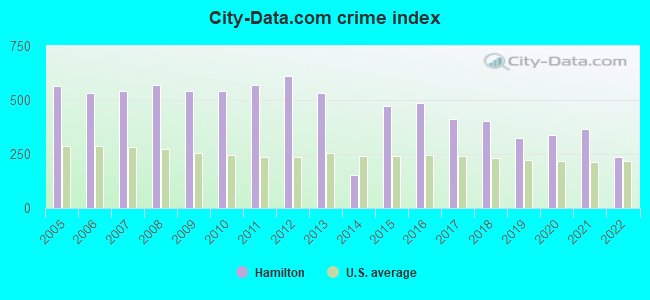
The City-Data.com crime index weighs serious crimes and violent crimes more heavily. Higher means more crime, U.S. average is 246.1. It adjusts for the number of visitors and daily workers commuting into cities.
- means the value is smaller than the state average.- means the value is about the same as the state average.
- means the value is bigger than the state average.
- means the value is much bigger than the state average.
According to our research of Ohio and other state lists, there were 172 registered sex offenders living in Hamilton, Ohio as of April 23, 2024.
The ratio of all residents to sex offenders in Hamilton is 366 to 1.
Violent crime rate in 2022
| Hamilton: | 228.7 |
| U.S. Average: | 219.8 |
Violent crime rate in 2021
| Hamilton: | 421.7 |
| U.S. Average: | 224.8 |
Violent crime rate in 2020
| Hamilton: | 357.8 |
| U.S. Average: | 228.2 |
Violent crime rate in 2019
| Hamilton: | 264.7 |
| U.S. Average: | 219.9 |
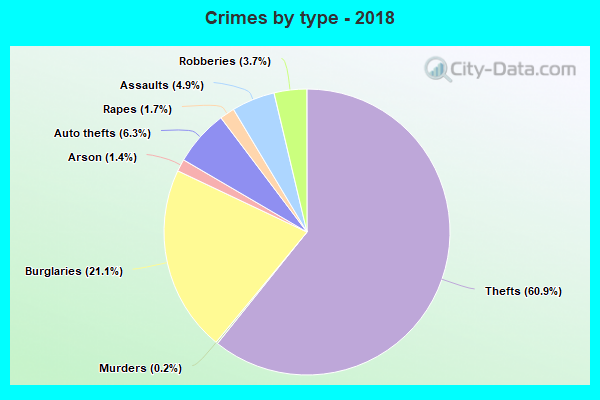
Violent crime rate in 2018
| Hamilton: | 311.0 |
| U.S. Average: | 221.2 |
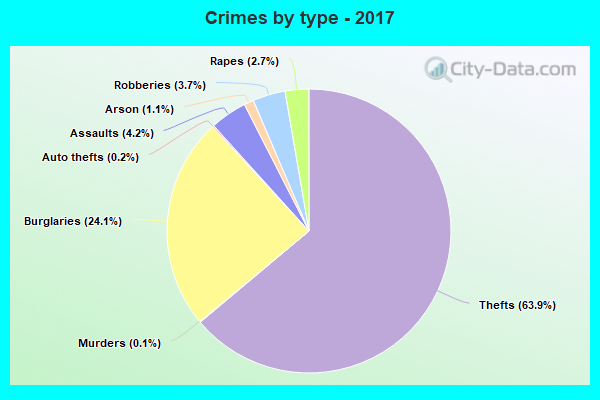
Violent crime rate in 2017
| Hamilton: | 327.7 |
| U.S. Average: | 226.2 |
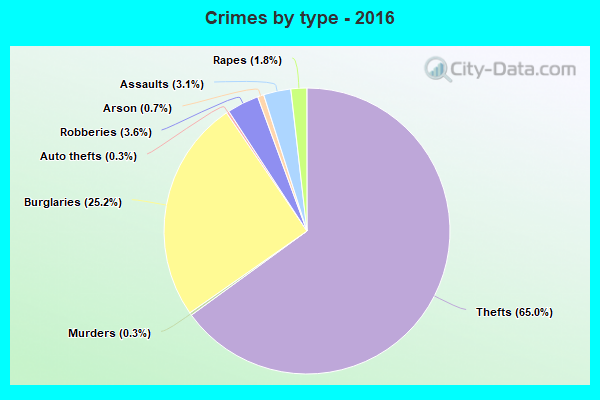
Violent crime rate in 2016
| Hamilton: | 340.4 |
| U.S. Average: | 227.3 |
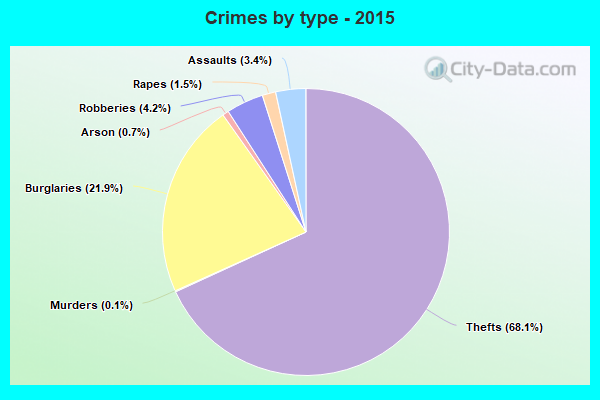
Violent crime rate in 2015
| Hamilton: | 341.5 |
| U.S. Average: | 219.3 |
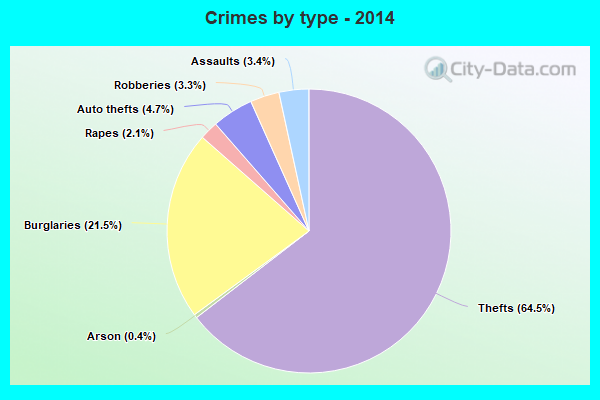
Violent crime rate in 2014
| Hamilton: | 106.8 |
| U.S. Average: | 211.1 |
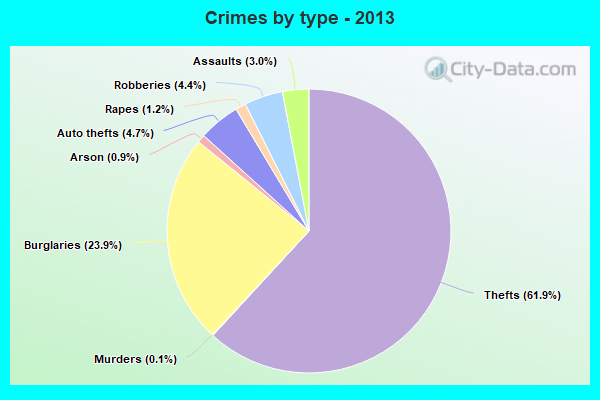
Violent crime rate in 2013
| Hamilton: | 359.7 |
| U.S. Average: | 214.2 |
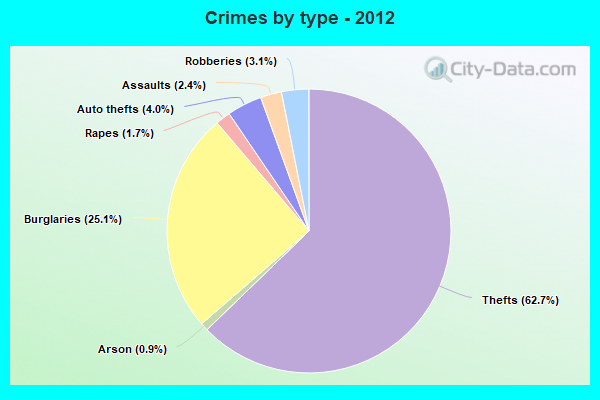
Violent crime rate in 2012
| Hamilton: | 374.3 |
| U.S. Average: | 187.4 |
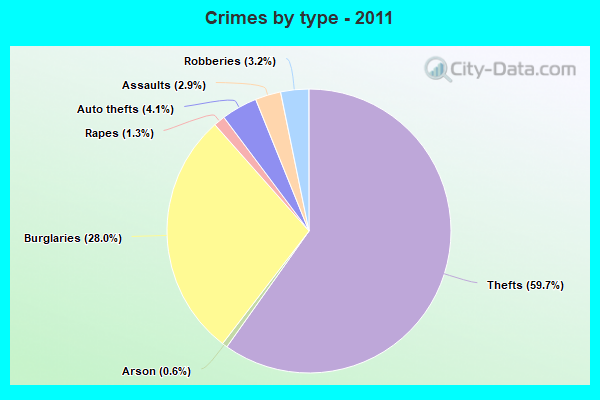
Violent crime rate in 2011
| Hamilton: | 346.3 |
| U.S. Average: | 187.1 |
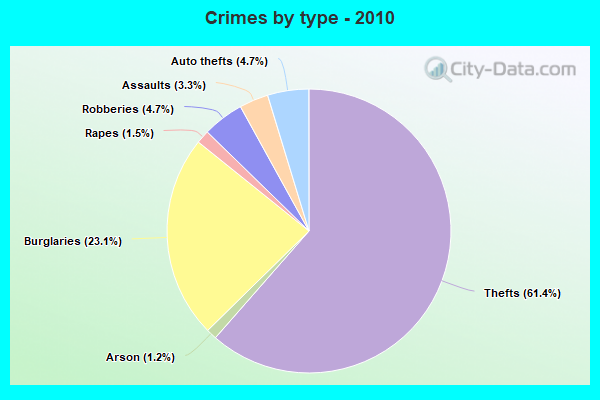
Violent crime rate in 2010
| Hamilton: | 387.3 |
| U.S. Average: | 195.7 |
Violent crime rate in 2009
| Hamilton: | 373.3 |
| U.S. Average: | 208.9 |
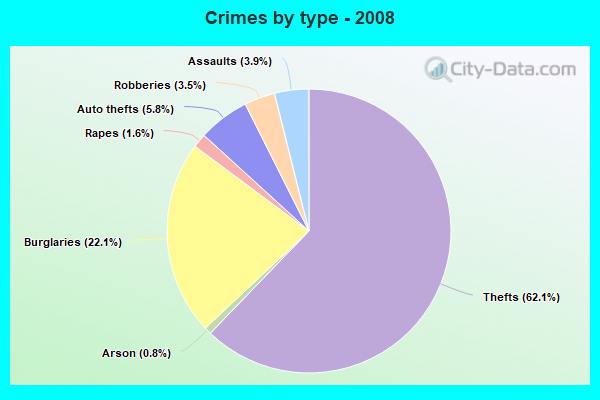
Violent crime rate in 2008
| Hamilton: | 399.2 |
| U.S. Average: | 222.5 |
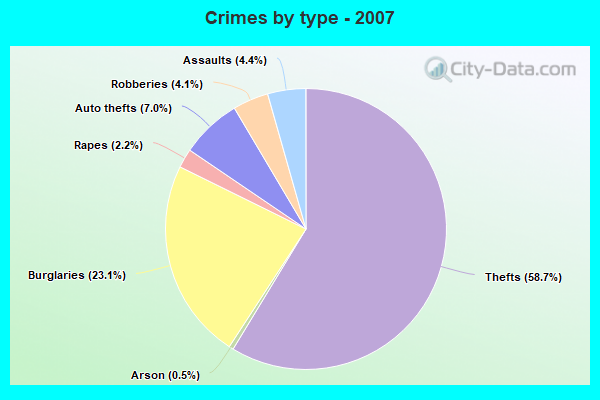
Violent crime rate in 2007
| Hamilton: | 415.8 |
| U.S. Average: | 229.1 |
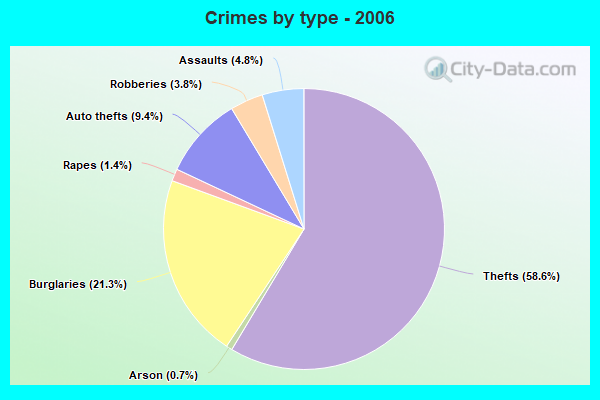
Violent crime rate in 2006
| Hamilton: | 389.0 |
| U.S. Average: | 232.6 |
Violent crime rate in 2005
| Hamilton: | 414.2 |
| U.S. Average: | 227.0 |
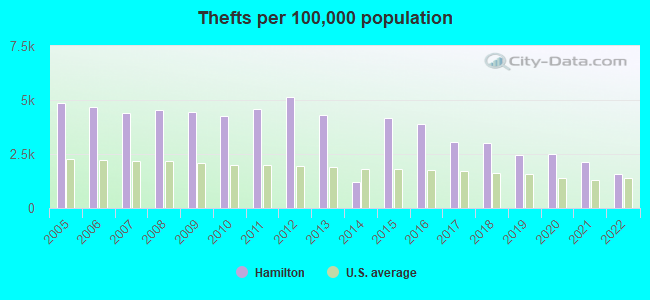
Property crime rate in 2022
| Hamilton: | 191.8 |
| U.S. Average: | 166.5 |
Property crime rate in 2021
| Hamilton: | 272.3 |
| U.S. Average: | 157.8 |
Property crime rate in 2020
| Hamilton: | 271.5 |
| U.S. Average: | 169.6 |
Property crime rate in 2019
| Hamilton: | 305.0 |
| U.S. Average: | 179.7 |
Property crime rate in 2018
| Hamilton: | 405.7 |
| U.S. Average: | 190.2 |
Property crime rate in 2017
| Hamilton: | 385.9 |
| U.S. Average: | 206.4 |
Property crime rate in 2016
| Hamilton: | 501.3 |
| U.S. Average: | 216.6 |
Property crime rate in 2015
| Hamilton: | 477.6 |
| U.S. Average: | 221.5 |
Property crime rate in 2014
| Hamilton: | 155.0 |
| U.S. Average: | 230.8 |
Property crime rate in 2013
| Hamilton: | 597.2 |
| U.S. Average: | 250.4 |
Property crime rate in 2012
| Hamilton: | 716.0 |
| U.S. Average: | 267.3 |
Property crime rate in 2011
| Hamilton: | 704.2 |
| U.S. Average: | 273.5 |
Property crime rate in 2010
| Hamilton: | 582.3 |
| U.S. Average: | 276.4 |
Property crime rate in 2009
| Hamilton: | 607.0 |
| U.S. Average: | 285.6 |
Property crime rate in 2008
| Hamilton: | 612.7 |
| U.S. Average: | 302.2 |
Property crime rate in 2007
| Hamilton: | 548.8 |
| U.S. Average: | 309.2 |
Property crime rate in 2006
| Hamilton: | 583.6 |
| U.S. Average: | 317.3 |
Property crime rate in 2005
| Hamilton: | 588.7 |
| U.S. Average: | 322.3 |
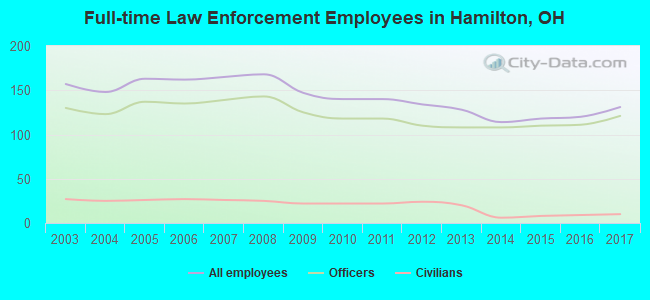
Full-time law enforcement employees in 2017, including police officers: 131 (121 officers - 111 male; 10 female).
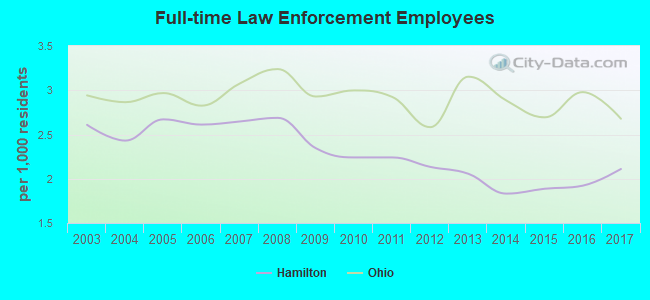
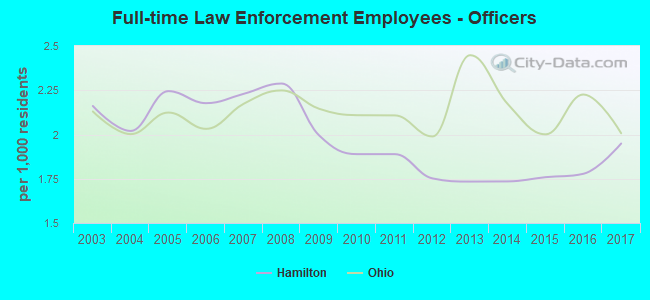
| Officers per 1,000 residents here: | 1.95 |
| Ohio average: | 2.01 |
Full-time law enforcement employees in 2016, including police officers: 120 (111 officers - 101 male; 10 female).
| Officers per 1,000 residents here: | 1.78 |
| Ohio average: | 2.23 |
Full-time law enforcement employees in 2015, including police officers: 118 (110 officers - 103 male; 7 female).
| Officers per 1,000 residents here: | 1.76 |
| Ohio average: | 2.00 |
Full-time law enforcement employees in 2014, including police officers: 114 (108 officers - 103 male; 5 female).
| Officers per 1,000 residents here: | 1.74 |
| Ohio average: | 2.17 |
Full-time law enforcement employees in 2013, including police officers: 128 (108 officers - 103 male; 5 female).
| Officers per 1,000 residents here: | 1.73 |
| Ohio average: | 2.45 |
Full-time law enforcement employees in 2012, including police officers: 134 (110 officers - 105 male; 5 female).
| Officers per 1,000 residents here: | 1.75 |
| Ohio average: | 1.99 |
Full-time law enforcement employees in 2010, including police officers: 140 (118 officers - 111 male; 7 female).
| Officers per 1,000 residents here: | 1.89 |
| Ohio average: | 2.11 |
Full-time law enforcement employees in 2009, including police officers: 147 (125 officers - 118 male; 7 female).
| Officers per 1,000 residents here: | 1.99 |
| Ohio average: | 2.15 |
Full-time law enforcement employees in 2008, including police officers: 168 (143 officers - 136 male; 7 female).
| Officers per 1,000 residents here: | 2.29 |
| Ohio average: | 2.25 |
Full-time law enforcement employees in 2007, including police officers: 165 (139 officers - 130 male; 9 female).
| Officers per 1,000 residents here: | 2.23 |
| Ohio average: | 2.17 |
Full-time law enforcement employees in 2006, including police officers: 162 (135 officers - 126 male; 9 female).
| Officers per 1,000 residents here: | 2.18 |
| Ohio average: | 2.03 |
Full-time law enforcement employees in 2005, including police officers: 163 (137 officers - 130 male; 7 female).
| Officers per 1,000 residents here: | 2.25 |
| Ohio average: | 2.12 |
Full-time law enforcement employees in 2004, including police officers: 148 (123 officers - 114 male; 9 female).
| Officers per 1,000 residents here: | 2.02 |
| Ohio average: | 2.00 |
Full-time law enforcement employees in 2003, including police officers: 157 (130 officers - 121 male; 9 female).
| Officers per 1,000 residents here: | 2.16 |
| Ohio average: | 2.13 |