Crime rate in Lakewood, Colorado (CO): murders, rapes, robberies, assaults, burglaries, thefts, auto thefts, arson, law enforcement employees, police officers, crime map
Crime rate in Lakewood, CO
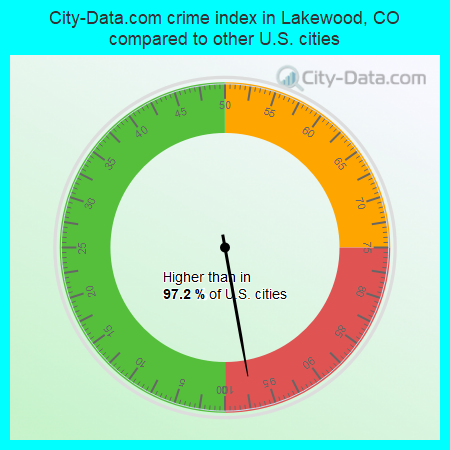
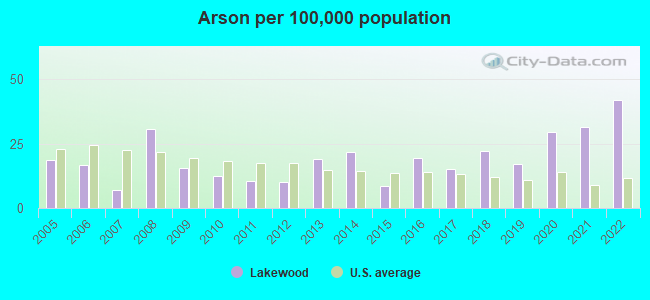
The 2022 crime rate in Lakewood, CO is 525 (City-Data.com crime index), which is 2.1 times greater than the U.S. average. It was higher than in 97.2% U.S. cities. The 2022 Lakewood crime rate rose by 4% compared to 2021. The number of homicides stood at 12. In the last 5 years Lakewood has seen rise of violent crime and increasing property crime.See how dangerous Lakewood, CO is compared to the nearest cities:
(Note: Higher means more crime)
(Note: Higher means more crime)
| Lakewood: | 524.7 |
| Edgewater: | 520.6 |
| Wheat Ridge: | 384.5 |
| Mountain View: | 233.5 |
| Lakeside: | 2,352.9 |
| Sheridan: | 793.6 |
| Bow Mar: | 28.8 |
| Golden: | 249.4 |
| Englewood: | 654.0 |
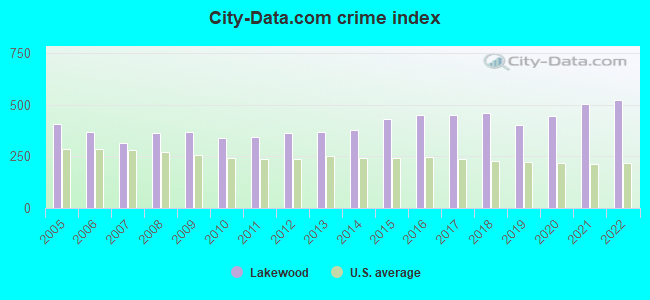
The City-Data.com crime index weighs serious crimes and violent crimes more heavily. Higher means more crime, U.S. average is 246.1. It adjusts for the number of visitors and daily workers commuting into cities.
- means the value is smaller than the state average.- means the value is about the same as the state average.
- means the value is bigger than the state average.
- means the value is much bigger than the state average.
According to our research of Colorado and other state lists, there were 413 registered sex offenders living in Lakewood, Colorado as of April 24, 2024.
The ratio of all residents to sex offenders in Lakewood is 374 to 1.
The ratio of registered sex offenders to all residents in this city is near the state average.
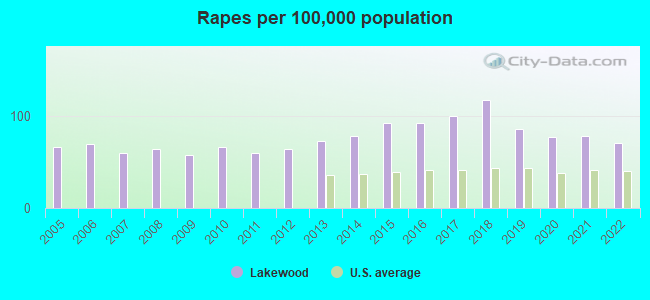
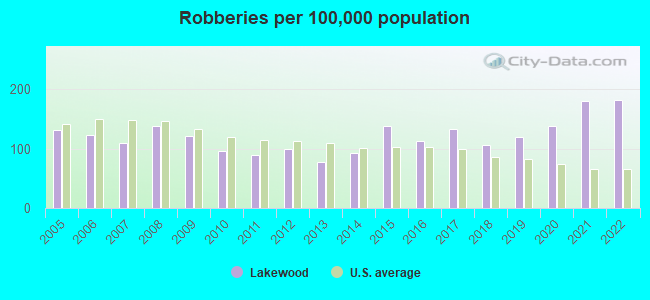
Violent crime rate in 2022
| Lakewood: | 453.6 |
| U.S. Average: | 219.8 |
Violent crime rate in 2021
| Lakewood: | 395.7 |
| U.S. Average: | 224.8 |
Violent crime rate in 2020
| Lakewood: | 336.8 |
| U.S. Average: | 228.2 |
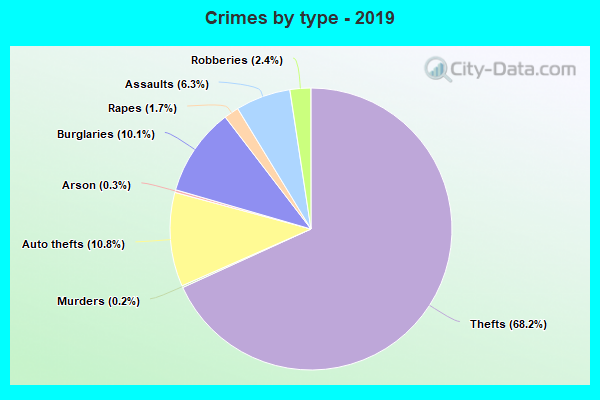
Violent crime rate in 2019
| Lakewood: | 320.8 |
| U.S. Average: | 219.9 |
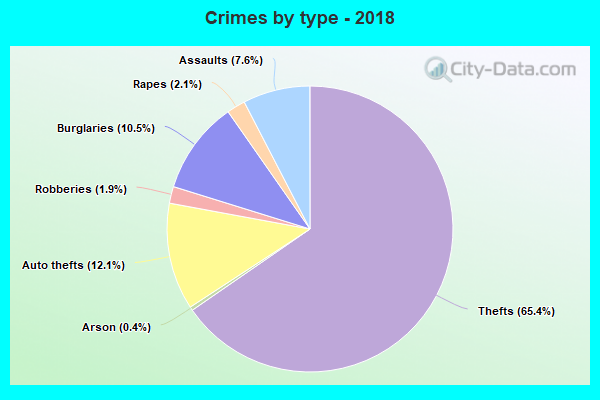
Violent crime rate in 2018
| Lakewood: | 392.3 |
| U.S. Average: | 221.2 |
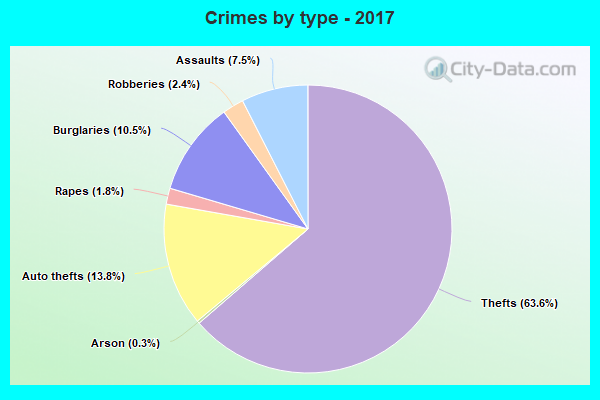
Violent crime rate in 2017
| Lakewood: | 379.6 |
| U.S. Average: | 226.2 |
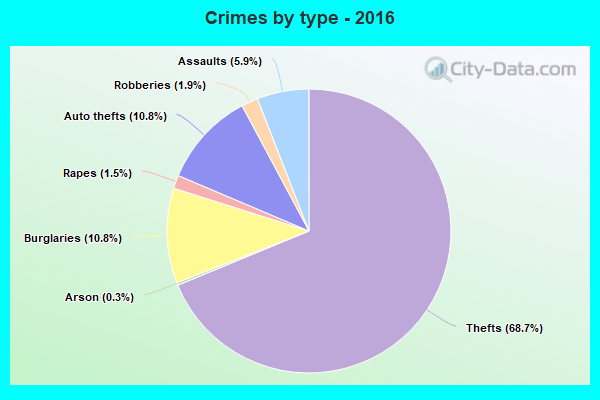
Violent crime rate in 2016
| Lakewood: | 333.5 |
| U.S. Average: | 227.3 |
Violent crime rate in 2015
| Lakewood: | 336.1 |
| U.S. Average: | 219.3 |
Violent crime rate in 2014
| Lakewood: | 285.0 |
| U.S. Average: | 211.1 |
Violent crime rate in 2013
| Lakewood: | 256.0 |
| U.S. Average: | 214.2 |
Violent crime rate in 2012
| Lakewood: | 264.7 |
| U.S. Average: | 187.4 |
Violent crime rate in 2011
| Lakewood: | 249.9 |
| U.S. Average: | 187.1 |
Violent crime rate in 2010
| Lakewood: | 249.7 |
| U.S. Average: | 195.7 |
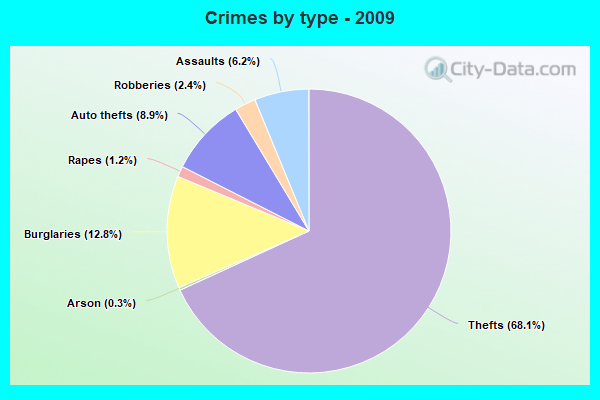
Violent crime rate in 2009
| Lakewood: | 280.9 |
| U.S. Average: | 208.9 |
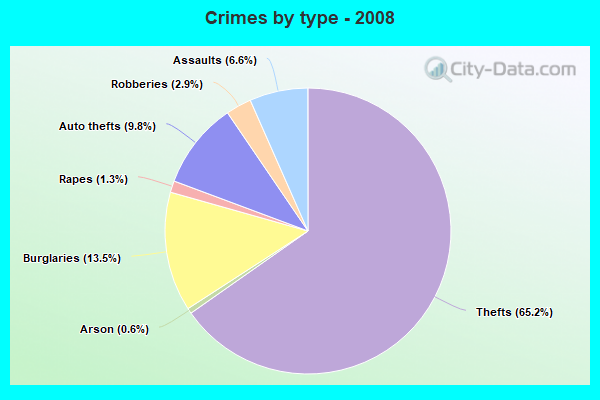
Violent crime rate in 2008
| Lakewood: | 293.3 |
| U.S. Average: | 222.5 |
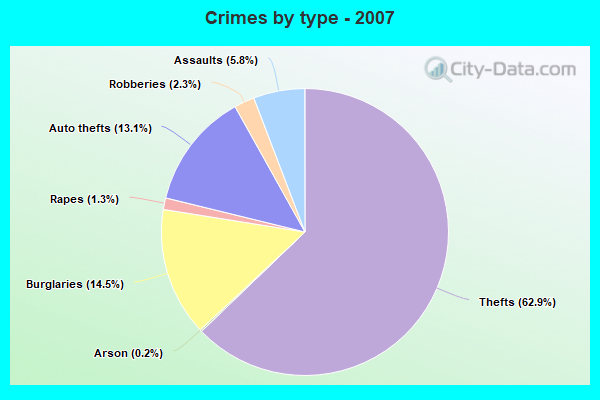
Violent crime rate in 2007
| Lakewood: | 226.6 |
| U.S. Average: | 229.1 |
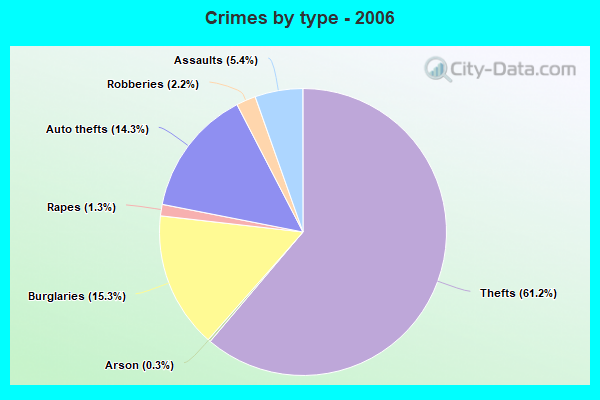
Violent crime rate in 2006
| Lakewood: | 255.5 |
| U.S. Average: | 232.6 |
Violent crime rate in 2005
| Lakewood: | 244.5 |
| U.S. Average: | 227.0 |
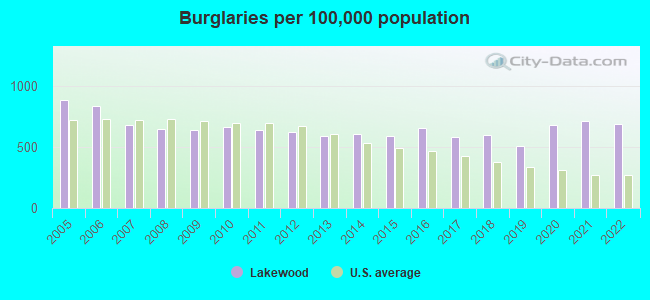
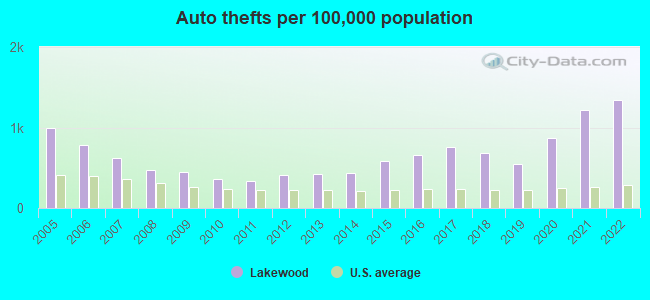
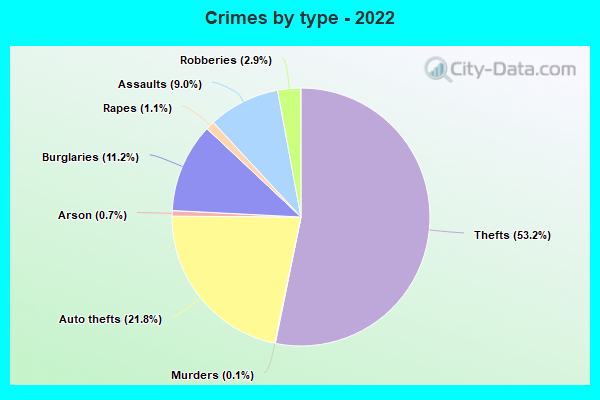
Property crime rate in 2022
| Lakewood: | 504.8 |
| U.S. Average: | 166.5 |
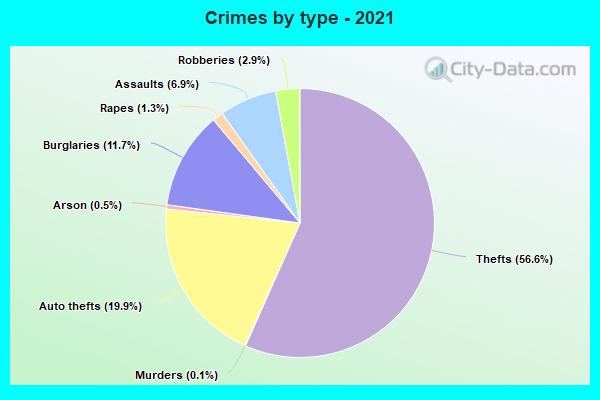
Property crime rate in 2021
| Lakewood: | 499.9 |
| U.S. Average: | 157.8 |
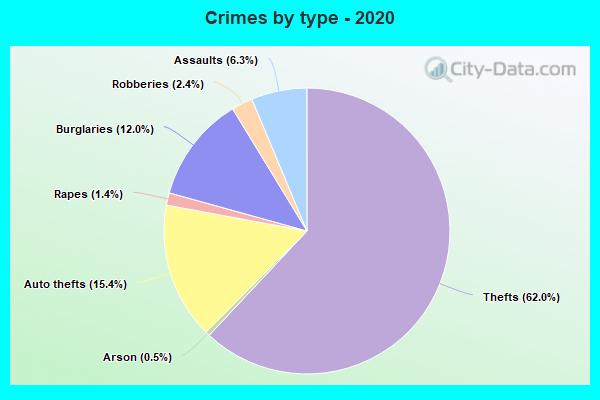
Property crime rate in 2020
| Lakewood: | 442.8 |
| U.S. Average: | 169.6 |
Property crime rate in 2019
| Lakewood: | 354.9 |
| U.S. Average: | 179.7 |
Property crime rate in 2018
| Lakewood: | 408.6 |
| U.S. Average: | 190.2 |
Property crime rate in 2017
| Lakewood: | 407.1 |
| U.S. Average: | 206.4 |
Property crime rate in 2016
| Lakewood: | 437.4 |
| U.S. Average: | 216.6 |
Property crime rate in 2015
| Lakewood: | 398.2 |
| U.S. Average: | 221.5 |
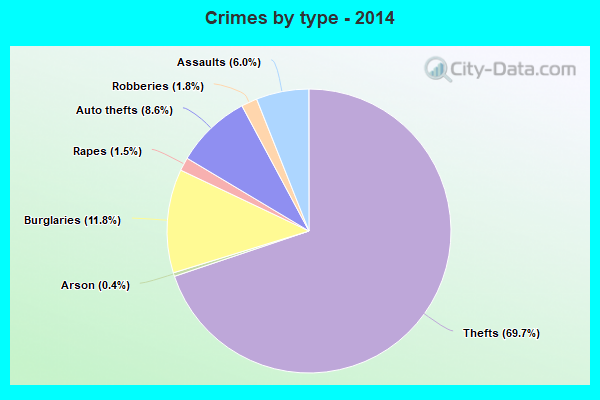
Property crime rate in 2014
| Lakewood: | 365.9 |
| U.S. Average: | 230.8 |
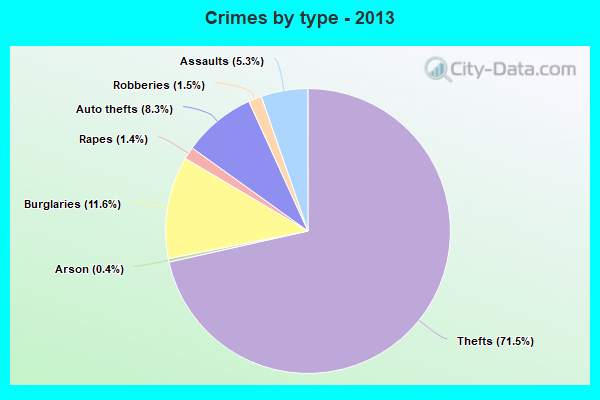
Property crime rate in 2013
| Lakewood: | 367.4 |
| U.S. Average: | 250.4 |
Property crime rate in 2012
| Lakewood: | 364.5 |
| U.S. Average: | 267.3 |
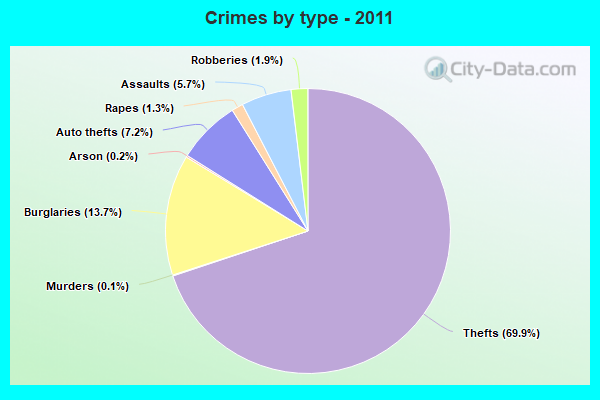
Property crime rate in 2011
| Lakewood: | 342.6 |
| U.S. Average: | 273.5 |
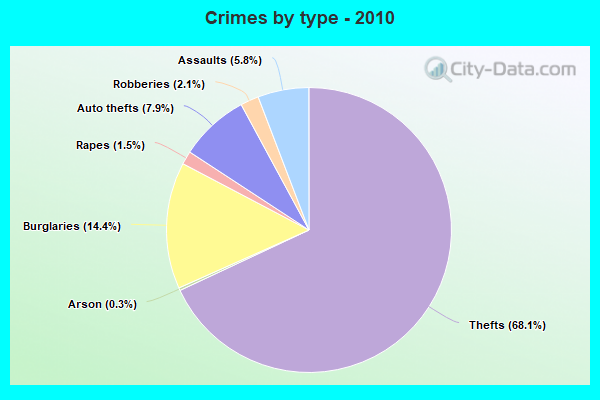
Property crime rate in 2010
| Lakewood: | 344.9 |
| U.S. Average: | 276.4 |
Property crime rate in 2009
| Lakewood: | 364.6 |
| U.S. Average: | 285.6 |
Property crime rate in 2008
| Lakewood: | 357.9 |
| U.S. Average: | 302.2 |
Property crime rate in 2007
| Lakewood: | 337.9 |
| U.S. Average: | 309.2 |
Property crime rate in 2006
| Lakewood: | 403.8 |
| U.S. Average: | 317.3 |
Property crime rate in 2005
| Lakewood: | 471.2 |
| U.S. Average: | 322.3 |


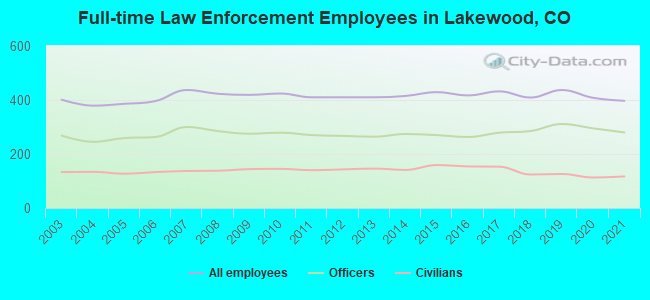
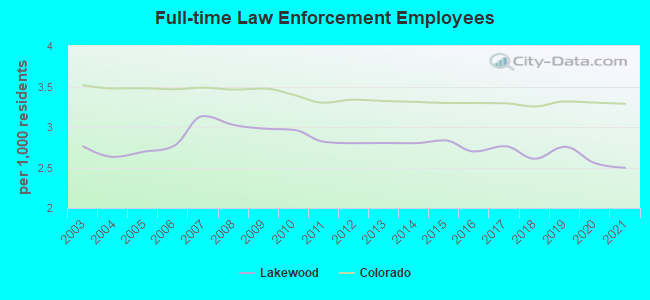
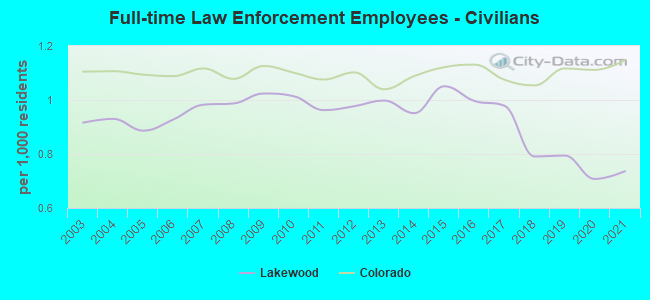
Full-time law enforcement employees in 2021, including police officers: 397 (280 officers - 237 male; 43 female).
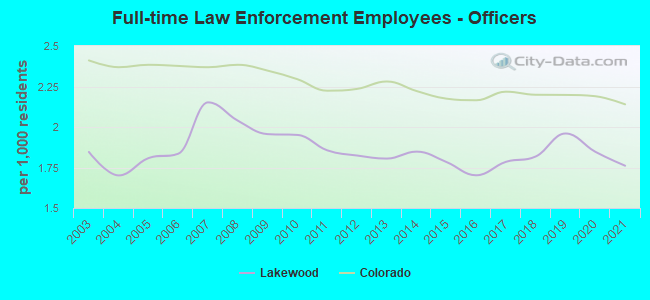
| Officers per 1,000 residents here: | 1.76 |
| Colorado average: | 2.14 |
Full-time law enforcement employees in 2020, including police officers: 408 (295 officers - 247 male; 48 female).
| Officers per 1,000 residents here: | 1.85 |
| Colorado average: | 2.19 |
Full-time law enforcement employees in 2019, including police officers: 437 (311 officers - 259 male; 52 female).
| Officers per 1,000 residents here: | 1.96 |
| Colorado average: | 2.20 |
Full-time law enforcement employees in 2018, including police officers: 409 (285 officers - 241 male; 44 female).
| Officers per 1,000 residents here: | 1.82 |
| Colorado average: | 2.20 |
Full-time law enforcement employees in 2017, including police officers: 432 (279 officers - 237 male; 42 female).
| Officers per 1,000 residents here: | 1.78 |
| Colorado average: | 2.22 |
Full-time law enforcement employees in 2016, including police officers: 417 (263 officers - 221 male; 42 female).
| Officers per 1,000 residents here: | 1.70 |
| Colorado average: | 2.17 |
Full-time law enforcement employees in 2015, including police officers: 429 (270 officers - 224 male; 46 female).
| Officers per 1,000 residents here: | 1.78 |
| Colorado average: | 2.18 |
Full-time law enforcement employees in 2014, including police officers: 415 (274 officers - 223 male; 51 female).
| Officers per 1,000 residents here: | 1.85 |
| Colorado average: | 2.22 |
Full-time law enforcement employees in 2013, including police officers: 410 (264 officers - 218 male; 46 female).
| Officers per 1,000 residents here: | 1.80 |
| Colorado average: | 2.28 |
Full-time law enforcement employees in 2012, including police officers: 410 (267 officers - 219 male; 48 female).
| Officers per 1,000 residents here: | 1.82 |
| Colorado average: | 2.23 |
Full-time law enforcement employees in 2011, including police officers: 410 (270 officers - 218 male; 52 female).
| Officers per 1,000 residents here: | 1.86 |
| Colorado average: | 2.22 |
Full-time law enforcement employees in 2010, including police officers: 424 (279 officers - 225 male; 54 female).
| Officers per 1,000 residents here: | 1.95 |
| Colorado average: | 2.30 |
Full-time law enforcement employees in 2009, including police officers: 419 (275 officers - 222 male; 53 female).
| Officers per 1,000 residents here: | 1.96 |
| Colorado average: | 2.35 |
Full-time law enforcement employees in 2008, including police officers: 423 (285 officers - 229 male; 56 female).
| Officers per 1,000 residents here: | 2.04 |
| Colorado average: | 2.38 |
Full-time law enforcement employees in 2007, including police officers: 437 (300 officers - 243 male; 57 female).
| Officers per 1,000 residents here: | 2.15 |
| Colorado average: | 2.37 |
Full-time law enforcement employees in 2006, including police officers: 396 (263 officers - 213 male; 50 female).
| Officers per 1,000 residents here: | 1.83 |
| Colorado average: | 2.38 |
Full-time law enforcement employees in 2005, including police officers: 386 (259 officers - 209 male; 50 female).
| Officers per 1,000 residents here: | 1.81 |
| Colorado average: | 2.38 |
Full-time law enforcement employees in 2004, including police officers: 379 (245 officers - 200 male; 45 female).
| Officers per 1,000 residents here: | 1.70 |
| Colorado average: | 2.37 |
Full-time law enforcement employees in 2003, including police officers: 401 (268 officers - 218 male; 50 female).
| Officers per 1,000 residents here: | 1.85 |
| Colorado average: | 2.41 |


Zip codes: 80228.