Crime rate in Pomona, California (CA): murders, rapes, robberies, assaults, burglaries, thefts, auto thefts, arson, law enforcement employees, police officers, crime map
Crime rate in Pomona, CA
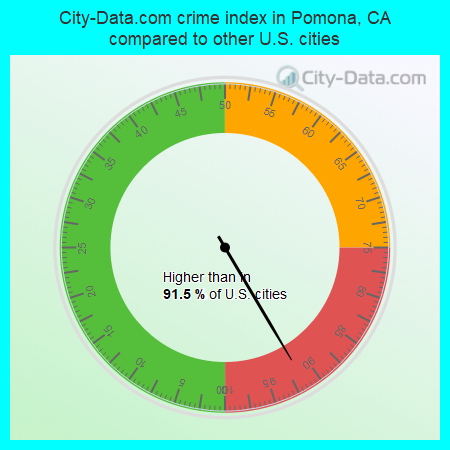
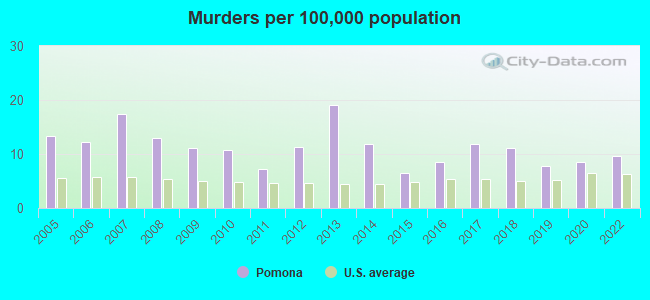
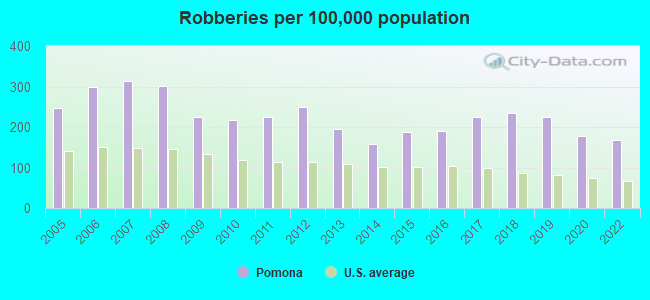
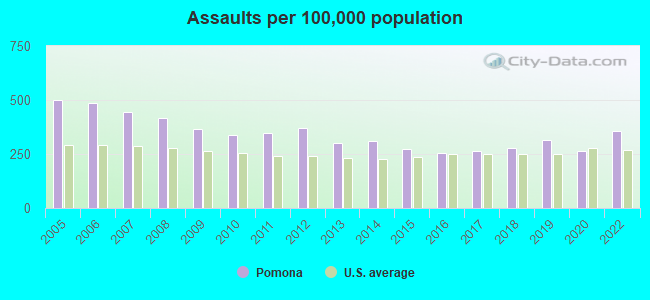
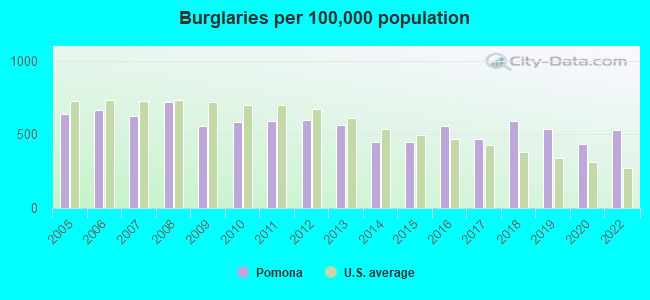
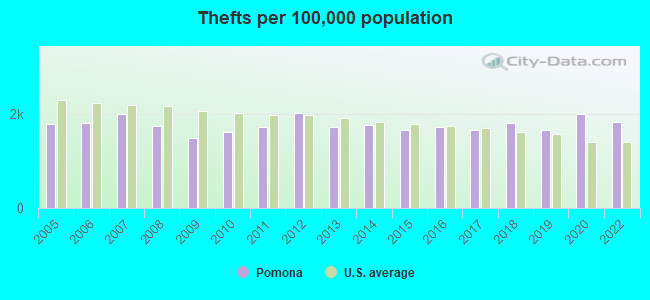
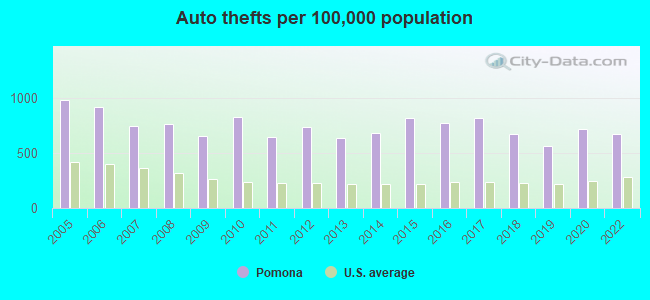
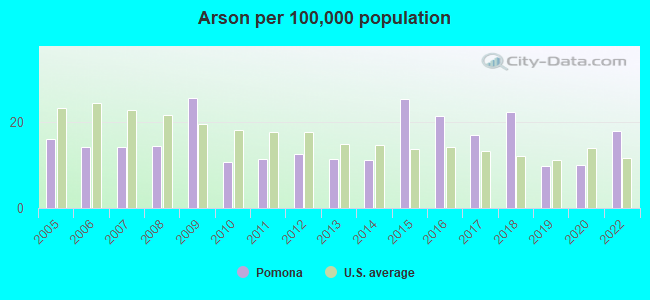
The 2022 crime rate in Pomona, CA is 349 (City-Data.com crime index), which is 1.4 times higher than the U.S. average. It was higher than in 91.5% U.S. cities. The 2022 Pomona crime rate rose by 3% compared to 2020. The number of homicides stood at 14 - an increase of 1 compared to 2020. In the last 5 years Pomona has seen rise of violent crime and decline of property crime.See how dangerous Pomona, CA is compared to the nearest cities:
(Note: Higher means more crime)
(Note: Higher means more crime)
| Pomona: | 349.1 |
| Montclair: | 398.1 |
| La Verne: | 171.1 |
| Claremont: | 215.2 |
| San Dimas: | 204.8 |
| Chino: | 213.0 |
| Diamond Bar: | 150.1 |
| Chino Hills: | 122.1 |
| Walnut: | 129.5 |
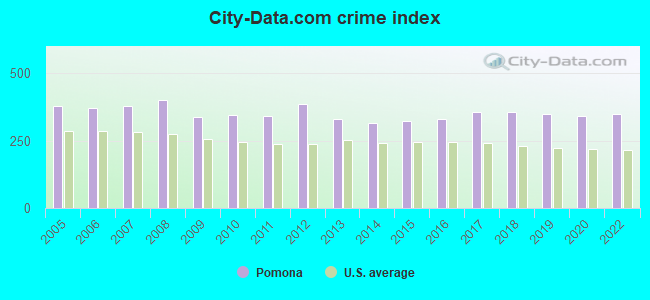
The City-Data.com crime index weighs serious crimes and violent crimes more heavily. Higher means more crime, U.S. average is 246.1. It adjusts for the number of visitors and daily workers commuting into cities.
- means the value is smaller than the state average.- means the value is about the same as the state average.
- means the value is bigger than the state average.
- means the value is much bigger than the state average.
According to our research of California and other state lists, there were 239 registered sex offenders living in Pomona, California as of April 25, 2024.
The ratio of all residents to sex offenders in Pomona is 638 to 1.
The ratio of registered sex offenders to all residents in this city is near the state average.
Violent crime rate in 2022
| Pomona: | 337.6 |
| U.S. Average: | 219.8 |
Violent crime rate in 2020
| Pomona: | 300.7 |
| U.S. Average: | 228.2 |
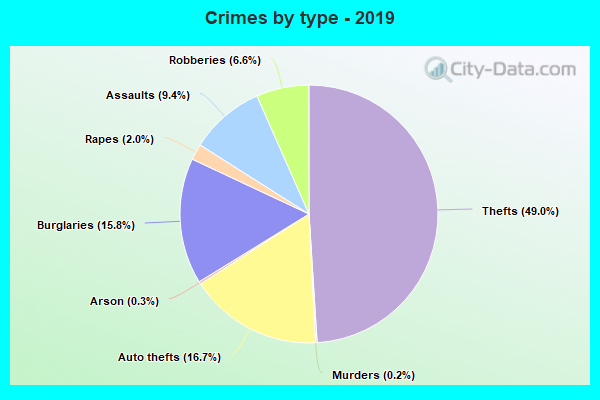
Violent crime rate in 2019
| Pomona: | 352.5 |
| U.S. Average: | 219.9 |
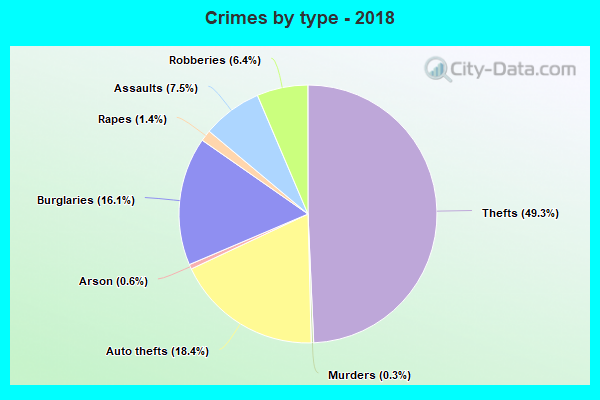
Violent crime rate in 2018
| Pomona: | 327.0 |
| U.S. Average: | 221.2 |
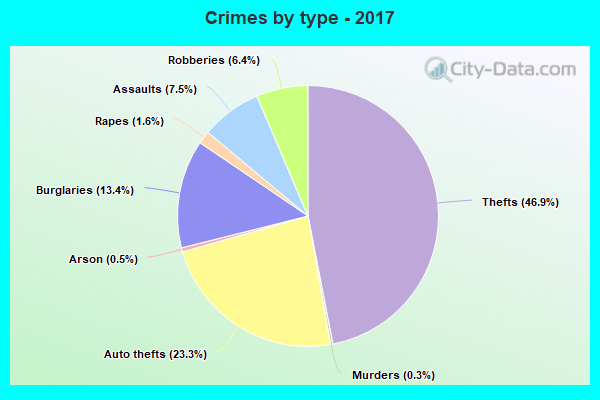
Violent crime rate in 2017
| Pomona: | 325.0 |
| U.S. Average: | 226.2 |
Violent crime rate in 2016
| Pomona: | 283.6 |
| U.S. Average: | 227.3 |
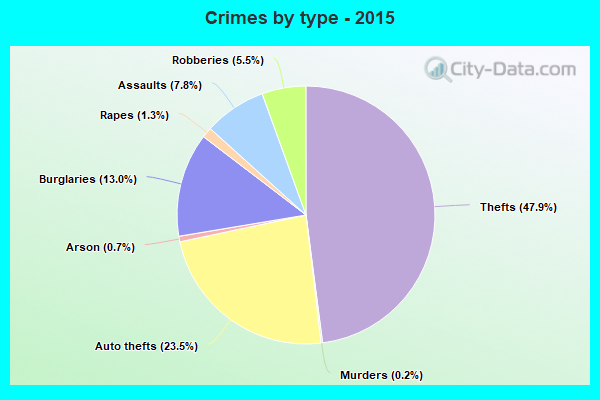
Violent crime rate in 2015
| Pomona: | 289.5 |
| U.S. Average: | 219.3 |
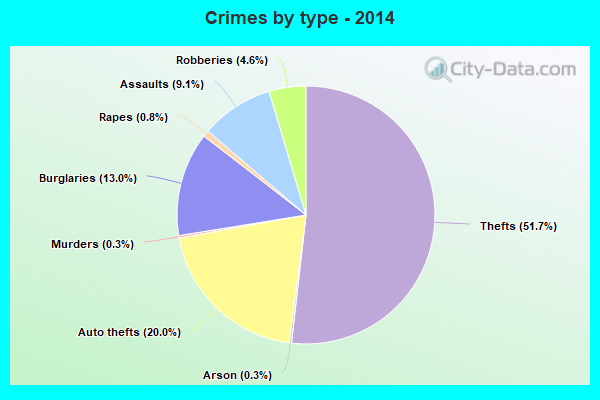
Violent crime rate in 2014
| Pomona: | 288.0 |
| U.S. Average: | 211.1 |
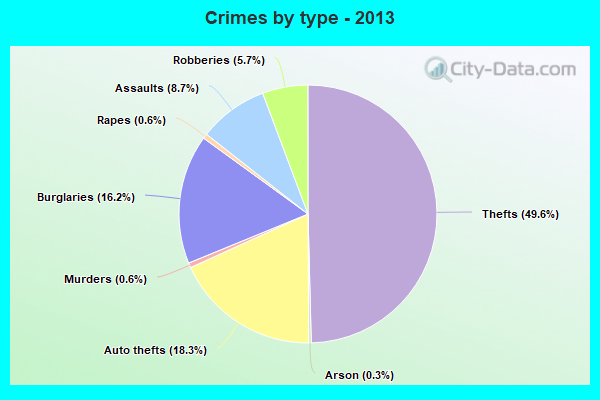
Violent crime rate in 2013
| Pomona: | 306.2 |
| U.S. Average: | 214.2 |
Violent crime rate in 2012
| Pomona: | 374.6 |
| U.S. Average: | 187.4 |
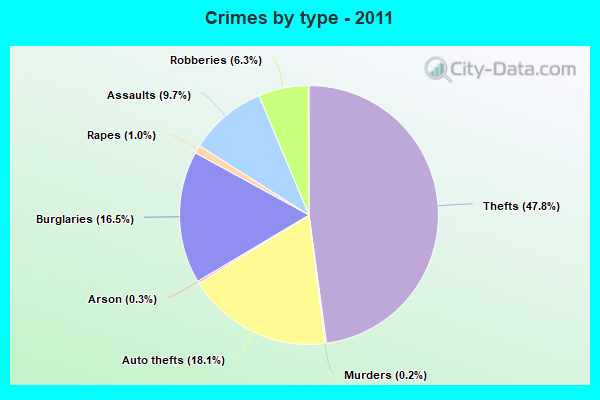
Violent crime rate in 2011
| Pomona: | 336.2 |
| U.S. Average: | 187.1 |
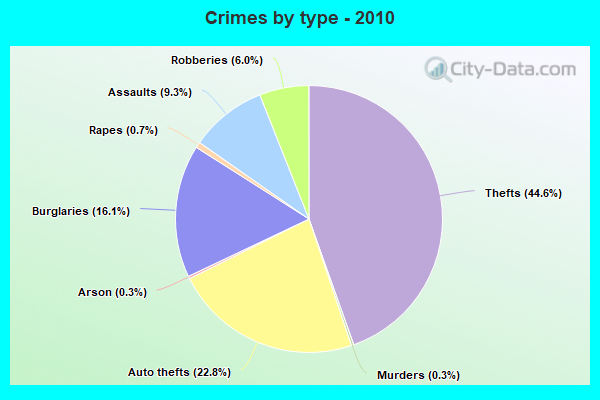
Violent crime rate in 2010
| Pomona: | 322.7 |
| U.S. Average: | 195.7 |
Violent crime rate in 2009
| Pomona: | 347.5 |
| U.S. Average: | 208.9 |
Violent crime rate in 2008
| Pomona: | 409.6 |
| U.S. Average: | 222.5 |
Violent crime rate in 2007
| Pomona: | 392.6 |
| U.S. Average: | 229.1 |
Violent crime rate in 2006
| Pomona: | 387.0 |
| U.S. Average: | 232.6 |
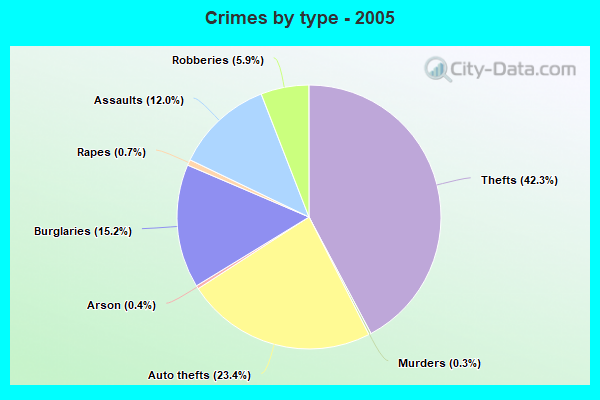
Violent crime rate in 2005
| Pomona: | 387.5 |
| U.S. Average: | 227.0 |
Property crime rate in 2022
| Pomona: | 297.8 |
| U.S. Average: | 166.5 |
Property crime rate in 2020
| Pomona: | 293.0 |
| U.S. Average: | 169.6 |
Property crime rate in 2019
| Pomona: | 274.3 |
| U.S. Average: | 179.7 |
Property crime rate in 2018
| Pomona: | 308.3 |
| U.S. Average: | 190.2 |
Property crime rate in 2017
| Pomona: | 298.5 |
| U.S. Average: | 206.4 |
Property crime rate in 2016
| Pomona: | 311.5 |
| U.S. Average: | 216.6 |
Property crime rate in 2015
| Pomona: | 294.5 |
| U.S. Average: | 221.5 |
Property crime rate in 2014
| Pomona: | 280.3 |
| U.S. Average: | 230.8 |
Property crime rate in 2013
| Pomona: | 292.2 |
| U.S. Average: | 250.4 |
Property crime rate in 2012
| Pomona: | 329.3 |
| U.S. Average: | 267.3 |
Property crime rate in 2011
| Pomona: | 300.6 |
| U.S. Average: | 273.5 |
Property crime rate in 2010
| Pomona: | 320.9 |
| U.S. Average: | 276.4 |
Property crime rate in 2009
| Pomona: | 284.2 |
| U.S. Average: | 285.6 |
Property crime rate in 2008
| Pomona: | 345.7 |
| U.S. Average: | 302.2 |
Property crime rate in 2007
| Pomona: | 303.9 |
| U.S. Average: | 309.2 |
Property crime rate in 2006
| Pomona: | 324.6 |
| U.S. Average: | 317.3 |
Property crime rate in 2005
| Pomona: | 328.4 |
| U.S. Average: | 322.3 |
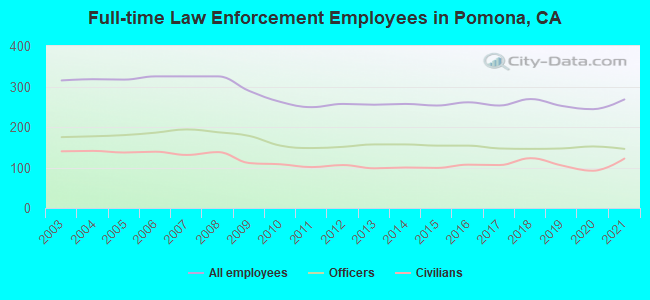
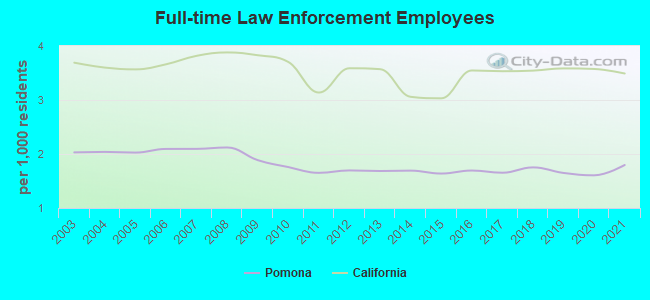
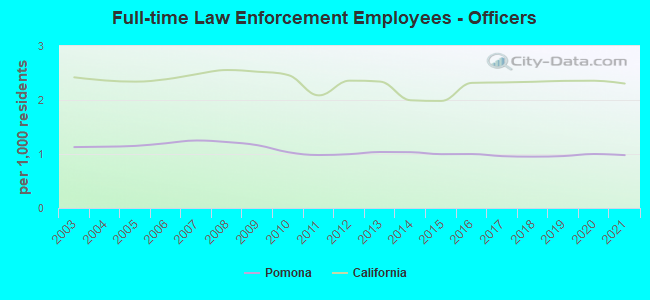
Full-time law enforcement employees in 2021, including police officers: 268 (146 officers - 128 male; 18 female).
| Officers per 1,000 residents here: | 0.98 |
| California average: | 2.30 |
Full-time law enforcement employees in 2020, including police officers: 244 (152 officers - 135 male; 17 female).
| Officers per 1,000 residents here: | 1.00 |
| California average: | 2.36 |
Full-time law enforcement employees in 2019, including police officers: 252 (147 officers - 133 male; 14 female).
| Officers per 1,000 residents here: | 0.96 |
| California average: | 2.35 |
Full-time law enforcement employees in 2018, including police officers: 269 (146 officers - 134 male; 12 female).
| Officers per 1,000 residents here: | 0.95 |
| California average: | 2.34 |
Full-time law enforcement employees in 2017, including police officers: 253 (147 officers - 134 male; 13 female).
| Officers per 1,000 residents here: | 0.96 |
| California average: | 2.32 |
Full-time law enforcement employees in 2016, including police officers: 261 (154 officers - 140 male; 14 female).
| Officers per 1,000 residents here: | 1.00 |
| California average: | 2.32 |
Full-time law enforcement employees in 2015, including police officers: 253 (154 officers - 144 male; 10 female).
| Officers per 1,000 residents here: | 1.00 |
| California average: | 1.98 |
Full-time law enforcement employees in 2014, including police officers: 257 (157 officers - 147 male; 10 female).
| Officers per 1,000 residents here: | 1.03 |
| California average: | 2.00 |
Full-time law enforcement employees in 2013, including police officers: 255 (157 officers - 146 male; 11 female).
| Officers per 1,000 residents here: | 1.04 |
| California average: | 2.34 |
Full-time law enforcement employees in 2012, including police officers: 257 (151 officers - 140 male; 11 female).
| Officers per 1,000 residents here: | 1.00 |
| California average: | 2.36 |
Full-time law enforcement employees in 2011, including police officers: 249 (148 officers - 134 male; 14 female).
| Officers per 1,000 residents here: | 0.98 |
| California average: | 2.09 |
Full-time law enforcement employees in 2010, including police officers: 262 (154 officers - 140 male; 14 female).
| Officers per 1,000 residents here: | 1.03 |
| California average: | 2.46 |
Full-time law enforcement employees in 2009, including police officers: 289 (178 officers - 164 male; 14 female).
| Officers per 1,000 residents here: | 1.16 |
| California average: | 2.52 |
Full-time law enforcement employees in 2008, including police officers: 325 (187 officers - 173 male; 14 female).
| Officers per 1,000 residents here: | 1.22 |
| California average: | 2.55 |
Full-time law enforcement employees in 2007, including police officers: 325 (194 officers - 181 male; 13 female).
| Officers per 1,000 residents here: | 1.25 |
| California average: | 2.48 |
Full-time law enforcement employees in 2006, including police officers: 325 (186 officers - 174 male; 12 female).
| Officers per 1,000 residents here: | 1.20 |
| California average: | 2.38 |
Full-time law enforcement employees in 2005, including police officers: 317 (180 officers - 169 male; 11 female).
| Officers per 1,000 residents here: | 1.15 |
| California average: | 2.34 |
Full-time law enforcement employees in 2004, including police officers: 318 (177 officers - 166 male; 11 female).
| Officers per 1,000 residents here: | 1.14 |
| California average: | 2.36 |
Full-time law enforcement employees in 2003, including police officers: 315 (175 officers - 166 male; 9 female).
| Officers per 1,000 residents here: | 1.13 |
| California average: | 2.42 |


Zip codes: 91766.