Crime rate in Roanoke, Virginia (VA): murders, rapes, robberies, assaults, burglaries, thefts, auto thefts, arson, law enforcement employees, police officers, crime map
Crime rate in Roanoke, VA
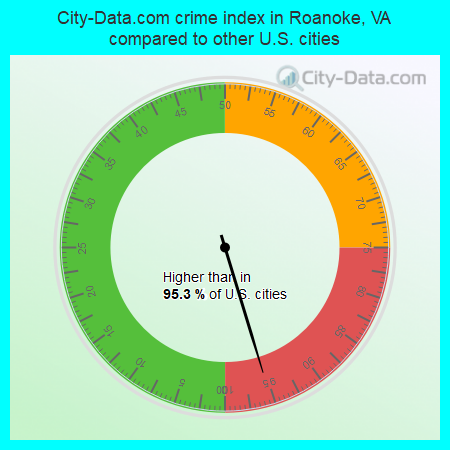
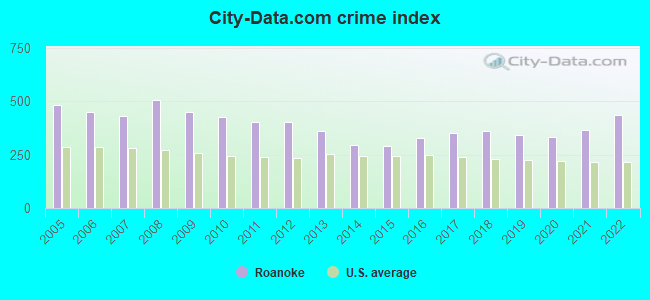
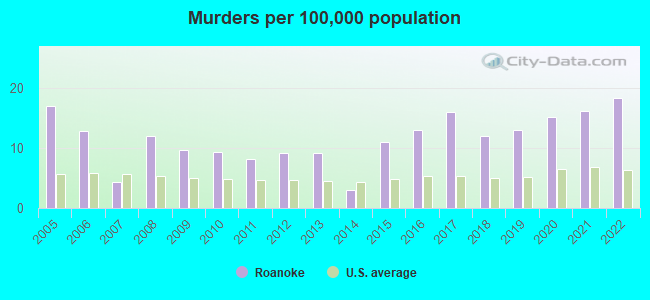
The 2022 crime rate in Roanoke, VA is 437 (City-Data.com crime index), which is 1.8 times higher than the U.S. average. It was higher than in 95.3% U.S. cities. The 2022 Roanoke crime rate rose by 19% compared to 2021. The number of homicides stood at 18 - an increase of 2 compared to 2021. In the last 5 years Roanoke has seen rise of violent crime and rise of property crime.See how dangerous Roanoke, VA is compared to the nearest cities:
(Note: Higher means more crime)
(Note: Higher means more crime)
| Roanoke: | 437.3 |
| Vinton: | 150.1 |
| Salem: | 130.8 |
| Rocky Mount: | 263.1 |
| Bedford: | 249.1 |
| Blacksburg: | 53.3 |
| Christiansburg: | 166.4 |
| Covington: | 203.4 |
| Radford: | 130.7 |
The City-Data.com crime index weighs serious crimes and violent crimes more heavily. Higher means more crime, U.S. average is 246.1. It adjusts for the number of visitors and daily workers commuting into cities.
- means the value is smaller than the state average.- means the value is about the same as the state average.
- means the value is bigger than the state average.
- means the value is much bigger than the state average.
According to our research of Virginia and other state lists, there were 593 registered sex offenders living in Roanoke, Virginia as of April 23, 2024.
The ratio of all residents to sex offenders in Roanoke is 170 to 1.
Violent crime rate in 2022
| Roanoke: | 388.0 |
| U.S. Average: | 219.8 |
Violent crime rate in 2021
| Roanoke: | 313.6 |
| U.S. Average: | 224.8 |
Violent crime rate in 2020
| Roanoke: | 268.8 |
| U.S. Average: | 228.2 |
Violent crime rate in 2019
| Roanoke: | 235.6 |
| U.S. Average: | 219.9 |
Violent crime rate in 2018
| Roanoke: | 262.9 |
| U.S. Average: | 221.2 |
Violent crime rate in 2017
| Roanoke: | 249.4 |
| U.S. Average: | 226.2 |
Violent crime rate in 2016
| Roanoke: | 243.1 |
| U.S. Average: | 227.3 |
Violent crime rate in 2015
| Roanoke: | 203.4 |
| U.S. Average: | 219.3 |
Violent crime rate in 2014
| Roanoke: | 194.1 |
| U.S. Average: | 211.1 |
Violent crime rate in 2013
| Roanoke: | 271.1 |
| U.S. Average: | 214.2 |
Violent crime rate in 2012
| Roanoke: | 310.9 |
| U.S. Average: | 187.4 |
Violent crime rate in 2011
| Roanoke: | 331.5 |
| U.S. Average: | 187.1 |
Violent crime rate in 2010
| Roanoke: | 376.7 |
| U.S. Average: | 195.7 |
Violent crime rate in 2009
| Roanoke: | 371.6 |
| U.S. Average: | 208.9 |
Violent crime rate in 2008
| Roanoke: | 450.1 |
| U.S. Average: | 222.5 |
Violent crime rate in 2007
| Roanoke: | 421.1 |
| U.S. Average: | 229.1 |
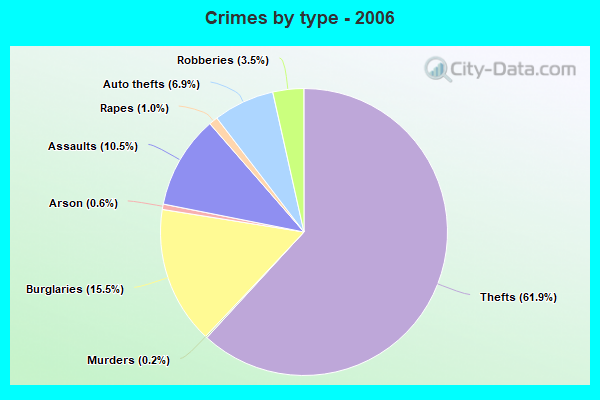
Violent crime rate in 2006
| Roanoke: | 443.4 |
| U.S. Average: | 232.6 |
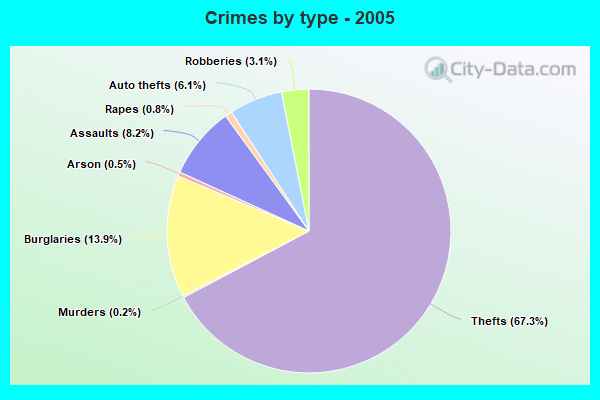
Violent crime rate in 2005
| Roanoke: | 423.3 |
| U.S. Average: | 227.0 |
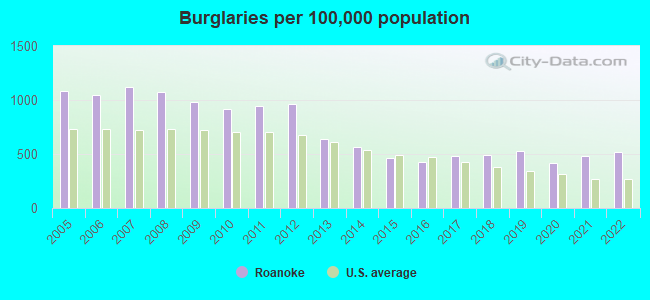
Property crime rate in 2022
| Roanoke: | 333.7 |
| U.S. Average: | 166.5 |
Property crime rate in 2021
| Roanoke: | 294.2 |
| U.S. Average: | 157.8 |
Property crime rate in 2020
| Roanoke: | 289.8 |
| U.S. Average: | 169.6 |
Property crime rate in 2019
| Roanoke: | 329.9 |
| U.S. Average: | 179.7 |
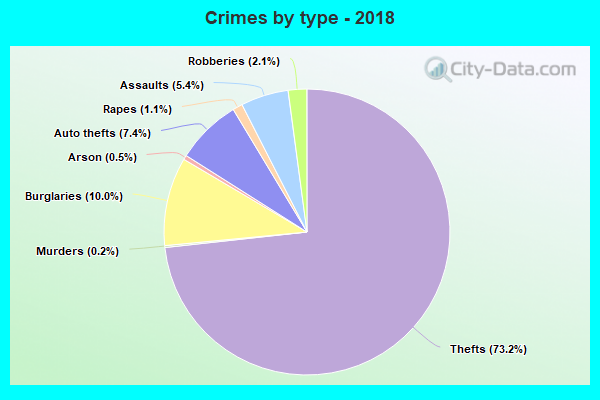
Property crime rate in 2018
| Roanoke: | 331.9 |
| U.S. Average: | 190.2 |
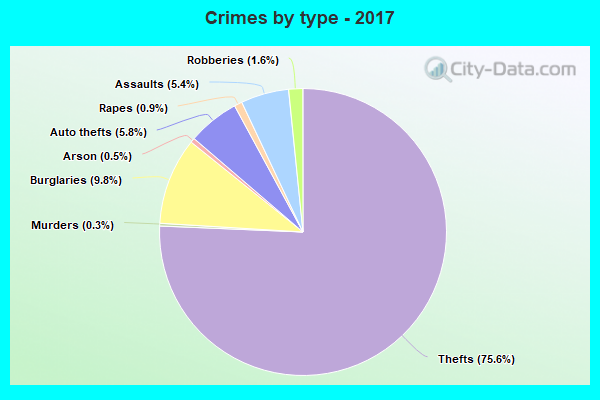
Property crime rate in 2017
| Roanoke: | 326.8 |
| U.S. Average: | 206.4 |
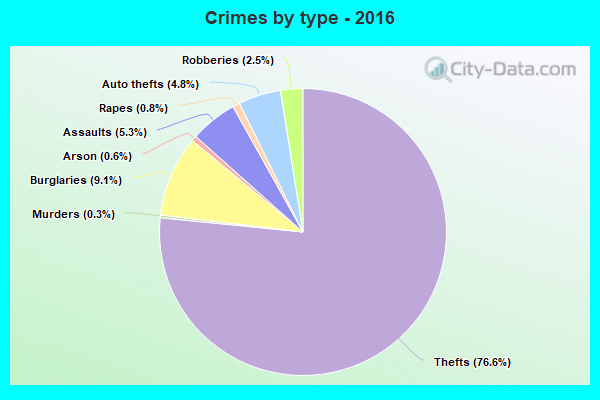
Property crime rate in 2016
| Roanoke: | 296.1 |
| U.S. Average: | 216.6 |
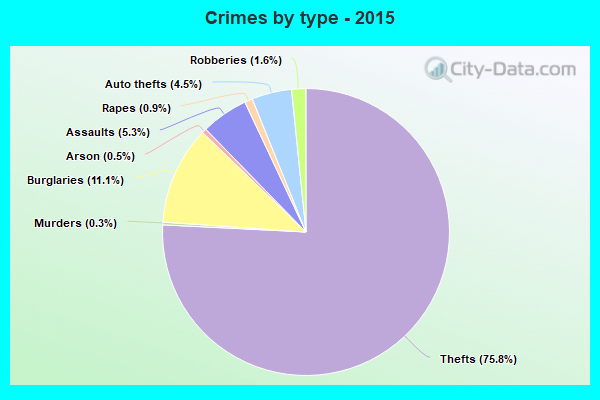
Property crime rate in 2015
| Roanoke: | 280.5 |
| U.S. Average: | 221.5 |
Property crime rate in 2014
| Roanoke: | 312.2 |
| U.S. Average: | 230.8 |
Property crime rate in 2013
| Roanoke: | 341.7 |
| U.S. Average: | 250.4 |
Property crime rate in 2012
| Roanoke: | 413.8 |
| U.S. Average: | 267.3 |
Property crime rate in 2011
| Roanoke: | 407.9 |
| U.S. Average: | 273.5 |
Property crime rate in 2010
| Roanoke: | 406.9 |
| U.S. Average: | 276.4 |
Property crime rate in 2009
| Roanoke: | 446.0 |
| U.S. Average: | 285.6 |
Property crime rate in 2008
| Roanoke: | 470.1 |
| U.S. Average: | 302.2 |
Property crime rate in 2007
| Roanoke: | 381.2 |
| U.S. Average: | 309.2 |
Property crime rate in 2006
| Roanoke: | 384.3 |
| U.S. Average: | 317.3 |
Property crime rate in 2005
| Roanoke: | 435.9 |
| U.S. Average: | 322.3 |

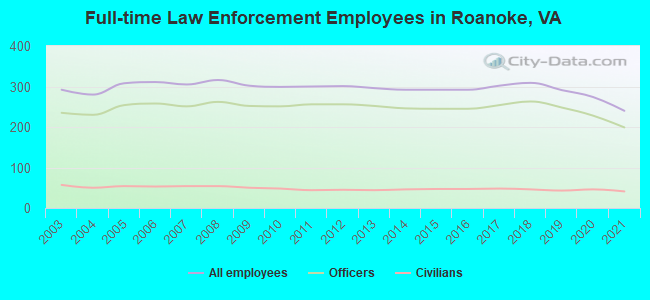
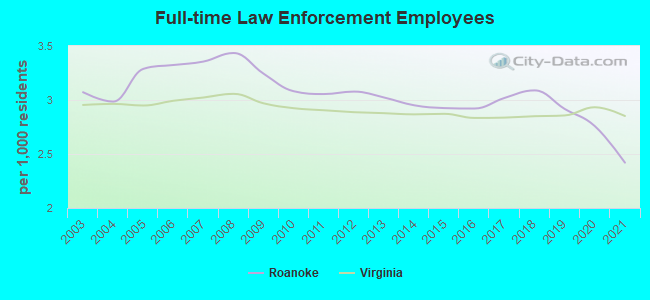
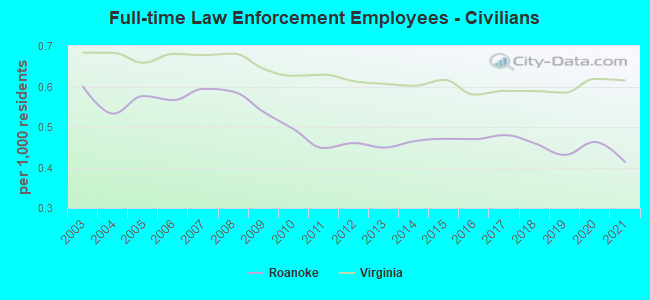
Full-time law enforcement employees in 2021, including police officers: 240 (199 officers - 157 male; 42 female).
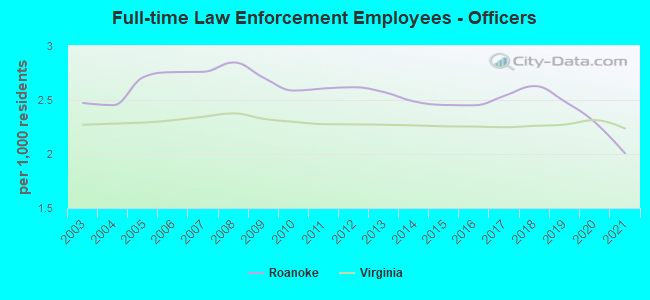
| Officers per 1,000 residents here: | 2.01 |
| Virginia average: | 2.24 |
Full-time law enforcement employees in 2020, including police officers: 274 (228 officers - 182 male; 46 female).
| Officers per 1,000 residents here: | 2.30 |
| Virginia average: | 2.31 |
Full-time law enforcement employees in 2019, including police officers: 291 (248 officers - 200 male; 48 female).
| Officers per 1,000 residents here: | 2.49 |
| Virginia average: | 2.27 |
Full-time law enforcement employees in 2018, including police officers: 309 (263 officers - 219 male; 44 female).
| Officers per 1,000 residents here: | 2.63 |
| Virginia average: | 2.26 |
Full-time law enforcement employees in 2017, including police officers: 302 (254 officers - 210 male; 44 female).
| Officers per 1,000 residents here: | 2.54 |
| Virginia average: | 2.25 |
Full-time law enforcement employees in 2016, including police officers: 292 (245 officers - 199 male; 46 female).
| Officers per 1,000 residents here: | 2.45 |
| Virginia average: | 2.25 |
Full-time law enforcement employees in 2015, including police officers: 292 (245 officers - 202 male; 43 female).
| Officers per 1,000 residents here: | 2.45 |
| Virginia average: | 2.26 |
Full-time law enforcement employees in 2014, including police officers: 292 (246 officers - 210 male; 36 female).
| Officers per 1,000 residents here: | 2.49 |
| Virginia average: | 2.27 |
Full-time law enforcement employees in 2013, including police officers: 296 (252 officers - 218 male; 34 female).
| Officers per 1,000 residents here: | 2.57 |
| Virginia average: | 2.27 |
Full-time law enforcement employees in 2012, including police officers: 301 (256 officers - 224 male; 32 female).
| Officers per 1,000 residents here: | 2.62 |
| Virginia average: | 2.27 |
Full-time law enforcement employees in 2011, including police officers: 300 (256 officers - 227 male; 29 female).
| Officers per 1,000 residents here: | 2.61 |
| Virginia average: | 2.28 |
Full-time law enforcement employees in 2010, including police officers: 299 (251 officers - 225 male; 26 female).
| Officers per 1,000 residents here: | 2.59 |
| Virginia average: | 2.30 |
Full-time law enforcement employees in 2009, including police officers: 302 (252 officers - 229 male; 23 female).
| Officers per 1,000 residents here: | 2.71 |
| Virginia average: | 2.32 |
Full-time law enforcement employees in 2008, including police officers: 316 (262 officers - 240 male; 22 female).
| Officers per 1,000 residents here: | 2.85 |
| Virginia average: | 2.38 |
Full-time law enforcement employees in 2007, including police officers: 305 (251 officers - 229 male; 22 female).
| Officers per 1,000 residents here: | 2.76 |
| Virginia average: | 2.34 |
Full-time law enforcement employees in 2006, including police officers: 311 (258 officers - 236 male; 22 female).
| Officers per 1,000 residents here: | 2.76 |
| Virginia average: | 2.31 |
Full-time law enforcement employees in 2005, including police officers: 308 (254 officers - 231 male; 23 female).
| Officers per 1,000 residents here: | 2.71 |
| Virginia average: | 2.29 |
Full-time law enforcement employees in 2004, including police officers: 280 (230 officers - 209 male; 21 female).
| Officers per 1,000 residents here: | 2.45 |
| Virginia average: | 2.28 |
Full-time law enforcement employees in 2003, including police officers: 292 (235 officers - 216 male; 19 female).
| Officers per 1,000 residents here: | 2.47 |
| Virginia average: | 2.27 |