Crime rate in St. Louis, Missouri (MO): murders, rapes, robberies, assaults, burglaries, thefts, auto thefts, arson, law enforcement employees, police officers, crime map
Crime rate in St. Louis, MO
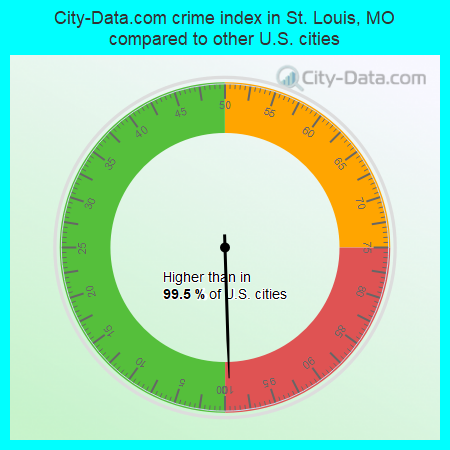
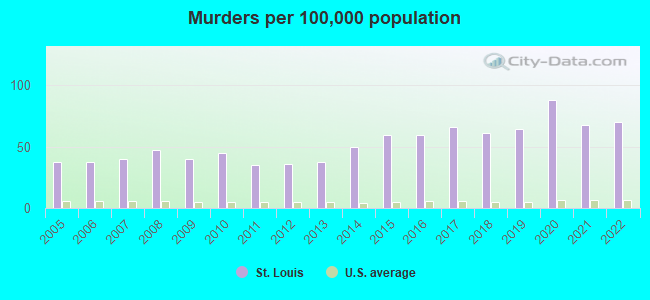
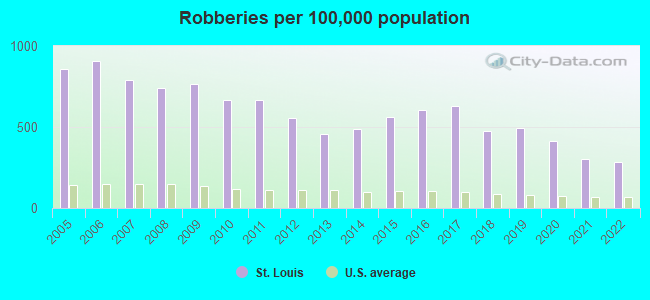
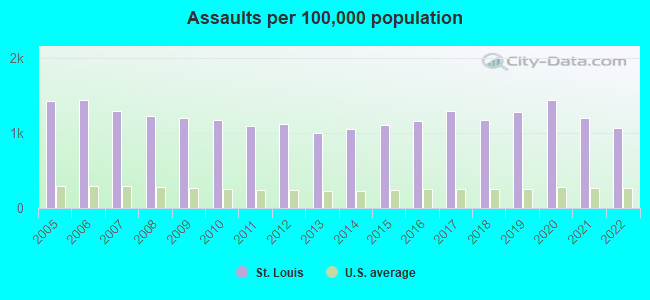
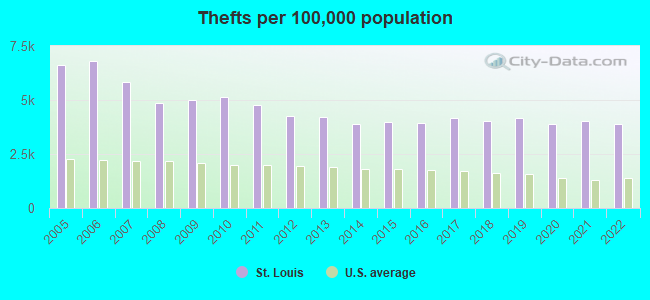
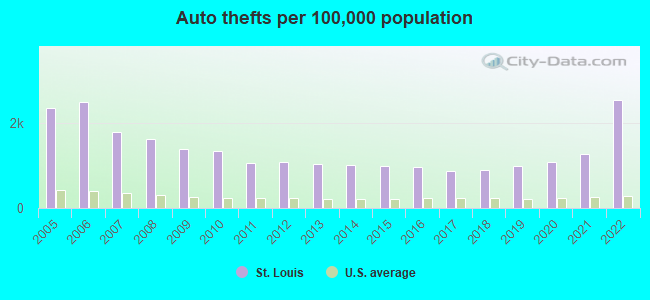
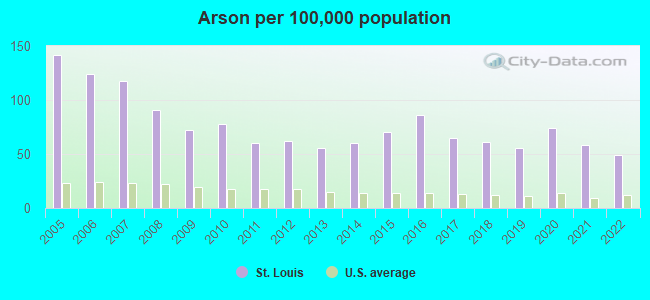
The 2022 crime rate in St. Louis, MO is 896 (City-Data.com crime index), which is 3.6 times higher than the U.S. average. It was higher than in 99.5% U.S. cities. The 2022 St. Louis crime rate rose by 8% compared to 2021. The number of homicides stood at 200 - an increase of 1 compared to 2021. In the last 5 years St. Louis has seen decline of violent crime and increasing property crime.See how dangerous St. Louis, MO is compared to the nearest cities:
(Note: Higher means more crime)
(Note: Higher means more crime)
| St. Louis: | 896.4 |
| Maplewood: | 364.9 |
| Hillsdale: | 315.7 |
| Richmond Heights: | 453.0 |
| Brooklyn: | 314.6 |
| Clayton: | 99.5 |
| Sauget: | 2,532.9 |
| Pagedale: | 930.7 |
| University City: | 193.6 |
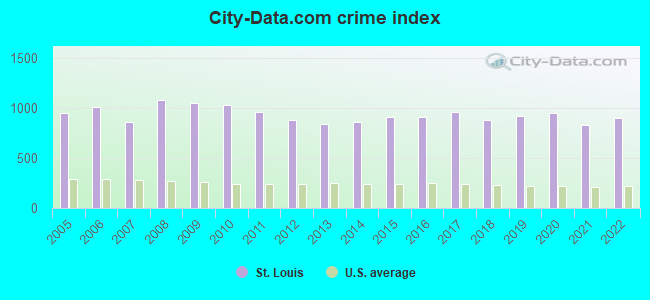
The City-Data.com crime index weighs serious crimes and violent crimes more heavily. Higher means more crime, U.S. average is 246.1. It adjusts for the number of visitors and daily workers commuting into cities.
- means the value is bigger than the state average.- means the value is much bigger than the state average.
According to our research of Missouri and other state lists, there were 2,533 registered sex offenders living in St. Louis, Missouri as of April 25, 2024.
The ratio of all residents to sex offenders in St. Louis is 123 to 1.
Violent crime rate in 2022
| St. Louis: | 867.5 |
| U.S. Average: | 219.8 |
Violent crime rate in 2021
| St. Louis: | 949.8 |
| U.S. Average: | 224.8 |
Violent crime rate in 2020
| St. Louis: | 1,179.5 |
| U.S. Average: | 228.2 |
Violent crime rate in 2019
| St. Louis: | 1,104.6 |
| U.S. Average: | 219.9 |
Violent crime rate in 2018
| St. Louis: | 1,042.0 |
| U.S. Average: | 221.2 |
Violent crime rate in 2017
| St. Louis: | 1,186.8 |
| U.S. Average: | 226.2 |
Violent crime rate in 2016
| St. Louis: | 1,092.2 |
| U.S. Average: | 227.3 |
Violent crime rate in 2015
| St. Louis: | 1,039.0 |
| U.S. Average: | 219.3 |
Violent crime rate in 2014
| St. Louis: | 958.0 |
| U.S. Average: | 211.1 |
Violent crime rate in 2013
| St. Louis: | 905.6 |
| U.S. Average: | 214.2 |
Violent crime rate in 2012
| St. Louis: | 972.6 |
| U.S. Average: | 187.4 |
Violent crime rate in 2011
| St. Louis: | 1,010.6 |
| U.S. Average: | 187.1 |
Violent crime rate in 2010
| St. Louis: | 1,068.8 |
| U.S. Average: | 195.7 |
Violent crime rate in 2009
| St. Louis: | 1,130.6 |
| U.S. Average: | 208.9 |
Violent crime rate in 2008
| St. Louis: | 1,139.9 |
| U.S. Average: | 222.5 |
Violent crime rate in 2007
| St. Louis: | 888.8 |
| U.S. Average: | 229.1 |
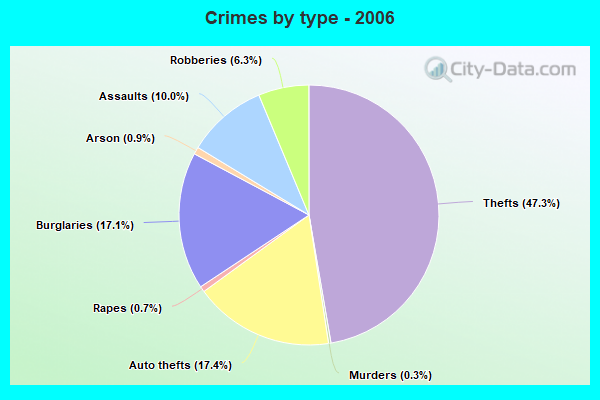
Violent crime rate in 2006
| St. Louis: | 1,000.0 |
| U.S. Average: | 232.6 |
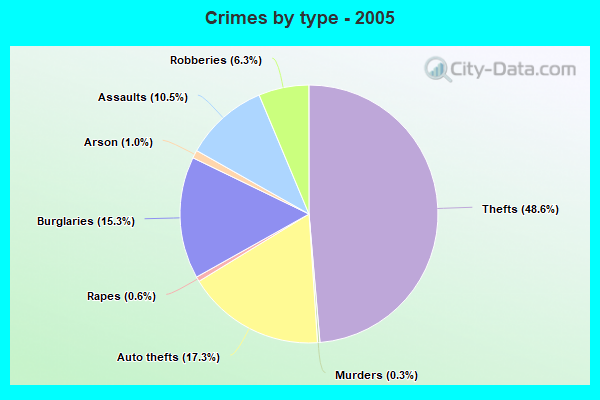
Violent crime rate in 2005
| St. Louis: | 966.3 |
| U.S. Average: | 227.0 |
Property crime rate in 2022
| St. Louis: | 738.6 |
| U.S. Average: | 166.5 |
Property crime rate in 2021
| St. Louis: | 533.6 |
| U.S. Average: | 157.8 |
Property crime rate in 2020
| St. Louis: | 527.7 |
| U.S. Average: | 169.6 |
Property crime rate in 2019
| St. Louis: | 560.9 |
| U.S. Average: | 179.7 |
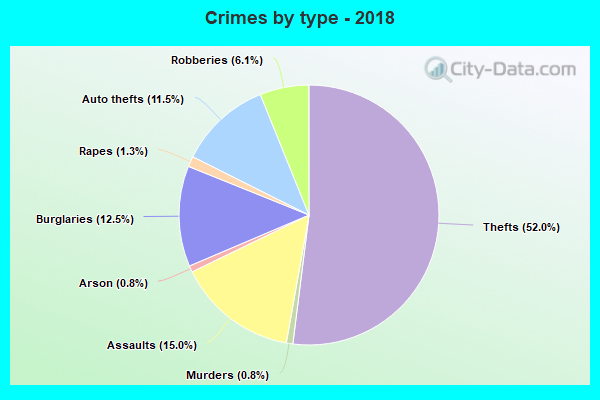
Property crime rate in 2018
| St. Louis: | 530.8 |
| U.S. Average: | 190.2 |
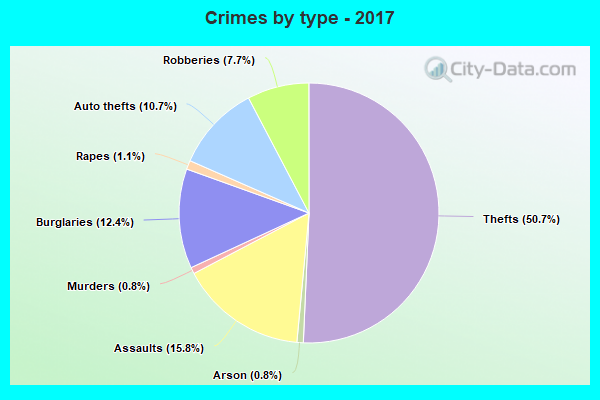
Property crime rate in 2017
| St. Louis: | 541.2 |
| U.S. Average: | 206.4 |
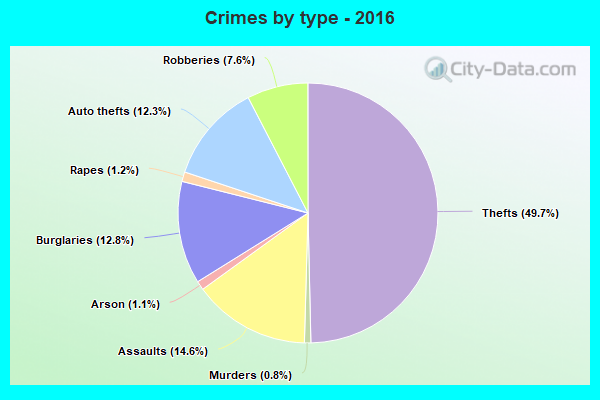
Property crime rate in 2016
| St. Louis: | 546.4 |
| U.S. Average: | 216.6 |
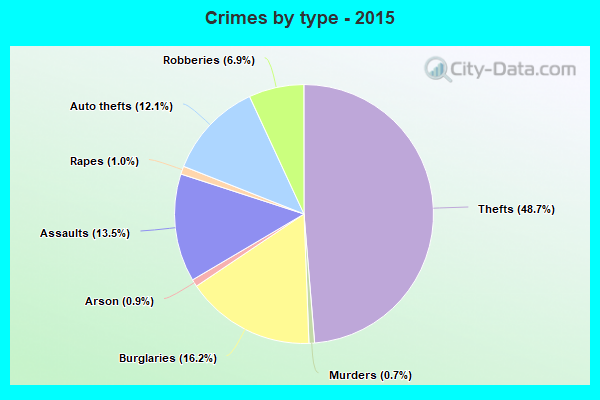
Property crime rate in 2015
| St. Louis: | 613.8 |
| U.S. Average: | 221.5 |
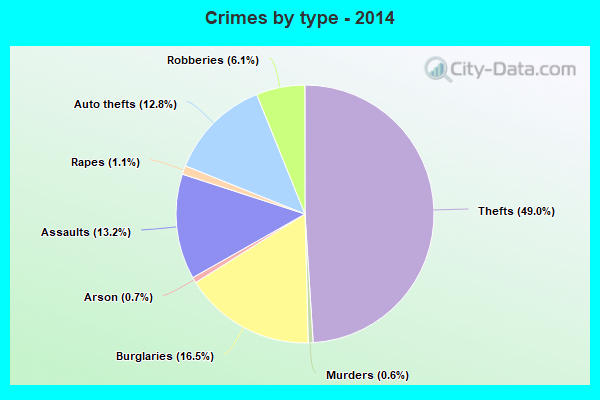
Property crime rate in 2014
| St. Louis: | 612.7 |
| U.S. Average: | 230.8 |
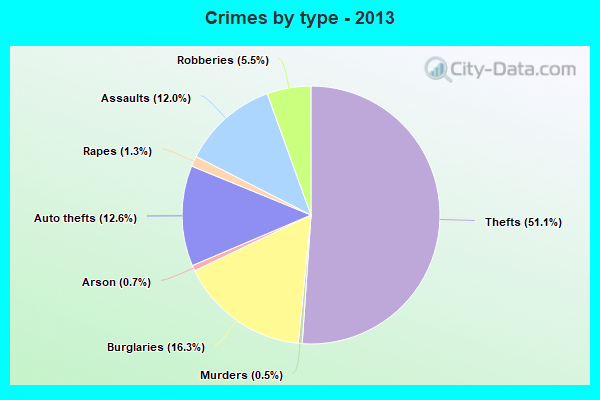
Property crime rate in 2013
| St. Louis: | 638.2 |
| U.S. Average: | 250.4 |
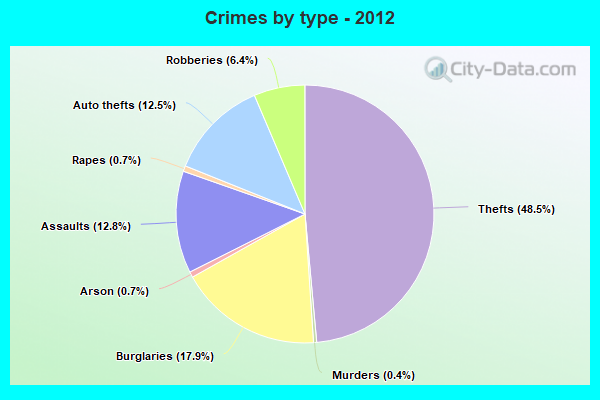
Property crime rate in 2012
| St. Louis: | 689.3 |
| U.S. Average: | 267.3 |
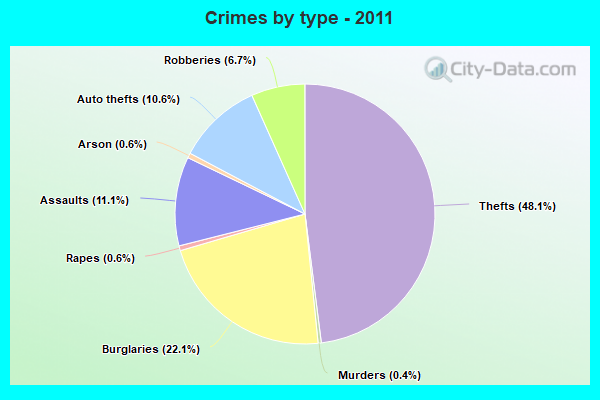
Property crime rate in 2011
| St. Louis: | 834.0 |
| U.S. Average: | 273.5 |
Property crime rate in 2010
| St. Louis: | 876.4 |
| U.S. Average: | 276.4 |
Property crime rate in 2009
| St. Louis: | 844.9 |
| U.S. Average: | 285.6 |
Property crime rate in 2008
| St. Louis: | 897.6 |
| U.S. Average: | 302.2 |
Property crime rate in 2007
| St. Louis: | 729.7 |
| U.S. Average: | 309.2 |
Property crime rate in 2006
| St. Louis: | 895.4 |
| U.S. Average: | 317.3 |
Property crime rate in 2005
| St. Louis: | 818.6 |
| U.S. Average: | 322.3 |

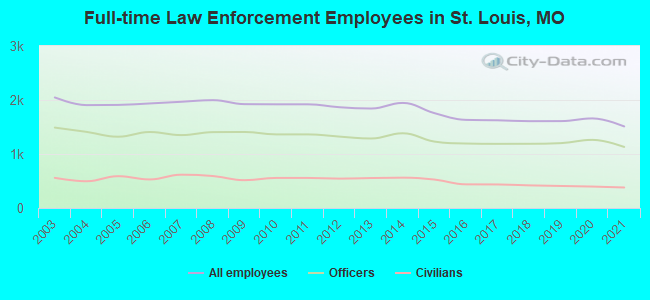
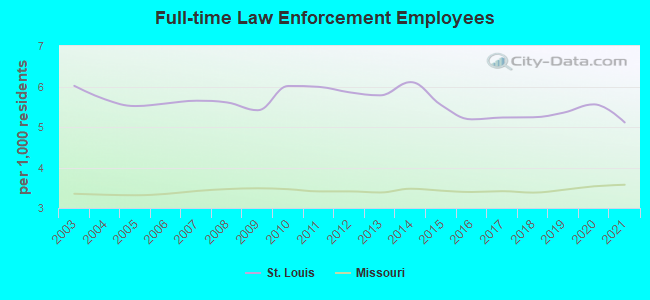
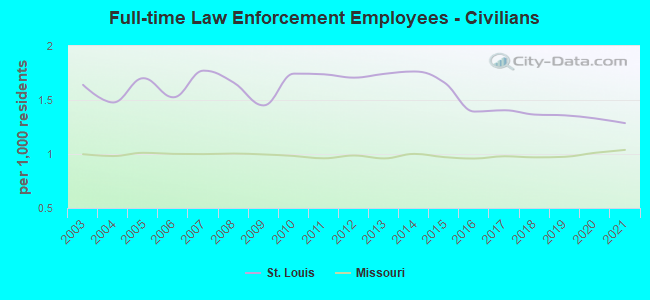
Full-time law enforcement employees in 2021, including police officers: 1,511 (1,131 officers - 944 male; 187 female).
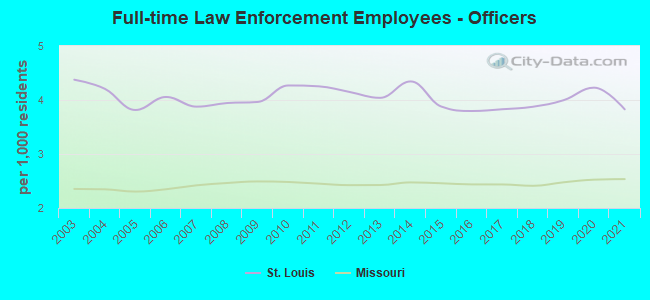
| Officers per 1,000 residents here: | 3.83 |
| Missouri average: | 2.54 |
Full-time law enforcement employees in 2020, including police officers: 1,659 (1,262 officers - 1,056 male; 206 female).
| Officers per 1,000 residents here: | 4.23 |
| Missouri average: | 2.53 |
Full-time law enforcement employees in 2019, including police officers: 1,609 (1,201 officers - 1,004 male; 197 female).
| Officers per 1,000 residents here: | 4.00 |
| Missouri average: | 2.48 |
Full-time law enforcement employees in 2018, including police officers: 1,608 (1,189 officers - 1,002 male; 187 female).
| Officers per 1,000 residents here: | 3.87 |
| Missouri average: | 2.41 |
Full-time law enforcement employees in 2017, including police officers: 1,624 (1,188 officers - 998 male; 190 female).
| Officers per 1,000 residents here: | 3.83 |
| Missouri average: | 2.44 |
Full-time law enforcement employees in 2016, including police officers: 1,632 (1,194 officers - 1,000 male; 194 female).
| Officers per 1,000 residents here: | 3.80 |
| Missouri average: | 2.44 |
Full-time law enforcement employees in 2015, including police officers: 1,757 (1,230 officers - 1,029 male; 201 female).
| Officers per 1,000 residents here: | 3.88 |
| Missouri average: | 2.46 |
Full-time law enforcement employees in 2014, including police officers: 1,946 (1,384 officers - 1,163 male; 221 female).
| Officers per 1,000 residents here: | 4.34 |
| Missouri average: | 2.47 |
Full-time law enforcement employees in 2013, including police officers: 1,842 (1,287 officers - 1,085 male; 202 female).
| Officers per 1,000 residents here: | 4.04 |
| Missouri average: | 2.42 |
Full-time law enforcement employees in 2012, including police officers: 1,866 (1,322 officers - 1,112 male; 210 female).
| Officers per 1,000 residents here: | 4.15 |
| Missouri average: | 2.42 |
Full-time law enforcement employees in 2011, including police officers: 1,920 (1,363 officers - 1,145 male; 218 female).
| Officers per 1,000 residents here: | 4.25 |
| Missouri average: | 2.45 |
Full-time law enforcement employees in 2010, including police officers: 1,920 (1,363 officers - 1,148 male; 215 female).
| Officers per 1,000 residents here: | 4.27 |
| Missouri average: | 2.48 |
Full-time law enforcement employees in 2009, including police officers: 1,923 (1,408 officers - 1,188 male; 220 female).
| Officers per 1,000 residents here: | 3.96 |
| Missouri average: | 2.49 |
Full-time law enforcement employees in 2008, including police officers: 1,997 (1,405 officers - 1,193 male; 212 female).
| Officers per 1,000 residents here: | 3.94 |
| Missouri average: | 2.46 |
Full-time law enforcement employees in 2007, including police officers: 1,967 (1,350 officers - 1,142 male; 208 female).
| Officers per 1,000 residents here: | 3.88 |
| Missouri average: | 2.42 |
Full-time law enforcement employees in 2006, including police officers: 1,936 (1,407 officers - 1,205 male; 202 female).
| Officers per 1,000 residents here: | 4.06 |
| Missouri average: | 2.35 |
Full-time law enforcement employees in 2005, including police officers: 1,909 (1,320 officers - 1,127 male; 193 female).
| Officers per 1,000 residents here: | 3.81 |
| Missouri average: | 2.30 |
Full-time law enforcement employees in 2004, including police officers: 1,905 (1,410 officers - 1,207 male; 203 female).
| Officers per 1,000 residents here: | 4.21 |
| Missouri average: | 2.35 |
Full-time law enforcement employees in 2003, including police officers: 2,047 (1,489 officers - 1,280 male; 209 female).
| Officers per 1,000 residents here: | 4.38 |
| Missouri average: | 2.35 |

Zip codes: 63101, 63102, 63103, 63104, 63106, 63107, 63108, 63109, 63110, 63111, 63112, 63113, 63115, 63116, 63118, 63139, 63147, 63155.