Crime rate in Washington, District of Columbia (DC): murders, rapes, robberies, assaults, burglaries, thefts, auto thefts, arson, law enforcement employees, police officers, crime map
Crime rate in Washington, DC
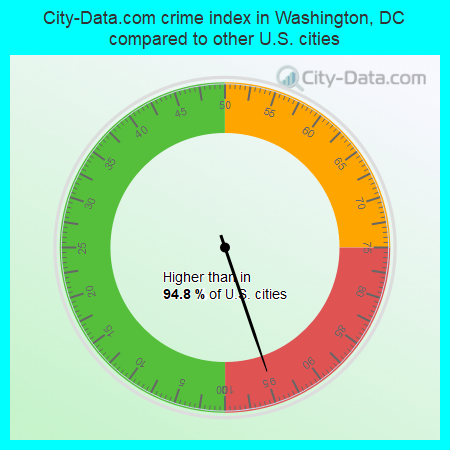
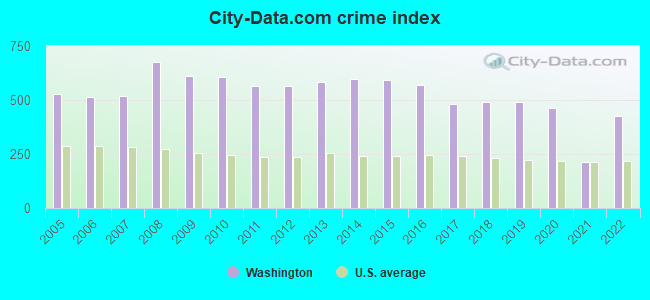
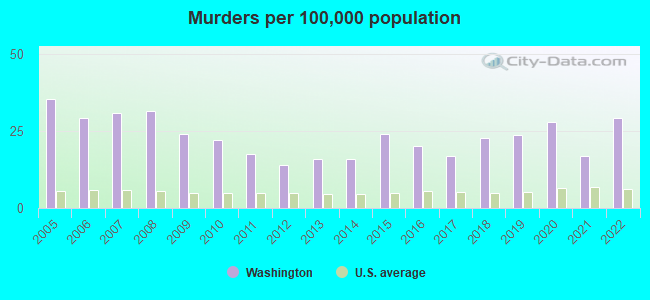
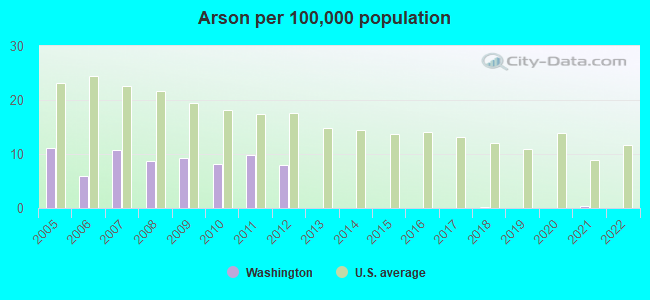
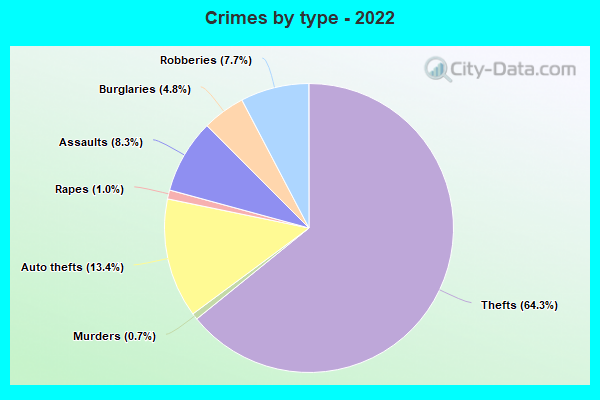
The 2022 crime rate in Washington, DC is 427 (City-Data.com crime index), which is 1.7 times higher than the U.S. average. It was higher than in 94.8% U.S. cities. The 2022 Washington crime rate rose by 101% compared to 2021. The number of homicides stood at 197 - an increase of 83 compared to 2021. In the last 5 years Washington has seen decreasing violent crime and decreasing property crime.(Note: Higher means more crime)
| Washington: | 426.6 |
| Mount Rainier: | 297.3 |
| Brentwood: | 17.5 |
| Cottage City: | 106.6 |
| Colmar Manor: | 209.8 |
| Hyattsville: | 338.4 |
| Takoma Park: | 229.5 |
| Bladensburg: | 233.3 |
| Edmonston: | 59.7 |
The City-Data.com crime index weighs serious crimes and violent crimes more heavily. Higher means more crime, U.S. average is 246.1. It adjusts for the number of visitors and daily workers commuting into cities.
- means the value is smaller than the state average.- means the value is about the same as the state average.
- means the value is bigger than the state average.
- means the value is much bigger than the state average.
According to our research of District of Columbia and other state lists, there were 1,077 registered sex offenders living in Washington, District of Columbia as of April 17, 2024.
The ratio of all residents to sex offenders in Washington is 632 to 1.
The ratio of registered sex offenders to all residents in this city is near the state average.
Violent crime rate in 2022
| Washington: | 436.8 |
| U.S. Average: | 219.8 |
Violent crime rate in 2021
| Washington: | 220.5 |
| U.S. Average: | 224.8 |
Violent crime rate in 2020
| Washington: | 542.1 |
| U.S. Average: | 228.2 |
Violent crime rate in 2019
| Washington: | 548.1 |
| U.S. Average: | 219.9 |
Violent crime rate in 2018
| Washington: | 536.5 |
| U.S. Average: | 221.2 |
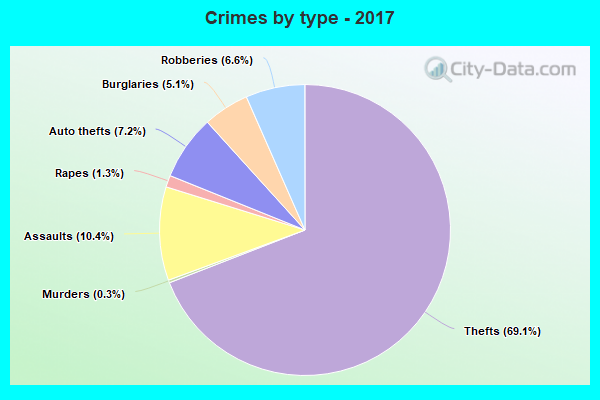
Violent crime rate in 2017
| Washington: | 531.4 |
| U.S. Average: | 226.2 |
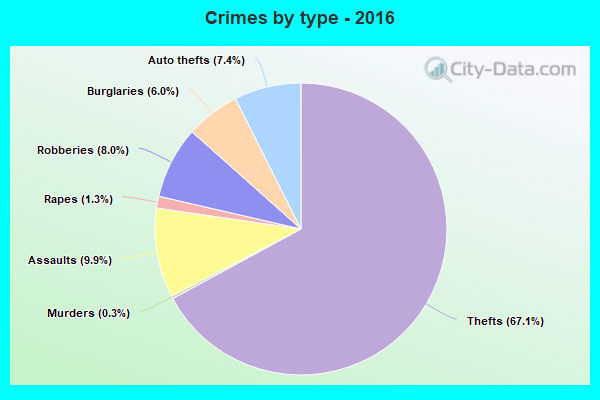
Violent crime rate in 2016
| Washington: | 634.8 |
| U.S. Average: | 227.3 |
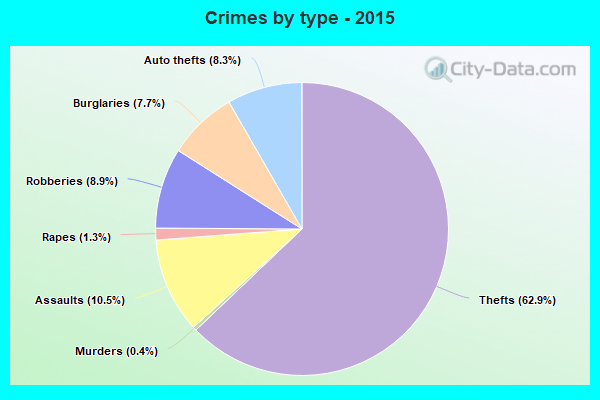
Violent crime rate in 2015
| Washington: | 674.2 |
| U.S. Average: | 219.3 |
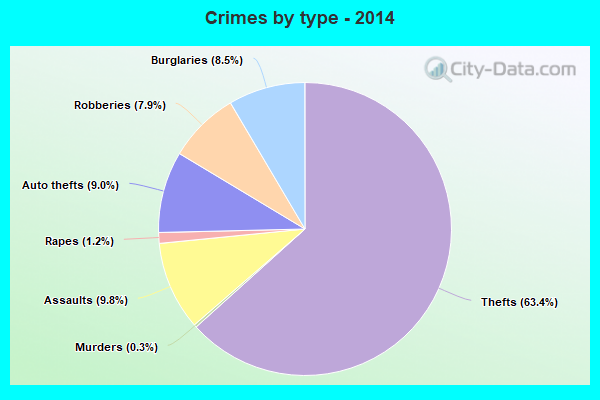
Violent crime rate in 2014
| Washington: | 652.2 |
| U.S. Average: | 211.1 |
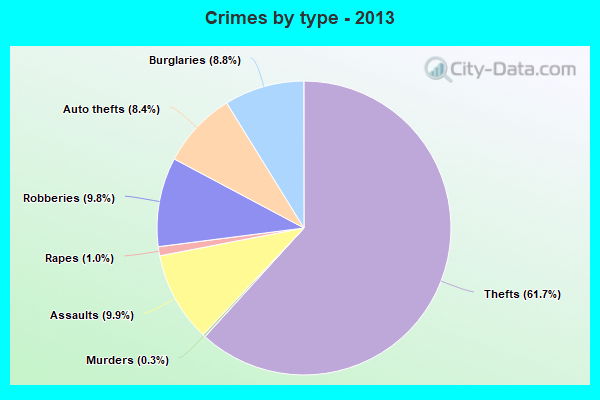
Violent crime rate in 2013
| Washington: | 663.8 |
| U.S. Average: | 214.2 |
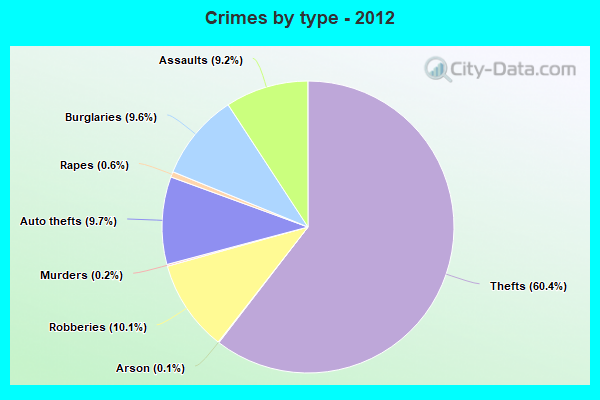
Violent crime rate in 2012
| Washington: | 628.5 |
| U.S. Average: | 187.4 |
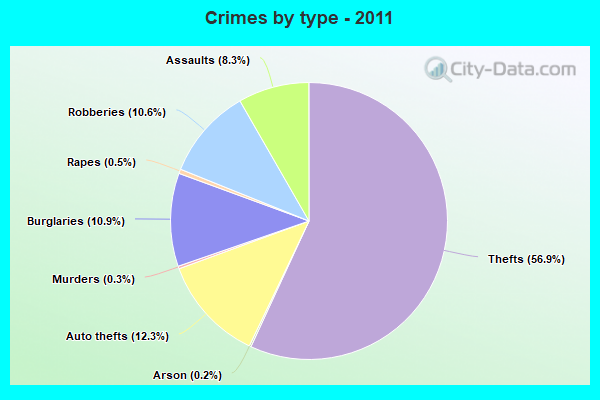
Violent crime rate in 2011
| Washington: | 605.3 |
| U.S. Average: | 187.1 |
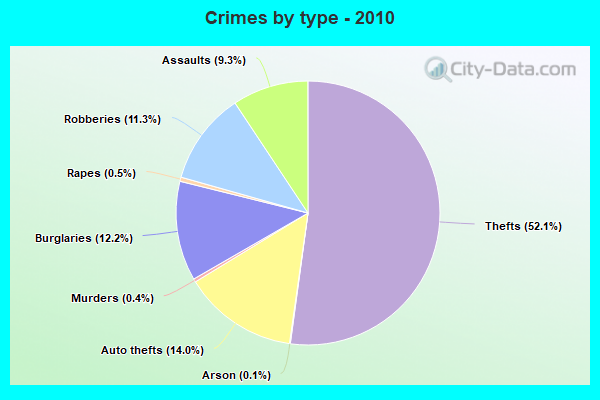
Violent crime rate in 2010
| Washington: | 668.7 |
| U.S. Average: | 195.7 |
Violent crime rate in 2009
| Washington: | 681.1 |
| U.S. Average: | 208.9 |
Violent crime rate in 2008
| Washington: | 750.1 |
| U.S. Average: | 222.5 |
Violent crime rate in 2007
| Washington: | 567.1 |
| U.S. Average: | 229.1 |
Violent crime rate in 2006
| Washington: | 602.7 |
| U.S. Average: | 232.6 |
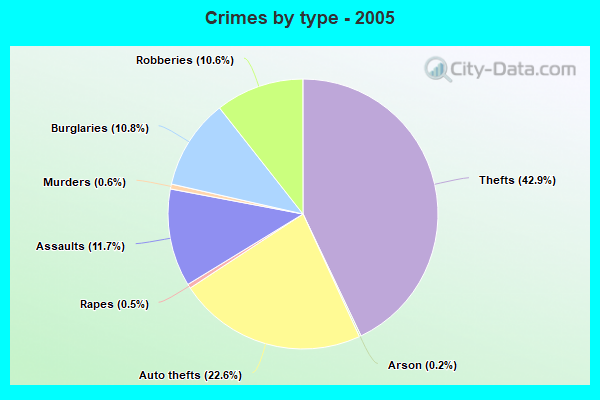
Violent crime rate in 2005
| Washington: | 592.5 |
| U.S. Average: | 227.0 |
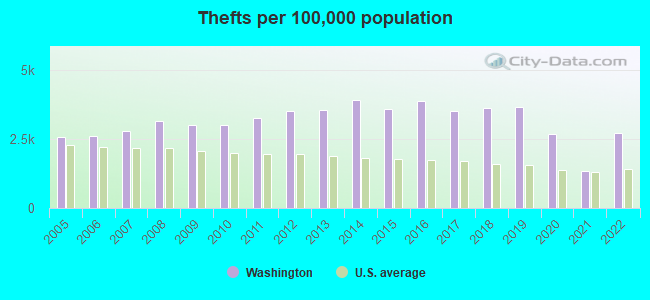
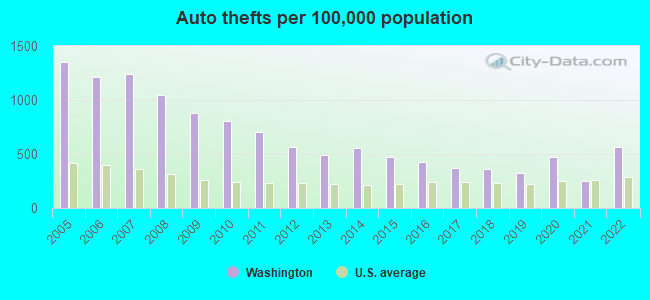
Property crime rate in 2022
| Washington: | 260.8 |
| U.S. Average: | 166.5 |
Property crime rate in 2021
| Washington: | 127.3 |
| U.S. Average: | 157.8 |
Property crime rate in 2020
| Washington: | 260.2 |
| U.S. Average: | 169.6 |
Property crime rate in 2019
| Washington: | 284.0 |
| U.S. Average: | 179.7 |
Property crime rate in 2018
| Washington: | 287.9 |
| U.S. Average: | 190.2 |
Property crime rate in 2017
| Washington: | 283.6 |
| U.S. Average: | 206.4 |
Property crime rate in 2016
| Washington: | 326.9 |
| U.S. Average: | 216.6 |
Property crime rate in 2015
| Washington: | 339.6 |
| U.S. Average: | 221.5 |
Property crime rate in 2014
| Washington: | 385.4 |
| U.S. Average: | 230.8 |
Property crime rate in 2013
| Washington: | 354.3 |
| U.S. Average: | 250.4 |
Property crime rate in 2012
| Washington: | 371.0 |
| U.S. Average: | 267.3 |
Property crime rate in 2011
| Washington: | 392.7 |
| U.S. Average: | 273.5 |
Property crime rate in 2010
| Washington: | 411.6 |
| U.S. Average: | 276.4 |
Property crime rate in 2009
| Washington: | 406.0 |
| U.S. Average: | 285.6 |
Property crime rate in 2008
| Washington: | 443.4 |
| U.S. Average: | 302.2 |
Property crime rate in 2007
| Washington: | 354.5 |
| U.S. Average: | 309.2 |
Property crime rate in 2006
| Washington: | 341.9 |
| U.S. Average: | 317.3 |
Property crime rate in 2005
| Washington: | 355.9 |
| U.S. Average: | 322.3 |
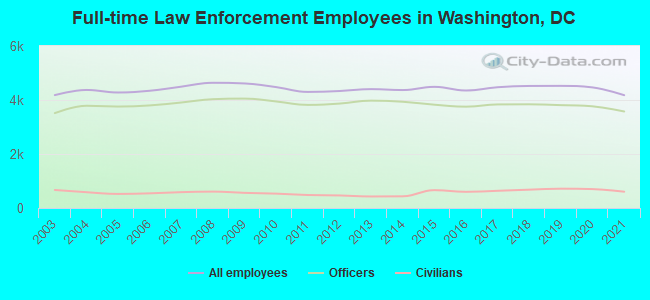
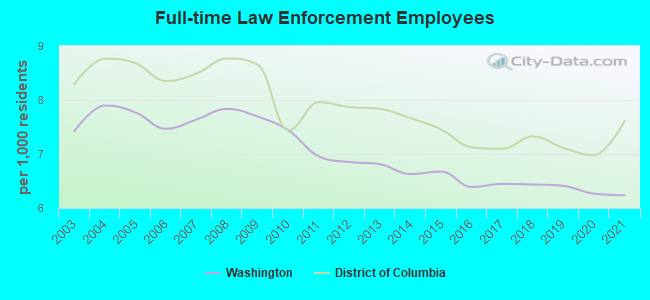
Full-time law enforcement employees in 2021, including police officers: 4,179 (3,575 officers - 2,753 male; 822 female).
| Officers per 1,000 residents here: | 5.34 |
| District of Columbia average: | 6.01 |
Full-time law enforcement employees in 2020, including police officers: 4,466 (3,766 officers - 2,918 male; 848 female).
| Officers per 1,000 residents here: | 5.28 |
| District of Columbia average: | 5.87 |
Full-time law enforcement employees in 2019, including police officers: 4,524 (3,809 officers - 2,952 male; 857 female).
| Officers per 1,000 residents here: | 5.40 |
| District of Columbia average: | 5.99 |
Full-time law enforcement employees in 2018, including police officers: 4,520 (3,841 officers - 2,997 male; 844 female).
| Officers per 1,000 residents here: | 5.47 |
| District of Columbia average: | 6.25 |
Full-time law enforcement employees in 2017, including police officers: 4,473 (3,836 officers - 2,993 male; 843 female).
| Officers per 1,000 residents here: | 5.53 |
| District of Columbia average: | 6.09 |
Full-time law enforcement employees in 2016, including police officers: 4,352 (3,753 officers - 2,958 male; 795 female).
| Officers per 1,000 residents here: | 5.51 |
| District of Columbia average: | 6.13 |
Full-time law enforcement employees in 2015, including police officers: 4,487 (3,826 officers - 3,004 male; 822 female).
| Officers per 1,000 residents here: | 5.69 |
| District of Columbia average: | 6.34 |
Full-time law enforcement employees in 2014, including police officers: 4,368 (3,935 officers - 3,062 male; 873 female).
| Officers per 1,000 residents here: | 5.97 |
| District of Columbia average: | 6.88 |
Full-time law enforcement employees in 2013, including police officers: 4,403 (3,976 officers - 3,089 male; 887 female).
| Officers per 1,000 residents here: | 6.15 |
| District of Columbia average: | 7.08 |
Full-time law enforcement employees in 2012, including police officers: 4,332 (3,867 officers - 2,980 male; 887 female).
| Officers per 1,000 residents here: | 6.12 |
| District of Columbia average: | 6.82 |
Full-time law enforcement employees in 2011, including police officers: 4,299 (3,818 officers - 2,942 male; 876 female).
| Officers per 1,000 residents here: | 6.18 |
| District of Columbia average: | 6.88 |
Full-time law enforcement employees in 2010, including police officers: 4,477 (3,945 officers - 3,046 male; 899 female).
| Officers per 1,000 residents here: | 6.56 |
| District of Columbia average: | 6.56 |
Full-time law enforcement employees in 2009, including police officers: 4,613 (4,052 officers - 3,140 male; 912 female).
| Officers per 1,000 residents here: | 6.76 |
| District of Columbia average: | 7.46 |
Full-time law enforcement employees in 2008, including police officers: 4,637 (4,030 officers - 3,102 male; 928 female).
| Officers per 1,000 residents here: | 6.81 |
| District of Columbia average: | 7.53 |
Full-time law enforcement employees in 2007, including police officers: 4,494 (3,907 officers - 2,995 male; 912 female).
| Officers per 1,000 residents here: | 6.64 |
| District of Columbia average: | 7.27 |
Full-time law enforcement employees in 2006, including police officers: 4,342 (3,799 officers - 2,905 male; 894 female).
| Officers per 1,000 residents here: | 6.53 |
| District of Columbia average: | 7.18 |
Full-time law enforcement employees in 2005, including police officers: 4,278 (3,757 officers - 2,871 male; 886 female).
| Officers per 1,000 residents here: | 6.82 |
| District of Columbia average: | 7.51 |
Full-time law enforcement employees in 2004, including police officers: 4,372 (3,787 officers - 2,884 male; 903 female).
| Officers per 1,000 residents here: | 6.84 |
| District of Columbia average: | 7.48 |
Full-time law enforcement employees in 2003, including police officers: 4,182 (3,515 officers - 2,674 male; 841 female).
| Officers per 1,000 residents here: | 6.24 |
| District of Columbia average: | 6.89 |
Zip codes: 20001, 20002, 20003, 20004, 20005, 20006, 20007, 20008, 20009, 20010, 20011, 20012, 20015, 20016, 20017, 20018, 20019, 20020, 20024, 20032, 20036, 20037, 20045, 20052, 20053, 20057, 20064, 20202, 20204, 20228, 20230, 20240, 20245, 20260, 20307, 20317, 20319, 20373, 20390, 20405, 20418, 20427, 20506, 20510, 20520, 20535, 20540, 20551, 20553, 20560, 20565, 20566, 20593.