Crime rate in Wichita Falls, Texas (TX): murders, rapes, robberies, assaults, burglaries, thefts, auto thefts, arson, law enforcement employees, police officers, crime map
Crime rate in Wichita Falls, TX
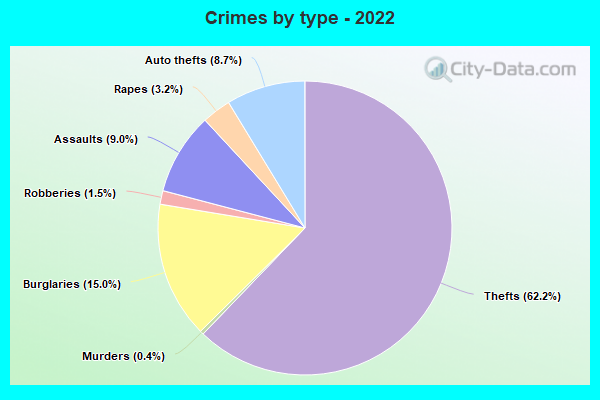
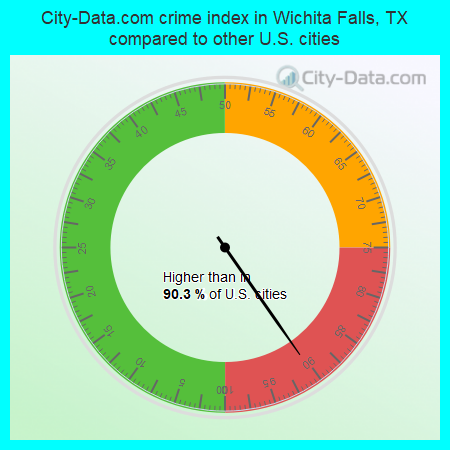
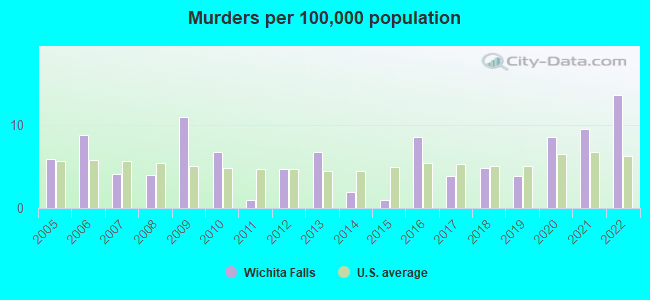
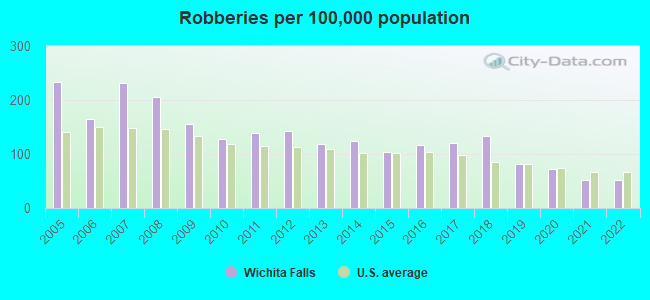
The 2022 crime rate in Wichita Falls, TX is 329 (City-Data.com crime index), which is 1.3 times greater than the U.S. average. It was higher than in 90.3% U.S. cities. The 2022 Wichita Falls crime rate fell by 9% compared to 2021. The number of homicides stood at 14 - an increase of 4 compared to 2021. In the last 5 years Wichita Falls has seen increasing violent crime and decline of property crime.See how dangerous Wichita Falls, TX is compared to the nearest cities:
(Note: Higher means more crime)
(Note: Higher means more crime)
| Wichita Falls: | 328.8 |
| Iowa Park: | 39.6 |
| Holliday: | 10.6 |
| Burkburnett: | 138.7 |
| Archer City: | 82.9 |
| Electra: | 129.5 |
| Grandfield: | 180.9 |
| Walters: | 156.3 |
| Waurika: | 281.1 |
The City-Data.com crime index weighs serious crimes and violent crimes more heavily. Higher means more crime, U.S. average is 246.1. It adjusts for the number of visitors and daily workers commuting into cities.
- means the value is smaller than the state average.- means the value is about the same as the state average.
- means the value is bigger than the state average.
- means the value is much bigger than the state average.
According to our research of Texas and other state lists, there were 251 registered sex offenders living in Wichita Falls, Texas as of April 25, 2024.
The ratio of all residents to sex offenders in Wichita Falls is 417 to 1.
The ratio of registered sex offenders to all residents in this city is near the state average.
Violent crime rate in 2022
| Wichita Falls: | 308.7 |
| U.S. Average: | 219.8 |
Violent crime rate in 2021
| Wichita Falls: | 357.9 |
| U.S. Average: | 224.8 |
Violent crime rate in 2020
| Wichita Falls: | 245.5 |
| U.S. Average: | 228.2 |
Violent crime rate in 2019
| Wichita Falls: | 229.1 |
| U.S. Average: | 219.9 |
Violent crime rate in 2018
| Wichita Falls: | 229.1 |
| U.S. Average: | 221.2 |
Violent crime rate in 2017
| Wichita Falls: | 221.6 |
| U.S. Average: | 226.2 |
Violent crime rate in 2016
| Wichita Falls: | 284.7 |
| U.S. Average: | 227.3 |
Violent crime rate in 2015
| Wichita Falls: | 234.8 |
| U.S. Average: | 219.3 |
Violent crime rate in 2014
| Wichita Falls: | 247.3 |
| U.S. Average: | 211.1 |
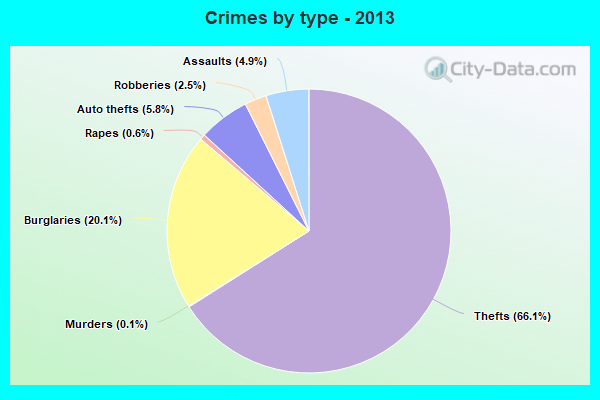
Violent crime rate in 2013
| Wichita Falls: | 215.8 |
| U.S. Average: | 214.2 |
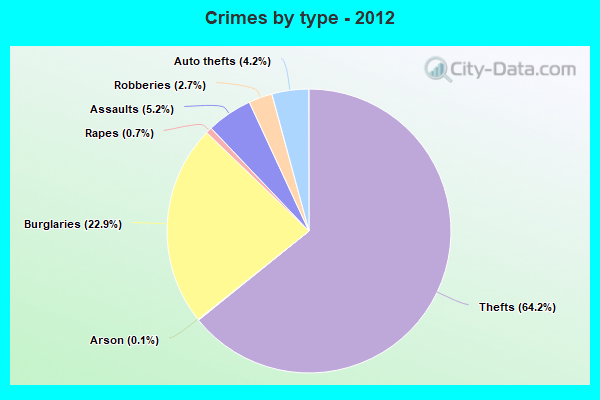
Violent crime rate in 2012
| Wichita Falls: | 249.3 |
| U.S. Average: | 187.4 |
Violent crime rate in 2011
| Wichita Falls: | 230.4 |
| U.S. Average: | 187.1 |
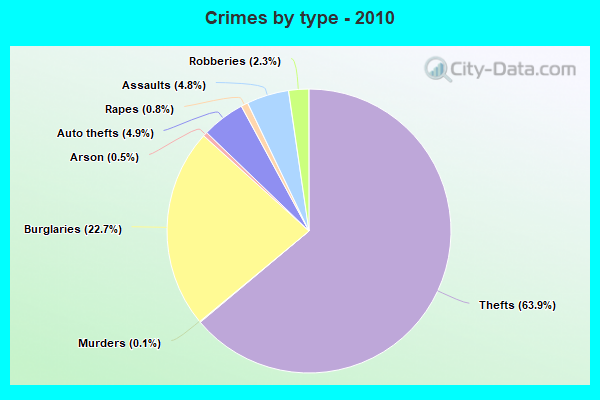
Violent crime rate in 2010
| Wichita Falls: | 252.5 |
| U.S. Average: | 195.7 |
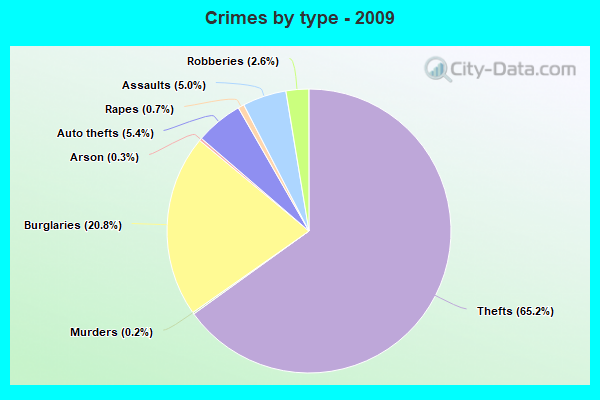
Violent crime rate in 2009
| Wichita Falls: | 296.9 |
| U.S. Average: | 208.9 |
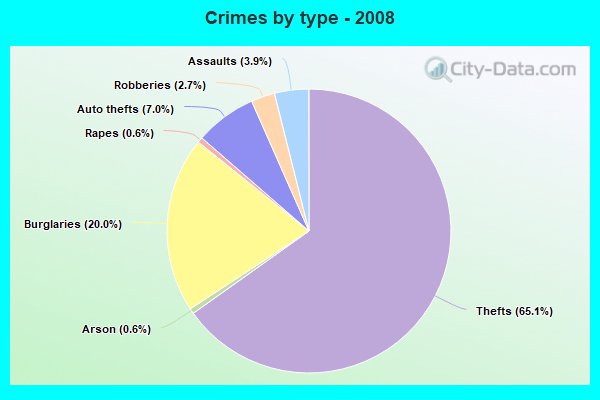
Violent crime rate in 2008
| Wichita Falls: | 303.6 |
| U.S. Average: | 222.5 |
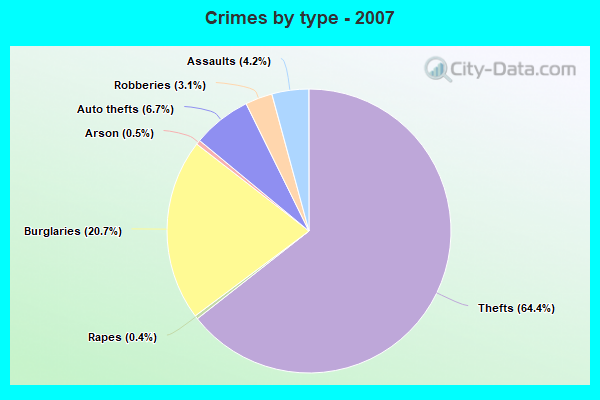
Violent crime rate in 2007
| Wichita Falls: | 249.6 |
| U.S. Average: | 229.1 |
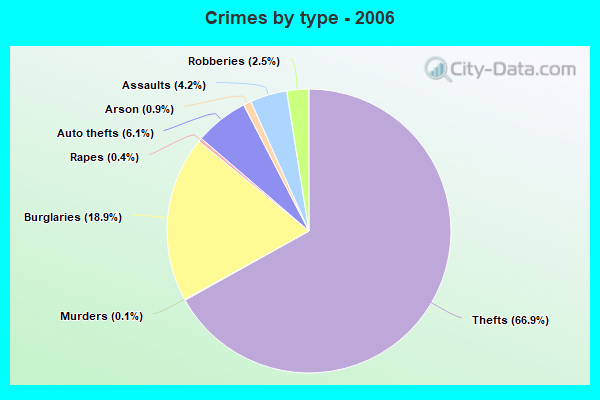
Violent crime rate in 2006
| Wichita Falls: | 211.3 |
| U.S. Average: | 232.6 |
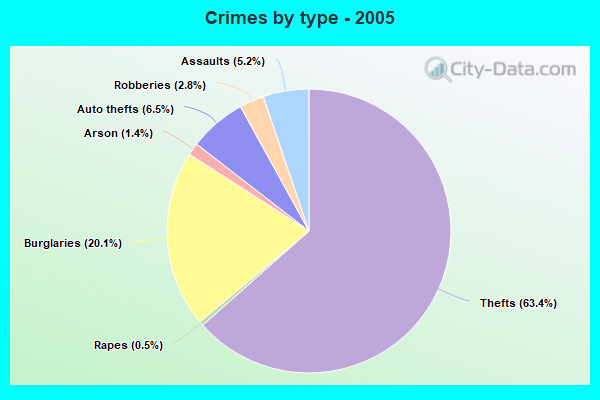
Violent crime rate in 2005
| Wichita Falls: | 308.1 |
| U.S. Average: | 227.0 |
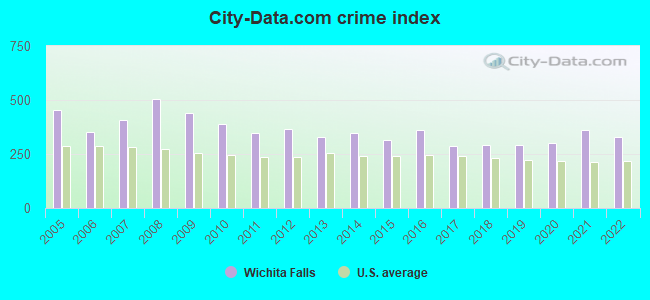
Property crime rate in 2022
| Wichita Falls: | 247.4 |
| U.S. Average: | 166.5 |
Property crime rate in 2021
| Wichita Falls: | 281.7 |
| U.S. Average: | 157.8 |
Property crime rate in 2020
| Wichita Falls: | 274.0 |
| U.S. Average: | 169.6 |
Property crime rate in 2019
| Wichita Falls: | 254.3 |
| U.S. Average: | 179.7 |
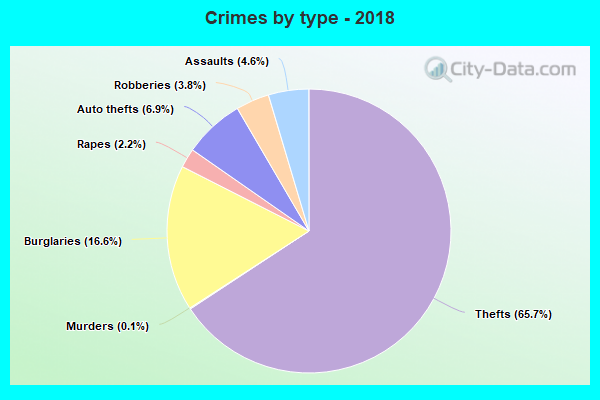
Property crime rate in 2018
| Wichita Falls: | 264.6 |
| U.S. Average: | 190.2 |
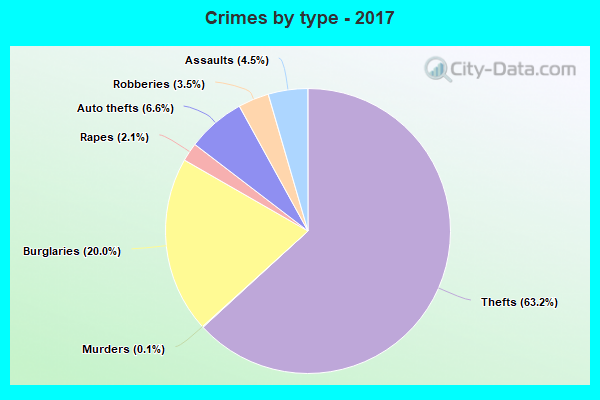
Property crime rate in 2017
| Wichita Falls: | 282.1 |
| U.S. Average: | 206.4 |
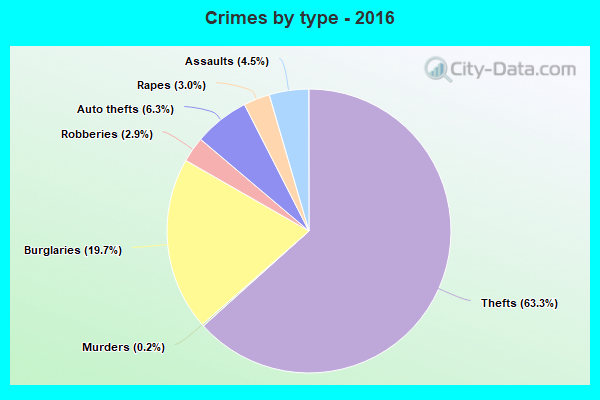
Property crime rate in 2016
| Wichita Falls: | 321.7 |
| U.S. Average: | 216.6 |
Property crime rate in 2015
| Wichita Falls: | 326.1 |
| U.S. Average: | 221.5 |
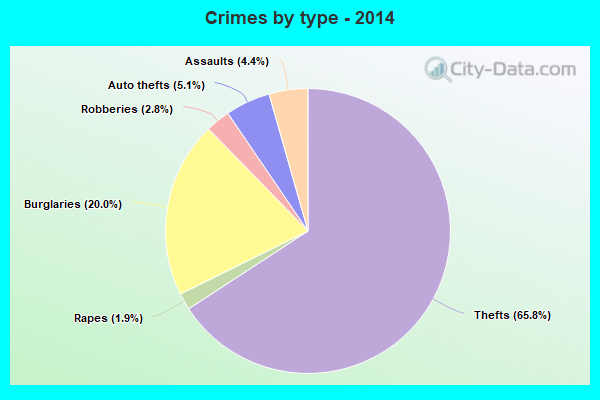
Property crime rate in 2014
| Wichita Falls: | 359.7 |
| U.S. Average: | 230.8 |
Property crime rate in 2013
| Wichita Falls: | 388.2 |
| U.S. Average: | 250.4 |
Property crime rate in 2012
| Wichita Falls: | 438.8 |
| U.S. Average: | 267.3 |
Property crime rate in 2011
| Wichita Falls: | 425.0 |
| U.S. Average: | 273.5 |
Property crime rate in 2010
| Wichita Falls: | 470.5 |
| U.S. Average: | 276.4 |
Property crime rate in 2009
| Wichita Falls: | 501.0 |
| U.S. Average: | 285.6 |
Property crime rate in 2008
| Wichita Falls: | 621.2 |
| U.S. Average: | 302.2 |
Property crime rate in 2007
| Wichita Falls: | 502.1 |
| U.S. Average: | 309.2 |
Property crime rate in 2006
| Wichita Falls: | 426.4 |
| U.S. Average: | 317.3 |
Property crime rate in 2005
| Wichita Falls: | 537.6 |
| U.S. Average: | 322.3 |
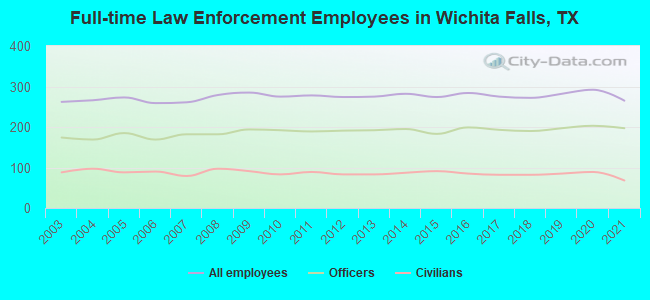
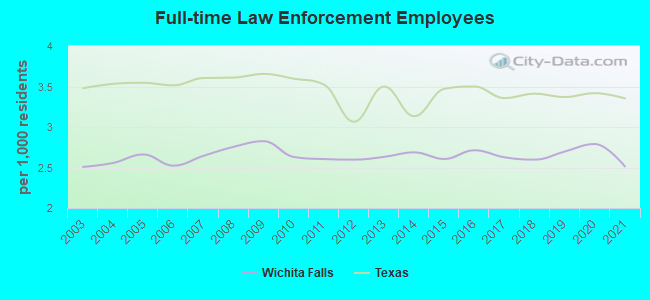
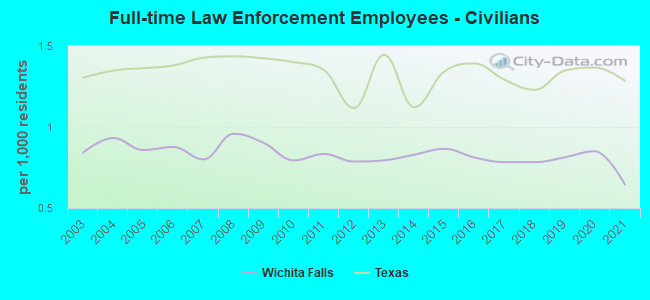
Full-time law enforcement employees in 2021, including police officers: 265 (197 officers - 183 male; 14 female).
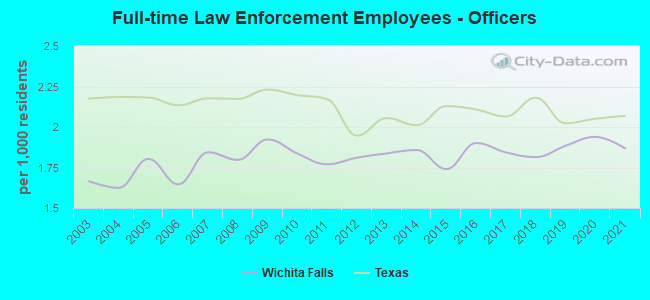
| Officers per 1,000 residents here: | 1.87 |
| Texas average: | 2.07 |
Full-time law enforcement employees in 2020, including police officers: 292 (203 officers - 191 male; 12 female).
| Officers per 1,000 residents here: | 1.94 |
| Texas average: | 2.05 |
Full-time law enforcement employees in 2019, including police officers: 282 (197 officers - 184 male; 13 female).
| Officers per 1,000 residents here: | 1.88 |
| Texas average: | 2.02 |
Full-time law enforcement employees in 2018, including police officers: 272 (190 officers - 179 male; 11 female).
| Officers per 1,000 residents here: | 1.81 |
| Texas average: | 2.18 |
Full-time law enforcement employees in 2017, including police officers: 275 (193 officers - 179 male; 14 female).
| Officers per 1,000 residents here: | 1.84 |
| Texas average: | 2.06 |
Full-time law enforcement employees in 2016, including police officers: 284 (199 officers - 182 male; 17 female).
| Officers per 1,000 residents here: | 1.90 |
| Texas average: | 2.11 |
Full-time law enforcement employees in 2015, including police officers: 274 (183 officers - 166 male; 17 female).
| Officers per 1,000 residents here: | 1.74 |
| Texas average: | 2.13 |
Full-time law enforcement employees in 2014, including police officers: 282 (195 officers - 172 male; 23 female).
| Officers per 1,000 residents here: | 1.86 |
| Texas average: | 2.01 |
Full-time law enforcement employees in 2013, including police officers: 275 (192 officers - 176 male; 16 female).
| Officers per 1,000 residents here: | 1.84 |
| Texas average: | 2.05 |
Full-time law enforcement employees in 2012, including police officers: 274 (191 officers - 173 male; 18 female).
| Officers per 1,000 residents here: | 1.81 |
| Texas average: | 1.95 |
Full-time law enforcement employees in 2011, including police officers: 278 (189 officers - 171 male; 18 female).
| Officers per 1,000 residents here: | 1.77 |
| Texas average: | 2.17 |
Full-time law enforcement employees in 2010, including police officers: 275 (192 officers - 174 male; 18 female).
| Officers per 1,000 residents here: | 1.84 |
| Texas average: | 2.20 |
Full-time law enforcement employees in 2009, including police officers: 285 (194 officers - 175 male; 19 female).
| Officers per 1,000 residents here: | 1.92 |
| Texas average: | 2.23 |
Full-time law enforcement employees in 2008, including police officers: 279 (182 officers - 164 male; 18 female).
| Officers per 1,000 residents here: | 1.80 |
| Texas average: | 2.17 |
Full-time law enforcement employees in 2007, including police officers: 261 (182 officers - 164 male; 18 female).
| Officers per 1,000 residents here: | 1.84 |
| Texas average: | 2.18 |
Full-time law enforcement employees in 2006, including police officers: 259 (169 officers - 152 male; 17 female).
| Officers per 1,000 residents here: | 1.65 |
| Texas average: | 2.13 |
Full-time law enforcement employees in 2005, including police officers: 273 (185 officers - 167 male; 18 female).
| Officers per 1,000 residents here: | 1.80 |
| Texas average: | 2.18 |
Full-time law enforcement employees in 2004, including police officers: 266 (169 officers - 152 male; 17 female).
| Officers per 1,000 residents here: | 1.62 |
| Texas average: | 2.19 |
Full-time law enforcement employees in 2003, including police officers: 262 (174 officers - 154 male; 20 female).
| Officers per 1,000 residents here: | 1.66 |
| Texas average: | 2.17 |